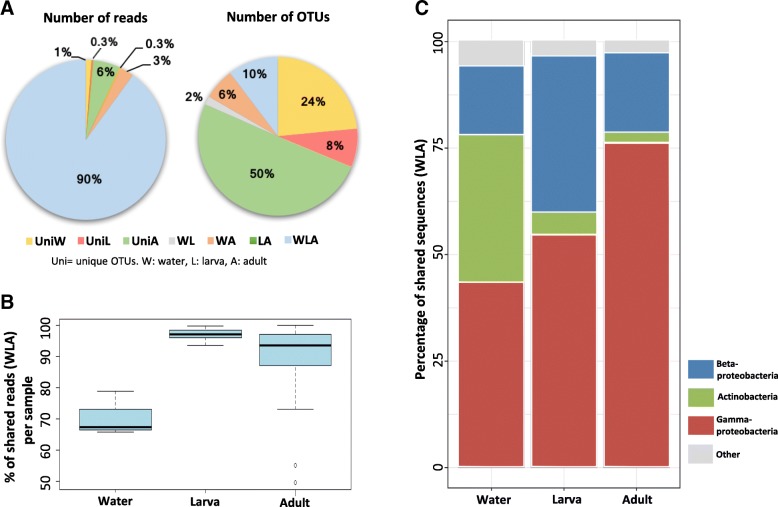
Fig. 2.
a Percentage of reads and OTUs that were unique or shared between sample types. OTUs shared by all groups accounted for 90% of the total reads and 10% of the total OTUs. b Boxplots showing the percentage of reads corresponding to OTUs shared among the three sample types (WLA). Not all shared OTUs are equally distributed across samples. c Relative abundances of the three most dominant bacterial classes: Actinobacteria, Betaproteoabcteria and Gammaproteobacteria, which vary across sample types

