Significance
Climate change is expected to alter streamflow volume and variability in watersheds throughout the world, which will have impacts on agricultural, aquatic, and urban environments. Human modifications such as the building of reservoirs and the extraction of water for agricultural and urban uses, however, are thought to mask climate-induced changes in streamflow. Using observed streamflow data from over 3,000 sites from 1981 to 2015, this work identifies negative trends in streamflow throughout the southern and western portions of the United States and positive trends across the eastern portion of the United States and Canada. Within these regions, streamflow trends from human-modified sites are similar to unimpacted sites, indicating that the signal of climate change is apparent in all streamflow systems.
Keywords: climate change, watershed, streamflow trends, natural flow regime, human-modified flow regime
Abstract
Changes in climate are driving an intensification of the hydrologic cycle and leading to alterations of natural streamflow regimes. Human disturbances such as dams, land-cover change, and water diversions are thought to obscure climate signals in hydrologic systems. As a result, most studies of changing hydroclimatic conditions are limited to areas with natural streamflow. Here, we compare trends in observed streamflow from natural and human-modified watersheds in the United States and Canada for the 1981–2015 water years to evaluate whether comparable responses to climate change are present in both systems. We find that patterns and magnitudes of trends in median daily streamflow, daily streamflow variability, and daily extremes in human-modified watersheds are similar to those from nearby natural watersheds. Streamflow in both systems show negative trends throughout the southern and western United States and positive trends throughout the northeastern United States, the northern Great Plains, and southern prairies of Canada. The trends in both natural and human-modified watersheds are linked to local trends in precipitation and reference evapotranspiration, demonstrating that water management and land-cover change have not substantially altered the effects of climate change on human-modified watersheds compared with nearby natural watersheds.
Streamflow volume and seasonal variability are key indicators of agricultural and urban water availability as well as primary regulators of the distribution and diversity of taxa in freshwater ecosystems (1). As streamflow is generated by precipitation and snowmelt that is not lost to evapotranspiration or groundwater recharge, much of the interannual variability in streamflow can be traced to concurrent variability in climate (2, 3). As concentrations of greenhouse gases continue to increase, spatial and seasonal precipitation patterns are altered (4), the proportion of precipitation falling as snow is reduced (5), and evaporative demand is increased (6). In natural watersheds, these changes can directly affect the timing and volume of streamflow. Due to human modifications of the landscape, however, many streamflow regimes throughout the world, including over one-half of the world’s large river systems, can no longer be considered natural (7). Primary human modifications include reservoir construction and irrigation projects, which, in some cases, can mask, dampen, or even change the sign of natural streamflow trends (8).
Past research using a variety of metrics has demonstrated that streamflow trends in natural watersheds closely follow regional changes in precipitation and evapotranspiration (9, 10). While these studies highlight the influence of climate changes on streamflow trends, they do not investigate trends in human-modified watersheds, which are more common throughout the world. For example, the continental United States contains ∼75,000 dams that have varying degrees of influence on streamflow regimes (11). Since human-modified watersheds are so ubiquitous, characterizing the signature of climate change in these systems is critical for the management of water resources and freshwater ecosystems in the coming century.
We address this knowledge gap by analyzing daily streamflow trends in natural and human-modified systems based on data from 3,119 stream gauges throughout Canada and the United States using 1981–2015 water-year data (SI Appendix, Fig. S1). Of these 3,119 gauges, 570 were classified as being within natural watersheds based on the Hydro-Climatic Data Network (HCDN) of the US Geological Survey (USGS) (12) and the Reference Hydrometric Basin Network (RHBN) of Environment Canada (13), which are screened to include only sites for which streamflow reflects prevailing meteorological conditions with minimal land use change. We concentrate on statistics that assess changes in daily streamflow across a number of ecologically and water resource-relevant characteristics including median daily streamflow, daily streamflow variability [interquartile range (IQR); a measure of seasonal variability], and daily extremes (1st and 99th percentiles, 7-d maximum, and number of days without streamflow per year). We first discuss overall trends in streamflow, then investigate differences in trends between natural and human-modified watersheds, and finally evaluate the relative role of climatic drivers on the streamflow trends. This study does not assess differences in the shape of the hydrograph between human-modified and natural watersheds. While it is very likely that human modification has altered the natural streamflow regime, this study focuses on temporal changes (trends) in summary statistics of streamflow.
Results and Discussion
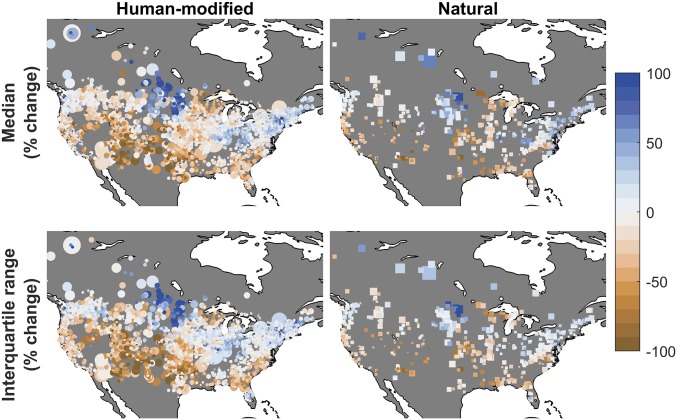
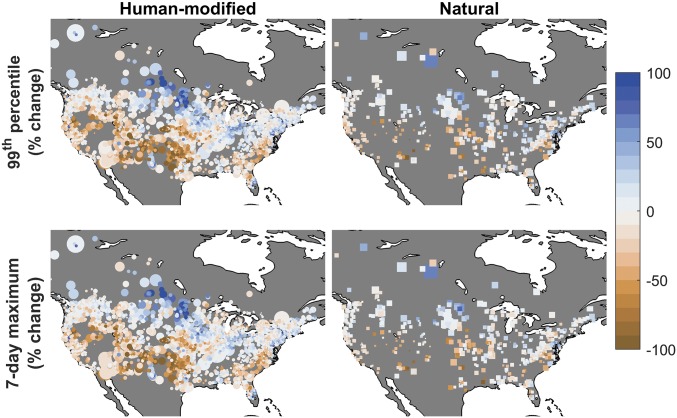
The trend analyses identify regionally distinct changes in recent streamflow throughout the United States and Canada that are largely consistent across all streamflow metrics (Figs. 1–3). We find negative streamflow trends from 1981 to 2015 for all streamflow metrics throughout the southern/southeastern United States and the western United States and Canada, except for the Pacific Northwest. The largest negative trends in streamflow (∼30–50% for all metrics) occur in the southwestern United States and southern Great Plains, which corroborate previous work on streamflow using only natural gauges (3, 14). It is worth noting that droughts in the southwestern United States (15), California (16), and central United States (17) during the latter part of our period of record have reinforced trends in those regions. Additionally, we find a band of positive streamflow trends (∼10–50%) from central/south-central Canada throughout the Great Lakes region that extends into New England and southeastern Canada. This band has a break in the north-central United States for median streamflow trends, where an area of negative or minimal streamflow change exists (Fig. 1).
Fig. 1.
Trends in streamflow metrics for the 1981–2015 water years for typical streamflow metrics. The sizes of the circles (human modified) and squares (natural) represent the relative area of the upstream drainage area. Due to the differences in drainage areas, the sizes of the squares and circles are not directly comparable.
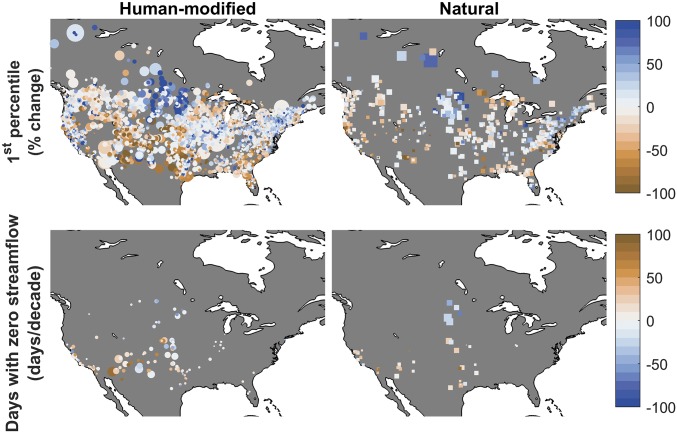
Fig. 3.
Trends in streamflow metrics for the 1981–2015 water years for low streamflow metrics. The sizes of the circles (human modified) and squares (natural) represent the relative area of the upstream drainage area. For the days with zero streamflow days panel, only gauges where trends in zero streamflow days exist are shown. Due to the differences in drainage areas, the sizes of the squares and circles are not directly comparable.
Fig. 2.
Trends in streamflow metrics for the 1981–2015 water years for high streamflow metrics. The sizes of the circles (human modified) and squares (natural) represent the relative area of the upstream drainage area. Due to the differences in drainage areas, the sizes of the squares and circles are not directly comparable.
Larger watersheds are much more likely to have water infrastructure and management, so streamflow trends for large watersheds tend to be smaller (as a percentage) and less variable than those for small watersheds (Figs. 1–3 and SI Appendix, Fig. S2). Water conveyance between subwatersheds in a managed watershed can balance heterogeneous seasonal and geographic variation in precipitation (18), supporting the assumption that larger river networks tend to dampen signals of climate change (19). Across all streamflow metrics and watersheds, a relatively low proportion of trends are statistically significant: 7% of the gauges across the United States and Canada show a significant positive trend and 8% show a significant negative trend over 35 y (these percentages are across all metrics, but are shown individually in SI Appendix, Fig. S3, and summarized for human-modified and natural watersheds in SI Appendix, Tables S1 and S2, respectively).
The trends in low streamflow have slightly higher rates of statistical significance (9.2% of the gauges have a significant positive trend for the 1st percentile trends, while 7.5% have a significant negative trend; SI Appendix, Fig. S3 and Tables S1 and S2) but show more spatial variability within each region compared with other streamflow metrics. This larger spatial variability is likely due to the dominance of baseflow during low-flow conditions. Baseflow originates from groundwater and saturated soil, so it is primarily a function of local soils and geology rather than large-scale climate forcing (20). Previous work indicates higher spatial variability in baseflow trends compared with total streamflow (3). Additionally, water management may obscure climate-driven trends in low streamflow as water is released from reservoirs to meet downstream water demands during dry periods (when baseflow would be low in natural watersheds), conveyance moves water within and between watersheds, and minimum instream flows limit water extraction when streamflow is low (1).
We find positive trends in days without streamflow in the southwestern United States (∼10 more days per decade) and negative trends in the central United States (∼10 fewer days per decade). Even though this analysis is limited to streamflow gauges where days without streamflow exist throughout the observational record, changes in days without streamflow are extremely important both for total water supply reliability and the persistence of aquatic species, especially in the arid southwestern United States (21). While days without streamflow may not represent a complete loss of water from a stream section, the remaining standing water represents an extreme habitat alteration (i.e., increased temperature, decreased dissolved oxygen). The longer the duration of this habitat alteration, the greater the potential for long-lasting negative impacts on freshwater taxa that are adapted to lotic systems (1).
For comparative purposes, we estimated trends for the same streamflow metrics assessed in Lins and Slack (22) (SI Appendix, Tables S3 and S4). The Lins and Slack (22) analysis, however, contains fewer streamflow gauging stations and covers a different time period compared with our analysis. Specifically, there is limited temporal overlap between their study (ending in 1993) and our study (starting in 1981). Similar to Lins and Slack (22), our results show fewer gauges with significant trends as streamflow percentiles increase. However, Lins and Slack (22) show a greater number of significant positive trends than significant negative trends, while our results indicate a more even balance between the two. These differences in streamflow trends correspond to widespread differences in reference evapotranspiration (ETo) and precipitation trends across the different time periods considered (SI Appendix, Fig. S4; see SI Appendix for additional methods and discussion). Our analyses from 1981 to 2015 coincide with a period of widespread increases in ETo, along with regional changes in precipitation, that result from a combination of anthropogenic radiative forcing (4) and decadal-scale internal climate variability (e.g., ref. 23).
To examine the consistency of trends between natural and human-modified rivers and streams, we compare trends from gauges with natural streamflow to nearby gauges with human-modified streamflow. For each natural gauge, we extracted trends from all human-modified gauges within a 115-km radius and report the mean trend of these gauges (see Materials and Methods for detailed information). This analysis assumes that streamflow from these proximate gauges is driven by similar climate variability and trends to that at the paired natural gauges. To avoid comparing streamflow trends from vastly different drainage areas, streamflow gauges in large watersheds (area, >50,000 km2) were removed from this analysis.
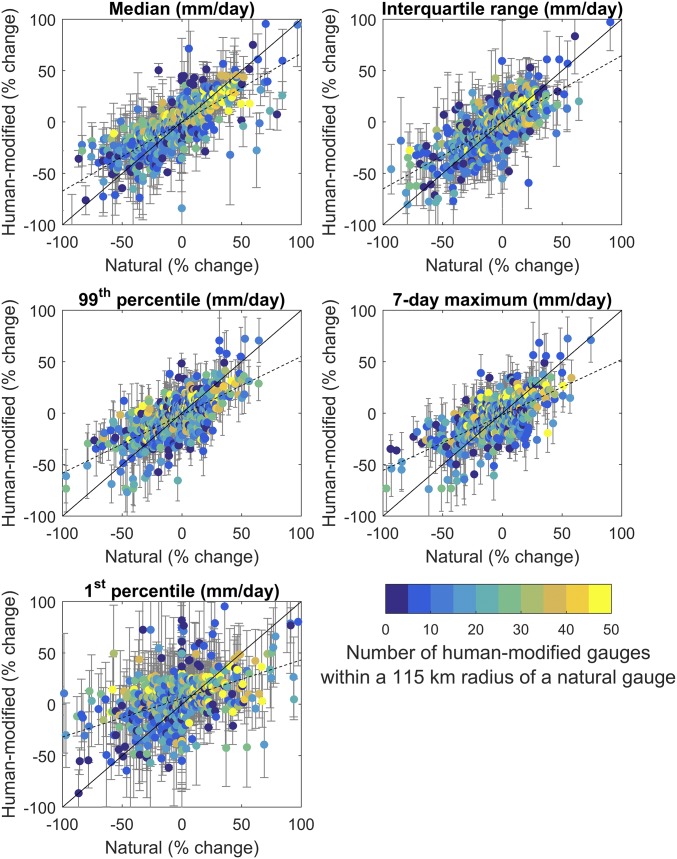
Regardless of water resources management, proximate gauges show similar trends in most streamflow metrics (Fig. 4; due to paucity of data, zero streamflow days were not analyzed in this manner). When comparing nearby locations, we find no statistically significant differences between trends of natural and human-modified streamflow median (P = 0.15), 99th percentile (P = 0.24), and 7-d maximum streamflow trends (P = 0.21). Further supporting this supposition, we find strong and statistically significant correlations between natural and human-modified streamflow trends at nearby locations for all variables (median: r = 0.79, P < 0.001; IQR: r = 0.76, P < 0.001; 99th percentile: r = 0.69, P < 0.001; 7-d maximum: r = 0.66, P < 0.001; 1st percentile: r = 0.50, P < 0.001). There was, however, a statistically significant mean difference between natural and human-modified daily streamflow variability (IQR; P = 0.01) and 1st percentile streamflow trends (P < 0.001) at nearby locations. These results suggest that, in managed systems, water management and reservoir releases to meet downstream water demands reduce some climate-driven streamflow variability and extremely low streamflow. For 1st percentile streamflow trends, for example, the trends were negative (mean trend of −3.5%) in natural watersheds compared with positive trends in human-modified watersheds (mean trend of 2.2%). Augmented low flows in managed systems are used to maintain ecosystem services, habitat for freshwater species, and water supply reliability for cities and agriculture. These results indicate that managed reservoirs may serve as a resource to mitigate the impacts of climate change on low baseflows and zero streamflow days for humans and aquatic ecosystems, particularly in areas where extreme low-flow events are increasing in frequency (24, 25). However, total streamflow for all watersheds is inevitably limited by precipitation and evapotranspiration, so water management and water infrastructure have a limited ability to increase streamflow above that supplied by accumulated precipitation (18).
Fig. 4.
Scatterplots of natural versus nearby human-modified streamflow trends (in percent change) for the 1981–2015 water years. The solid black line is the 1:1 line, and the dashed line is the least-squares regression (plotted for reference). The mean of trends from all human-modified gauges within 115 km of a natural gauge was estimated and compared against trends from natural gauges (Materials and Methods). The color bar indicates the number of human-modified streamflow gauges used to estimate the mean, and the uncertainty bar shows the mean absolute deviation of trends between the human-modified streamflow gauges.
To infer the causes of natural and human-modified streamflow trends, we assess precipitation and ETo trends for the same time period using the gridMET 4-km dataset (26) for the United States and the TerraClimate 4-km dataset (27) for Canada. Climate trends are estimated using the grid point closest to the streamflow gauge as a proxy for the climate variability of the contributing watershed. While this may not capture all climate trends upstream of the gauge, many of the watersheds used in this analysis have a small drainage area (SI Appendix, Fig. S2). We calculate trends in total water-year precipitation and ETo for the period of record and relate these variables to median streamflow trends. Given that streamflow trends are similar across metrics and the temporal mismatch between precipitation and streamflow extremes (28), we focus on median streamflow.
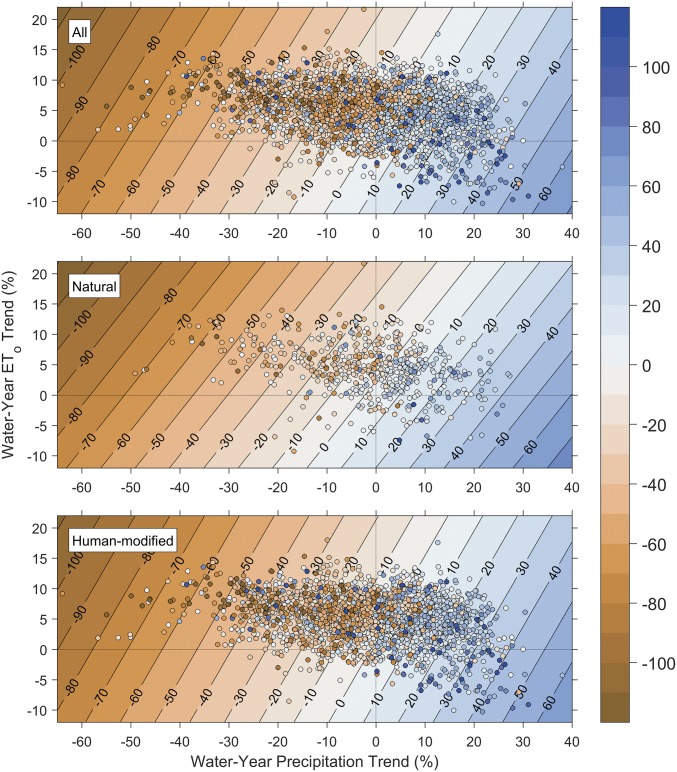
Spatial patterns of trends in precipitation closely match those of median streamflow trends, with decreases in precipitation throughout the southern and western United States (SI Appendix, Fig. S5). From 1981 to 2015, ETo increased throughout most of the United States, with some decreases in the upper Great Plains and Canadian Prairies (SI Appendix, Fig. S5), largely related to changes in minimum and maximum air temperature (SI Appendix, Fig. S6). We examine the combined effect of total water-year precipitation and ETo on streamflow trends using three multiple linear regression models (one with all gauges, one with only natural gauges, and one with only human-modified gauges). Regression models were estimated using median streamflow trend as the dependent variable and total water-year precipitation and ETo trend as the independent variables. While the regression using gauges in natural watersheds explains more variance than those using human-modified streamflows or all gauges, all three regressions produce similar regression coefficients that have substantial overlap in their 95% CIs (Table 1). As a result, median daily streamflow trends show a similar combined sensitivity to precipitation and ETo trends in natural and human-modified systems and when they are pooled (Fig. 5).
Table 1.
Multiple linear regression results for the three models (shown in Fig. 5)
| Model | Sample size | R2 | Residual mean absolute error, % | Precipitation coefficient and 95% CI | ETo coefficient and 95% CI |
| All | 3,119 | 0.271 | 23.3 | 1.41 [1.32, 1.50] | −1.09 [−1.42, −0.76] |
| Natural | 570 | 0.363 | 20.0 | 1.43 [1.24, 1.61] | −1.41 [−2.00, −0.81] |
| Human modified | 2,549 | 0.256 | 24.1 | 1.41 [1.31, 1.51] | −1.01 [−1.39, −0.63] |
For all three models, the median daily streamflow trend (in percentage) is the dependent variable and total water-year precipitation and ETo trend (both in percentage) are the independent variables. All models and all individual regression coefficients have P < 0.001. CIs show considerable overlap between models, suggesting that a differential response to climate forcing is not evident.
Fig. 5.
Response surfaces for all watersheds (Top), natural watersheds (Middle), and human-modified watersheds (Bottom) of the linear regression of trends in median daily streamflow (percentage change) on trends in total water-year reference evapotranspiration (y axes) and total water-year precipitation (x axes) (both in percent change) for the 1981–2015 water years. Color of filled circles shows the trend in median daily streamflow for each station.
Conclusions
In summary, there is a strong correspondence between streamflow trends from gauges with natural streamflow and those with human-modified streamflow, indicating that large-scale trends in climate are clearly evident in human-modified watersheds. These results suggest that hydrologic alterations due to climate change and subsequent impacts on freshwater ecosystems will likely be realized in similar ways in natural and human-modified systems. We do not, however, find as strong a relationship between natural and human-modified systems for streamflow variability (IQR trends) or extreme low flows (1st percentile trends), indicating that water management operations that leave water in streams for water delivery or aquatic habitat purposes provide more uniform flows throughout the year. This confirms the increasingly important role that reservoirs may play in managing baseflow and hydrologic variability (25, 29). Additionally, in the western United States, streamflow used for environmental purposes typically has more junior rights than other entities such as agriculture or urban water use, so watersheds that are becoming drier may have environmental flows eliminated first (18). Streamflow trends are largely driven by large-scale precipitation and evapotranspiration trends (and thereby by temperature trends), with changing precipitation patterns being particularly important [and more uncertain (30)] for water management in the future. Given the importance of streamflow for agriculture, urban water deliveries, and aquatic ecosystems, our results indicate that large-scale climate trends are already affecting water availability, regardless of whether rivers are natural or managed.
Materials and Methods
Streamflow Data.
Daily streamflow for 3,119 gauges with no missing data for North America (Canada and United States) from 1980 to 2015 are from Environment Canada for Canadian streamflow (https://wateroffice.ec.gc.ca/) and the USGS for US streamflow (USGS Water Data for the Nation; https://waterdata.usgs.gov/nwis). These datasets include both natural and human-modified streamflow. The USGS and Environment Canada datasets contain a subset of observed data called the HCDN for the United States and the RHBN (13) for Canada, respectively, which include observed streamflow data that are screened to exclude sites where human activities (e.g., artificial diversions, impoundments, and reservoirs) affect natural streamflow or that have greater than 5% impervious surface in the watershed (12).
The natural streamflow datasets are not entirely free from human modification. For example, while land use change is minimal in these watersheds, other human modification such as agricultural practices (e.g., soil tilling, crop rotation) and management of natural lands (e.g., logging, fire management) that affect watershed hydrology may be present. Additionally, the human-modified watersheds may differ in type or degree of human modification (e.g., seasonal irrigation withdrawals vs. large in-stream dams). The question of the degree of modification is not easily resolved, as different modifications (land use change vs. dam/reservoir management) and their spatial location within the watershed can have differing effects on watershed hydrology and streamflow.
Drainage areas for streamflow gauges range from 4 to 1,847,181 km2, median streamflow discharge ranges from 0.0 to 7,362 m3/s, and median water yield ranges from 0.0 to 12.9 mm/d. For the natural streamflow gauges (570 in total), drainage areas range from 4 to 25,791 km2, median streamflow discharge ranges from 0.0 to 106 m3/s, and median water yield ranges from 0.001 to 6.8 mm/d. All analyses use daily water yield (in millimeters per day) separated into water years (October 1 through September 30).
Streamflow Statistics.
For each water year, we examined six ecologically relevant metrics that encompass typical daily flow (median water yield), variability of daily flow (interquartile range), and extreme daily flow (99th percentile, 1st percentile, 7-d maximum streamflow, and the number of days with zero streamflow).
Climate Data.
We extracted precipitation, ETo, maximum air temperature, and minimum air temperature from the 4-km gridded surface meteorological dataset [gridMET (26)]. Canadian climate data were extracted from the monthly 4-km spatial resolution TerraClimate (27). For both datasets, ETo was estimated using the Penman–Monteith algorithm for a grass surface (31). Climate data were examined at the voxel colocated with each gauge with the assumption that climate trends would be similar for the contributing watershed.
Trend Analyses.
Statistical analyses and trends for all streamflow metrics and climate data were performed for the 1981–2015 water years, resulting in a 35-element time series for trend analyses. Trend magnitudes for water years 1981–2015 were assessed using the Theil–Sen slope estimator. The Theil–Sen slope is a robust estimator for trend analysis, as it uses the median slope of all data pairs. Statistical significance was evaluated using the Mann–Kendall trend test with a threshold P value of 0.05. The streamflow metrics and climate data used in this work do not exhibit strong temporal autocorrelation, with lag-1 autocorrelation coefficients for all metrics being less than 0.25. All trends for streamflow metrics, precipitation, and potential evapotranspiration were converted to percent change by dividing by the 35-y metric mean.
Analysis by Gauge Type.
To compare trends from natural and human-modified streamflow gauges, trends from human-modified streamflow gauges that were within 115 km of each natural streamflow gauge were extracted and the mean trend was estimated. This analysis allows for a direct comparison between natural and nearby human-modified streamflow trends. Differences in mean values between the natural and human-modified streamflow trends were estimated using a two-sample t test with paired observations. The number of human-modified gauges that were used depended on proximity and ranged from 1 to over 30 (Fig. 4). The 115-km radius was determined by using a distance-correlation analysis (SI Appendix, Fig. S7), which was used to determine which streamflow gauges shared similar characteristics. In these analyses, we incrementally expanded the radius around each natural streamflow gauge, including more and more human-modified gauges into the trend comparison analysis. The 115-km radius refers to the radius where the correlation between the natural and human-modified streamflow trends was the highest. The correlation lowered as the radius expanded (SI Appendix, Fig. S7), indicating that neighboring streamflow trends were no longer similar and perhaps of a different climate regime.
Data Availability.
All data are freely available on the Environment Canada (https://wateroffice.ec.gc.ca/), USGS (https://waterdata.usgs.gov/nwis/), and the University of Idaho Climatology Laboratory (www.climatologylab.org/datasets.html) websites.
Supplementary Material
Acknowledgments
We thank Dr. Stephen B. Shaw for his comments on initial drafts. Support for this work was provided, in part, by National Science Foundation Grants DBI-1564896 (to J.H.K.) and DBI-1564806 (to D.L.F.). Contributions by S.E.N. were supported by National Science Foundation Cooperative Agreement EPSCoR IIA-1208732. J.T.A. was partially supported by National Science Foundation Grant SES-1639524. Any opinions, findings, and conclusions or recommendations expressed in this material are those of the authors and do not necessarily reflect the views of the National Science Foundation.
Footnotes
The authors declare no conflict of interest.
This article is a PNAS Direct Submission.
This article contains supporting information online at www.pnas.org/lookup/suppl/doi:10.1073/pnas.1801026115/-/DCSupplemental.
References
- 1.Poff NL, et al. The natural flow regime. Bioscience. 1997;47:769–784. [Google Scholar]
- 2.Abatzoglou JT, Barbero R, Wolf JW, Holden ZA. Tracking interannual streamflow variability with drought indices in the U.S. Pacific Northwest. J Hydrometeorol. 2014;15:1900–1912. [Google Scholar]
- 3.Ficklin DL, Robeson SM, Knouft JH. Impacts of recent climate change on trends in baseflow and stormflow in United States watersheds. Geophys Res Lett. 2016;43:5079–5088. [Google Scholar]
- 4.Intergovernmental Panel on Climate Change . Climate Change 2013: The Physical Science Basis. Contribution of Working Group I to the Fifth Assessment Report of the Intergovernmental Panel on Climate Change. Cambridge Univ Press; Cambridge, UK: 2013. [Google Scholar]
- 5.Klos PZ, Link TE, Abatzoglou JT. Extent of the rain-snow transition zone in the western U.S. under historic and projected climate. Geophys Res Lett. 2014;41:4560–4568. [Google Scholar]
- 6.Dai A. Increasing drought under global warming in observations and models. Nat Clim Change. 2013;3:52–58. [Google Scholar]
- 7.Nilsson C, Reidy CA, Dynesius M, Revenga C. Fragmentation and flow regulation of the world’s large river systems. Science. 2005;308:405–408. doi: 10.1126/science.1107887. [DOI] [PubMed] [Google Scholar]
- 8.Kustu MD, Fan Y, Robock A. Large-scale water cycle perturbation due to irrigation pumping in the US High Plains: A synthesis of observed streamflow changes. J Hydrol (Amst) 2010;390:222–244. [Google Scholar]
- 9.Lettenmaier DP, Wood EF, Wallis JR. Hydro-climatological trends in the continental United States, 1948–1988. J Clim. 1994;7:586–607. [Google Scholar]
- 10.Groisman PY, Knight RW, Karl TR. Heavy precipitation and high streamflow in the contiguous United States: Trends in the twentieth century. Bull Am Meteorol Soc. 2001;82:219–246. [Google Scholar]
- 11.Graf WL. Dam nation: A geographic census of American dams and their large-scale hydrologic impacts. Water Resour Res. 1999;35:1305–1311. [Google Scholar]
- 12.Lins HF. 2012. USGS Hydro-Climatic Data Network 2009 (HCDN–2009) (US Geological Survey, Reston, VA), Fact Sheet 2012-3047.
- 13.Brimley B, et al. Establishment of the Reference Hydrometric Basin Network (RHBN) for Canada. Environment Canada; Ottawa: 1999. [Google Scholar]
- 14.Safeeq M, Grant GE, Lewis SL, Tague CL. Coupling snowpack and groundwater dynamics to interpret historical streamflow trends in the western United States. Hydrol Processes. 2013;27:655–668. [Google Scholar]
- 15.MacDonald GM. Climate change and water in Southwestern North America special feature: Water, climate change, and sustainability in the southwest. Proc Natl Acad Sci USA. 2010;107:21256–21262. doi: 10.1073/pnas.0909651107. [DOI] [PMC free article] [PubMed] [Google Scholar]
- 16.Robeson SM. Revisiting the recent California drought as an extreme value. Geophys Res Lett. 2015;42:6771–6779. [Google Scholar]
- 17.Hoerling M, et al. Causes and predictability of the 2012 Great Plains drought. Bull Am Meteorol Soc. 2014;95:269–282. [Google Scholar]
- 18.Null SE, Prudencio L. Climate change effects on water allocations with season dependent water rights. Sci Total Environ. 2016;571:943–954. doi: 10.1016/j.scitotenv.2016.07.081. [DOI] [PubMed] [Google Scholar]
- 19.Chezik KA, Anderson SC, Moore JW. River networks dampen long-term hydrological signals of climate change. Geophys Res Lett. 2017;44:7256–7264. [Google Scholar]
- 20.Bloomfield JP, Allen DJ, Griffiths KJ. Examining geological controls on baseflow index (BFI) using regression analysis: An illustration from the Thames Basin, UK. J Hydrol (Amst) 2009;373:164–176. [Google Scholar]
- 21.Jaeger KL, Olden JD, Pelland NA. Climate change poised to threaten hydrologic connectivity and endemic fishes in dryland streams. Proc Natl Acad Sci USA. 2014;111:13894–13899. doi: 10.1073/pnas.1320890111. [DOI] [PMC free article] [PubMed] [Google Scholar]
- 22.Lins HF, Slack JR. Streamflow trends in the United States. Geophys Res Lett. 1999;26:227–230. [Google Scholar]
- 23.Dong B, Dai A. The influence of the interdecadal pacific oscillation on temperature and precipitation over the globe. Clim Dyn. 2015;45:2667–2681. [Google Scholar]
- 24.Suen J-P, Eheart JW. Reservoir management to balance ecosystem and human needs: Incorporating the paradigm of the ecological flow regime. Water Resour Res. 2006;42:W03417. [Google Scholar]
- 25.Chen W, Olden JD. Designing flows to resolve human and environmental water needs in a dam-regulated river. Nat Commun. 2017;8:2158. doi: 10.1038/s41467-017-02226-4. [DOI] [PMC free article] [PubMed] [Google Scholar]
- 26.Abatzoglou JT. Development of gridded surface meteorological data for ecological applications and modelling. Int J Climatol. 2013;33:121–131. [Google Scholar]
- 27.Abatzoglou JT, Dobrowski SZ, Parks SA, Hegewisch KC. TerraClimate, a high-resolution global dataset of monthly climate and climatic water balance from 1958–2015. Sci Data. 2018;5:170191. doi: 10.1038/sdata.2017.191. [DOI] [PMC free article] [PubMed] [Google Scholar]
- 28.Ivancic TJ, Shaw SB. Examining why trends in very heavy precipitation should not be mistaken for trends in very high river discharge. Clim Change. 2015;133:681–693. [Google Scholar]
- 29.Poff NL, Olden JD. Can dams be designed for sustainability? Science. 2017;358:1252–1253. doi: 10.1126/science.aaq1422. [DOI] [PubMed] [Google Scholar]
- 30.Poff NL, et al. Sustainable water management under future uncertainty with eco-engineering decision scaling. Nat Clim Change. 2015;6:25–34. [Google Scholar]
- 31.Allen RG, Pereira LS, Raes D, Smith M. 1998. Crop evapotranspiration—guidelines for computing crop water requirements (FAO, Rome), FAO Irrigation and Drainage Paper 56.
Associated Data
This section collects any data citations, data availability statements, or supplementary materials included in this article.
Supplementary Materials
Data Availability Statement
All data are freely available on the Environment Canada (https://wateroffice.ec.gc.ca/), USGS (https://waterdata.usgs.gov/nwis/), and the University of Idaho Climatology Laboratory (www.climatologylab.org/datasets.html) websites.


