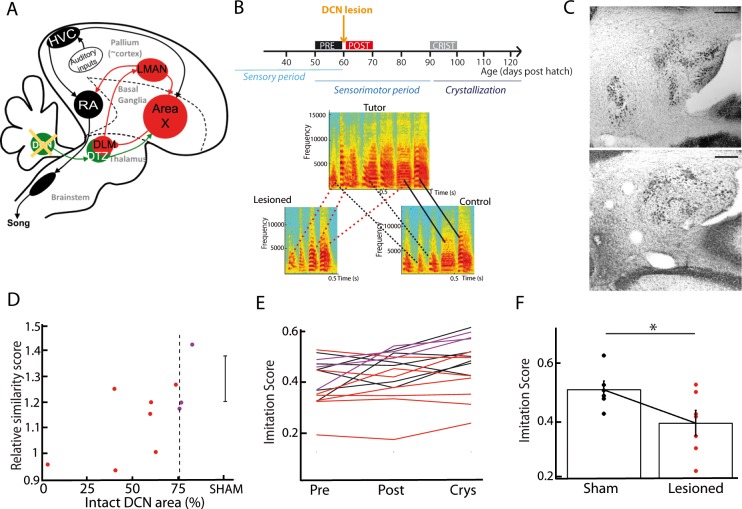
Figure 7. DCN lesions impair song learning and reduce the similarity to tutor song after crystallization.
(A) Diagram of the song system, as in Figure 2A, representing DCN lesion. (B) Top: Diagram of the song learning periods in songbirds: the sensory period, the sensorimotor period in which juveniles start to produce sounds, and the crystallization phase. Lesions were made at 60 dph. Bottom: Examples of three spectrograms of tutor and pupil song motifs at crystallization: top: tutor, bottom left: a pupil with DCN lesion, bottom right: control pupil. Solid lines connect two similar syllables found in the tutor and juvenile song motifs, dotted lines between two syllables reflect a partial copy of the tutor syllable (red lines for the juvenile with DCN lesion, black lines for the control juvenile). (C) Nissl staining on horizontal slices showing the deep cerebellar nuclei. Top: control bird. Bottom: bird with DCN lesion (Scale bar: 100 µm). (D) Normalized imitations score (imitation score at crystallization divided by the imitation score before surgery) plotted as a function of the total area left from the lateral DCN (%) for juveniles with DCN lesion (red and purple dots, n = 10 birds). The mean and SD of the normalized imitation score over the sham group are represented as an error bar (n = 6 sham birds). For the following analysis, we consider the birds with a significant lesion (<75% of intact lateral DCN, vertical dotted line) represented with red dots. A significant correlation was revealed between the similarity and the proportion of lateral DCN left intact (r = 0.68, p<0.05). (E) Population data showing the evolution of the imitation score between the day before the lesion (pre) and the crystallization period (90 dph) in juveniles with sham lesions (black lines for individual birds) and DCN lesions with larger lesion size (red lines) or small lesion size (purple lines). (F) The imitation score at crystallization is significantly larger in the sham group than in the DCN large lesion group (n = 7 birds with large lesion, n = 6 sham birds, Wilcoxon test, p<0.05).
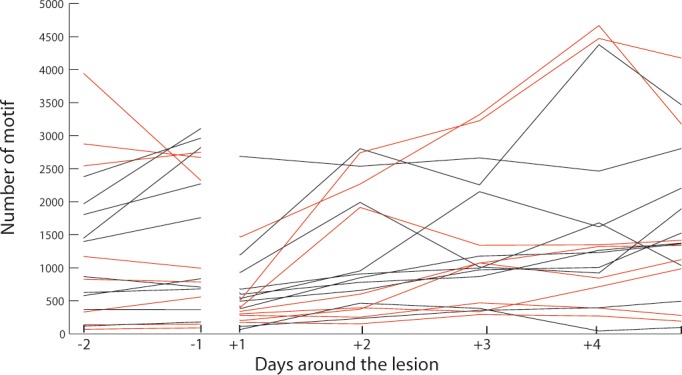
Figure 7—figure supplement 1. Song rate is not affected by DCN lesion.

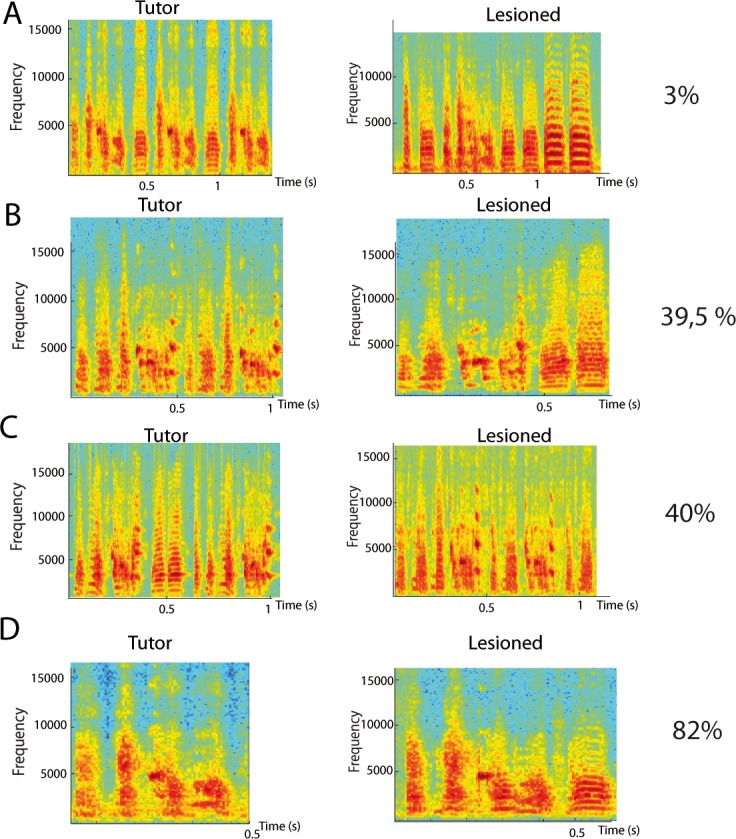
Figure 7—figure supplement 2. Example spectrogram of tutor and pupil (control and lesion) song motifs as a function of lesion size.

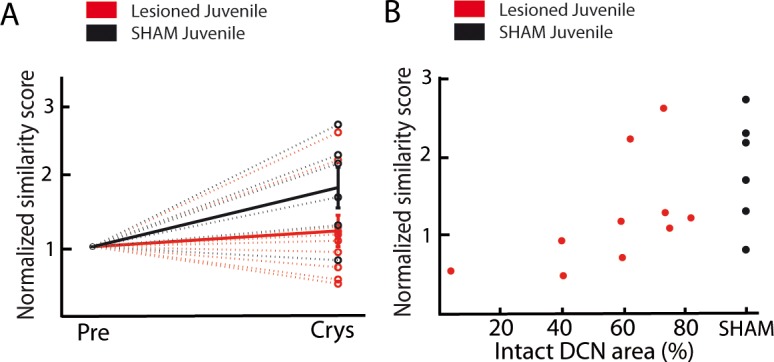
Figure 7—figure supplement 3. Effect of DCN lesions revealed by a custom-written similarity score based on the peak cross-correlation between the spectrograms of the tutor’s motifs and of the pupil’s songs.


