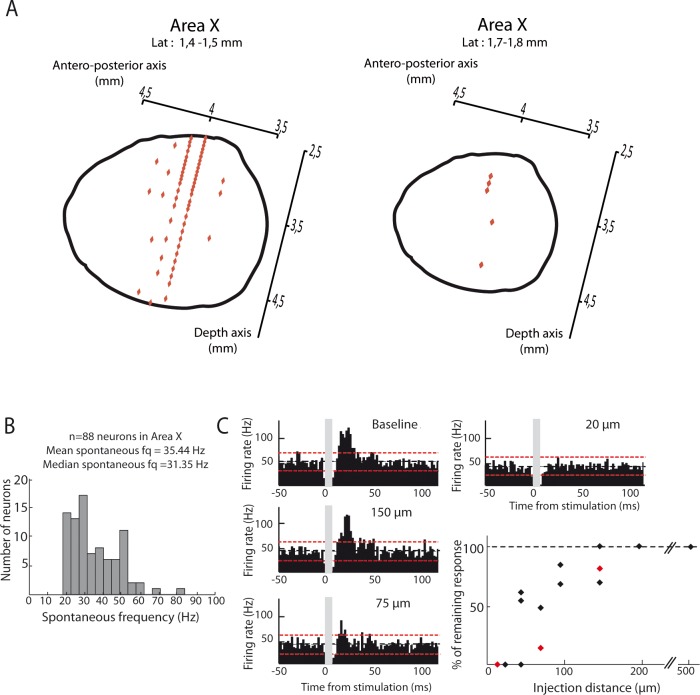
Figure 9. Location of Area X neural recordings and effect of the dispersion of pharmacological agents.
(A) Diagrams showing recordings locations in Area X, for two different lateral plans (1.4–1.5 mm (left panel) or 1.7–1.8 mm (right panel). Each recording point (red diamond) was placed in Area X using antero-posterior and depth coordinates (n = 83 recording sites for a laterality of 1.4–1.5 mm, left panel; n = 5 recording sites for a laterality of 1.7–1.8 mm, right panel). (B) Distribution of spontaneous firing rate for neurons recorded in Area X (n = 88 neurons, mean frequency = 35.4 Hz, median frequency = 31.4 Hz). (C) Effect of pharmacological blockers (CNQX/APV) on Area X neurons as a function of the distance from the injection site. An example pallidal neuron recorded while injecting the blockers at various distances (baseline: no drug injected): 150, 75 and 20 µm, and the PSTHs displayed show its response to the DCN stimulation after drug injection at the various sites (time bin: 5 ms). The black horizontal dashed line depicts the mean baseline firing rate and red dotted lines indicate confidence intervals (2.5 SD away from the mean baseline firing rate). The population data (bottom right) represent the change in response to DCN stimulation induced by drug injection as compared to baseline for each recorded neuron. Red diamonds correspond to the example shown here.

