Abstract
Solid pulmonary nodules are a common finding requiring serial computed tomography (CT) imaging. We sought to explore the detection and measurement accuracy of an ultralow-dose CT (ULDCT) protocol compared with our standard low-dose CT (LDCT) nodule follow-up protocol.
In this pragmatic single-center pilot prospective cohort study, patients scheduled for clinically indicated CT surveillance of 1 or more known solid pulmonary nodules >2 mm underwent ULDCT immediately after routine LDCT. The Bland-Altman 95% limits of agreement for diameter and volumetry were calculated.
In all, 57 patients underwent 60 imaging episodes, with 170 evaluable nodules. ULDCT detected all known solid pulmonary nodules >2 mm. Bland-Altman analyses demonstrated clinically agreement for both nodule diameter and volume, both of which fell within prespecified limits.
This single-center pilot study suggests that ULDCT may be of use in surveillance of known solid pulmonary nodules >2 mm.
Keywords: chest CT, iterative reconstruction, lung nodule, radiation dose reduction, volumetry
1. Introduction
Solid pulmonary nodules are a common incidental finding on imaging, with a reported prevalence of 8.5% to 18%.[1–3] Indeterminate nodules are most frequently managed by serial computed tomography (CT) chest to monitor for change in diameter or volume.[4–6] Volumetry provides better intrareader and inter-reader agreement when compared with 2-dimensional reporting of nodule diameter,[7] and allows measurement of the clinically relevant parameter of volume doubling time.[8]
Low-dose CT (LDCT) chest protocols with radiation doses of around 1.5 mSv have shown no significant deterioration in imaging quality in the context of assessing nodules,[9] as there is inherently high contrast between pulmonary nodules and lung parenchyma.
Concerns regarding cumulative radiation dose in serial LDCT scans have led to the development of ultralow-dose CT (ULDCT) protocols. Phantom studies examining ULDCT protocols have shown promising capacity to detect and volumetrically characterize solid and subsolid nodules.[10,11] We examined the use of an ULDCT imaging protocol (index test) to determine the accuracy of such dose-minimizing approaches in a clinical cohort.
2. Materials and methods
2.1. Study population and design
A pilot prospective cohort study was undertaken at our Australian tertiary metropolitan referral hospital, recruiting consecutive patients with known solid pulmonary nodules greater than 2 mm, who were undergoing surveillance LDCT chest scans (reference standard) as part of standard management.
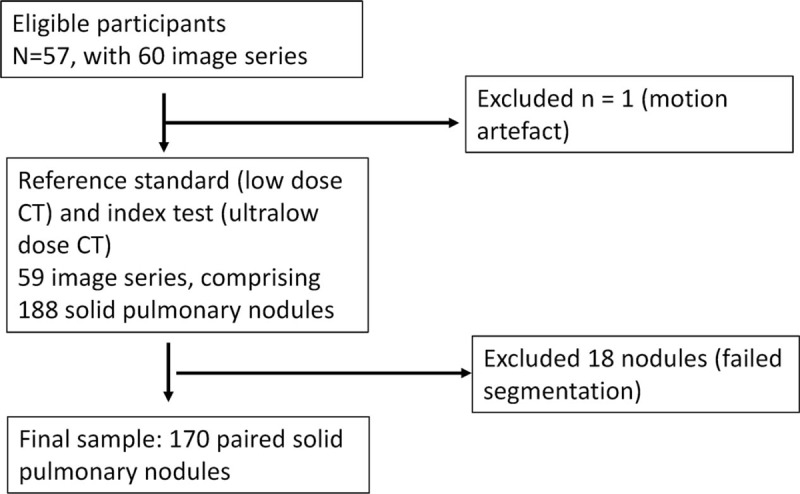
Patients were included if they were over the age of 40 and had known pulmonary nodules requiring further imaging as part of standard follow-up (Fig. 1). Exclusion criteria were the inability to provide informed consent and contraindication to CT (eg, pregnancy). Data collection occurred between February, 2015 and October, 2015. As this study did not meet the ICMJE/WHO definition of a clinical trial, trial registration was not performed.
Figure 1.

Participant flow diagram.
2.2. CT examination and data reconstruction
All scans were performed in the supine position using a 128-row multidetector scanner with dose modulation (SOMATOM Definition Flash and CareDose4D; Siemens Medical Solutions, Forchheim, Germany). The routine nodule follow-up LDCT was performed at 100 kVp (kilovolt peak), quality reference mAs (milliampere-seconds) 100. ULDCT was performed immediately after, typically with an interval of less than 1 minute, at either 80 or 100 kVp, quality reference mAs 20.
Both the LDCT and ULDCT were reconstructed using sinogram-affirmed iterative reconstruction (SAFIRE 3; Siemens Medical Solutions, Forchheim, Germany). All images were transferred to a picture-archiving and communication system (SYNAPSE; FujiFilm Medical Systems, Chicago, IL).
2.3. Image analysis
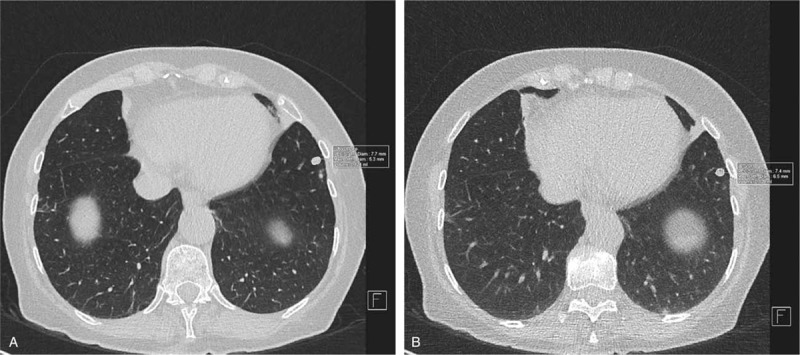
All CT scans (LDCT and ULDCT) were read by an experienced consultant thoracic radiologist (DP). Image analysis was performed by an independent author (MP) and verified by DP. Pulmonary nodules were identified on routine LDCT using 0.75 mm axial thin-slice reconstructions. All pulmonary nodules greater than 2 mm diameter (maximum of 10 per patient) were analyzed with semiautomated nodule segmentation software which was initiated by dragging an axial cursor (syngo.via, VA30; Siemens Medical Solutions, Forchheim, Germany). The segmented outline was qualitatively compared with the actual outline of the nodule and if segmentation was deemed adequate (eg, good contour, no vessel or pleura included, cavitation excluded), automated volume and axial diameter were recorded (Fig. 2). If segmentation was inadequate, up to 5 reinitiation attempts were allowed. To reduce bias, the segmented outline was not further manually adjusted. Software calculated maximum axial diameters were in accordance with response evaluation criteria in solid tumors (RECIST) 1.1 guidelines.[12]
Figure 2.

Automated volumetry and diameter measurement. Solid pulmonary nodules were measured in accordance with RECIST 1.1.[12] The left panel (A) depicts measurements obtained with a standard low-dose computed tomography (CT), and right panel (B) depicts measurements with ultralow-dose CT. The resultant RECIST 1.1 diameters and volumes (converted to mm3) were used for comparisons between techniques.
2.4. Radiation dose estimates
Radiation doses of the LDCT and ULDCT scans were assessed using the automatically recorded CT dose index (CTDIvol) and dose length product for each scan. Calculation of effective radiation dose in mSv (millisievert) was estimated by multiplying the Deak Conversion Factor chest specific conversion coefficient of 0.0144 mSv/mGy-cm (millisievert/milliGray-centimetre) by the dose length product.[13]
2.5. Statistical analyses
All statistical analyses and subgroup analyses were prespecified. As nonparametric data were expected, the Wilcoxon signed-rank test was used for paired data, and Spearman correlation coefficient to examine the strength of association between ULDCT and LDCT data. P values of less than .05 were considered to reflect statistical significance.
The primary hypothesis was that ULDCT and LDCT nodule diameters and volumes would fall within a predefined clinically acceptable range. The method of Bland-Altman[14] was to assess of 95% limits of agreement between LDCT and ULDCT, with a priori acceptable clinically important limits of agreement for both diameter measurement and volumetry set at ±25%, the upper limit of interscan measurement variability, and the threshold for clinically significant change.[15–17]
Data and preliminary analyses were performed with Microsoft Excel 2010 (Redmond, WA) and further analyses with GraphPad Prism 7.02 (La Jolla, CA). Results are presented as median (interquartile range [IQR] first quartile to third quartile), or where normally distributed (by inspection of histogram and Shapiro-Wilk test) as mean ± SD.
2.6. Funding and ethics
This research did not receive any specific grant from funding agencies in the public, commercial, or not-for-profit sectors. Ethics approval was obtained from the Melbourne Health Human Research Ethics Committee and all patients provided informed written consent.
3. Results
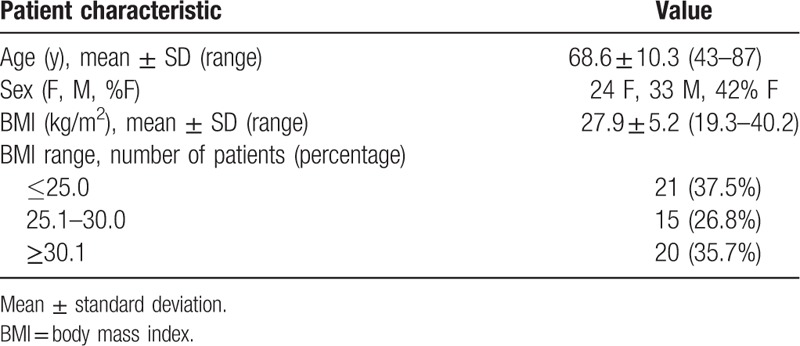
In all, 57 patients were recruited (Table 1), with a mean age of 68.6 ± 10.3 years, 24 of which were female and 33 of which were male. Almost all patients (54/57) underwent a single scan in the study period; however, the remaining 3 patients underwent 2 nodule surveillance scans, resulting in a total of 60 image series (Fig. 1).
Table 1.
Demographic and anthropometric data of study participants (n = 57).

The median calculated effective radiation dose was significantly lower for the ULDCT protocol as compared to the LDCT protocol (0.49 mSv [IQR 0.40–0.63 mSv] vs 2.35 mSv [IQR 1.90–3.04]; P < .0001). There was a moderately strong correlation between body mass index (BMI) and the effective doses for both LDCT (r = 0.58) and ULDCT (r = 0.45).
One patient was excluded from further analysis as they were acutely short of breath at the time of imaging, and significant motion artefact on both LDCT and ULDCT scans made them unsuitable for volumetric analysis.
In the remaining 59 image series, a total of 188 solid pulmonary nodules were identified on LDCT chest. All nodules identified by LDCT chest were seen on the ULDCT scan. Eighteen nodules (10%) failed segmentation (14 pleurally based, 4 abutted vessels/airways), with adequate segmentation achieved in the study cohort of 170 identified nodules. No new nodules were identified on ULDCT.
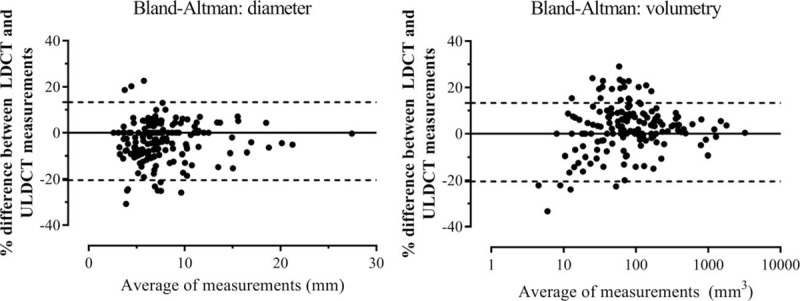
Nodules detected by LDCT demonstrated median RECIST 1.1 diameter of 6.8 mm (IQR 5.2–9.0 mm). ULDCT measurements differed minimally in absolute terms, with median diameter 7.1 mm (IQR 5.7–9.1 mm), though this difference was statistically significant (P < .001). The Bland-Altman bias was −3.6% ± 8.6%, with 95% limits of agreement −20.5% to 13.3% (Table 2), falling within the prespecified clinically nonsignificant range. Inspection of the Bland-Altman plot (Fig. 3) revealed no proportional or systematic errors; however, as nodule diameter decreased, more outliers were seen. Correlation between diameters was strong, with Spearman correlation coefficient of 0.968.
Table 2.
Differences in diameter and volume for solid pulmonary nodules between low-dose CT and ultralow-dose CT.

Figure 3.

Bland-Altman agreement plots for solid pulmonary nodules (n = 170) detected on low-dose CT (LDCT) as compared with ultralow-dose CT (ULDCT) for maximal axial diameter and volumetry. The left hand panel depicts the Bland-Altman[14] plot of LDCT and ULDCT measured diameters for solid pulmonary nodules. The right hand panel depicts the Bland-Altman plot of volumetry for the 2 techniques for the same nodules, with a logarithmic horizontal scale for volume. Bland-Altman plots display the difference between values measured by LDCT and ULDCT against the mean of these 2 values. The upper and lower dashed lines represent the 95% confidence intervals.
Median nodule LDCT volume was 70 mm3 (IQR 34.3–163 mm3), with median ULDCT volume clinically identical at 70 mm3 (IQR 31.25–158 mm3), but statistically lower (P < .001). The Bland-Altman bias was 2.3 ± 10.4% with 95% limits of agreement −18.0% to 22.7% (Table 2), falling within the prespecified clinically nonsignificant range. The Bland-Altman plot (Fig. 3) revealed a similar pattern to nodule diameter insofar that as nodule volume decreased, more outliers were observed. Again, LDCT and ULDCT were strongly correlated, with a Spearman correlation coefficient of 0.993.
The subset of indeterminate nodules (volumes of between 50 and 500 mm3 measured on LDCT scans[15]) was analyzed separately. In all, 97 nodules were included in this subset. The Bland-Altman bias was 4.6% ± 8.8%, with 95% limits of agreement −12.7% to 21.9% (Table 2), falling within the clinically nonsignificant interval.
Bland-Altman 95% relative limits of agreement for ULDCT volumetry were again clinically acceptable in patients with BMI <25 and BMI ≥25 (−17.5% to 23.6% and −18.3% to 20.8%, respectively).
4. Discussion
Our study demonstrates ULDCT chest performed well in detection and measurement of solid pulmonary nodules. All solid nodules greater than 2 mm seen on standard LDCT were detected on ULDCT. Mean differences in both 2-dimensional measurement and 3-dimensional volume measures were minimal, and consistent with prior studies reporting interscan variability.[16–18] Importantly, limits of agreement remained within the prespecified, clinically nonsignificant range, and this remained true even for indeterminate nodules, and also those patients with BMI ≥25. Thus, our findings indicate ULDCT imaging may be appropriate and reliable for serial imaging of known solid pulmonary nodules greater than 2 mm.
Two-dimensional measurement of nodule size remains the most common way of reporting nodule size and assessing change in nodule size in serial scans. The Fleischner Society guidelines allow either diameter or volumetric measurement.[4,6] Volumetry is increasingly used to measure the size of nodules, and also change in nodule size with time as it provides better intrareader and inter-reader reproducibility when compared with using maximal axial diameter.[7] However, while volumetry is effective at reducing variability in measurements within a scan, many studies have shown that there is significant interscan variability within volumetric measurements of a given nodule.[19,20]
A number of studies have found relative limits of agreement for interscan variability in the volume of a pulmonary nodule of between ±20% to ±25%.[16–18] For this reason, van Klaveren et al[15] defined growth on serial CT scans as an increase in measured volume of over 25%. Limits of agreement observed in our study are within this measure, and consistent with, or tighter than[21–23] prior limited reports regarding observed differences between LDCT and ULDCT imaging. As nodule size decreased, we observed more outliers, which is most likely due to measurement variability which differentially affects smaller nodules. Many of these nodules would not require follow-up in the new Fleischner guidelines.[6] Overall, our data suggest ULDCT may be appropriate for surveillance of known solid pulmonary nodules.
Kim et al[24] studied 25 patients with 14 lesions and reported no significant difference between LDCT and ULDCT protocols in diameter measurement for pulmonary nodules, using an ULDCT protocol of comparable effective radiation dose to the ULDCT protocol used in our study. Our study demonstrates a statistically significant difference between LDCT and ULDCT protocols, likely as a result of greater numbers of patients enrolled, and hence greater statistical power.
Limitations of our study include that only a single reader was used for analysis of the data, and that this was done in an unblinded fashion without a significant temporal interval. However, we employed semiautomated volumetric software, a real-world tool which is designed to minimize interobserver variability. Our cohort contained no subsolid or semisolid lesions, thus findings remain limited to solid lesions. Not all lesions could be adequately characterized by volumetric analysis due to inadequate segmentation by software. The proportion of nodules with inadequate segmentation observed in our study is similar than previously reported in literature looking at semiautomated volumetry software.[21]
We examined only patients with known solid pulmonary nodules greater than 2 mm. Some work has been done to assess the viability of ULDCT protocols for diagnostic assessment of interstitial lung disease and emphysema[25,26]; however, further studies are required before ULDCT could be considered for use in first-presentation diagnostic imaging, or lung cancer screening, rather than solid nodule follow-up. Similarly, this study does not address findings other than the pulmonary nodules in this patient group.
Further studies should examine the utility of ULDCT for initial detection of solid pulmonary nodules, detection and follow-up of subsolid nodules, and the diagnostic reliability of the technique for other thoracic abnormalities.
5. Conclusions
All solid pulmonary nodules detected on routine LDCT greater than 2 mm were detected on ULDCT. Ground glass and part-solid nodules were excluded from our analysis. Volume and diameter differences between LDCT and ULDCT images were minimal and consistent with those reported for interscan analysis of LDCT protocols. Nodule size and patient BMI did not significantly affect accuracy of volumetric measurements. Effective radiation dose was significantly lower than for LDCT chest imaging. Our findings suggest that ULDCT may be appropriate for serial imaging of known solid pulmonary nodules >2 mm, but further work is required before widespread clinical adoption.
Acknowledgments
We thank the patients and staff of our institutions. The authors declare no conflicts of interest. This study received no funding.
Author contributions
Conceptualization: Michael Paks, Paul Einsiedel, Louis B Irving, Daniel P Steinfort, Diane M Pascoe.
Data curation: Michael Paks, Paul Leong, Daniel P Steinfort, Diane M Pascoe.
Formal analysis: Michael Paks, Paul Leong, Daniel P Steinfort.
Investigation: Michael Paks, Paul Einsiedel, Daniel P Steinfort, Diane M Pascoe.
Methodology: Michael Paks, Paul Leong, Paul Einsiedel, Daniel P Steinfort.
Project administration: Louis B Irving, Daniel P Steinfort, Diane M Pascoe.
Resources: Michael Paks, Paul Einsiedel, Louis B Irving.
Software: Paul Einsiedel.
Supervision: Louis B Irving, Daniel P Steinfort, Diane M Pascoe.
Validation: Paul Leong, Paul Einsiedel, Diane M Pascoe.
Visualization: Michael Paks, Paul Leong, Paul Einsiedel, Diane M Pascoe.
Writing – original draft: Michael Paks, Paul Leong, Daniel P Steinfort, Diane M Pascoe.
Writing – review & editing: Michael Paks, Paul Leong, Daniel P Steinfort, Diane M Pascoe.
Footnotes
Abbreviations: BMI = body mass index, CT = computed tomography, kVp = kilovolt peak, LDCT = low-dose computed tomography, mAs = milliampere-seconds, mSv/mGy-cm = millisieverts/milligray-centimetre, RECIST = response evaluation criteria in solid tumors, ULDCT = ultralow-dose computed tomography.
PL is a co-primary author.
The authors have nothing to disclose.
References
- [1].Schmidt LH, Vietmeier B, Kaleschke G, et al. Thoracic malignancies and pulmonary nodules in patients under evaluation for transcatheter aortic valve implantation (TAVI): incidence, follow up and possible impact on treatment decision. PLoS One 2016;11:e0155398. [DOI] [PMC free article] [PubMed] [Google Scholar]
- [2].Hammerschlag G, Cao J, Gumm K, et al. Prevalence of incidental pulmonary nodules on computed tomography of the thorax in trauma patients. Intern Med J 2015;45:630–3. [DOI] [PubMed] [Google Scholar]
- [3].Blagev DP, Lloyd JF, Conner K, et al. Follow-up of incidental pulmonary nodules and the radiology report. J Am Coll Radiol 2014;11:378–83. [DOI] [PubMed] [Google Scholar]
- [4].MacMahon H, Austin JHM, Gamsu G, et al. Guidelines for management of small pulmonary nodules detected on ct scans: a statement from the Fleischner Society. Radiology 2005;237:395–400. [DOI] [PubMed] [Google Scholar]
- [5].Naidich DP, Bankier AA, MacMahon H, et al. Recommendations for the management of subsolid pulmonary nodules detected at CT: a statement from the Fleischner Society. Radiology 2013;266:304–17. [DOI] [PubMed] [Google Scholar]
- [6].MacMahon H, Naidich DP, Goo JM, et al. Guidelines for management of incidental pulmonary nodules detected on CT images: from the Fleischner Society 2017. Radiology 2017;284:228–43. [DOI] [PubMed] [Google Scholar]
- [7].Brandman S, Ko JP. Pulmonary nodule detection, characterization, and management with multidetector computed tomography. J Thorac Imaging 2011;26:90–105. [DOI] [PubMed] [Google Scholar]
- [8].Yankelevitz DF, Reeves AP, Kostis WJ, et al. Small pulmonary nodules: volumetrically determined growth rates based on ct evaluation. Radiology 2000;217:251–6. [DOI] [PubMed] [Google Scholar]
- [9].Marshall HM, Bowman RV, Yang IA, et al. Screening for lung cancer with low-dose computed tomography: a review of current status. J Thorac Dis 2013;5(suppl 5):S524–539. [DOI] [PMC free article] [PubMed] [Google Scholar]
- [10].Doo KW, Kang E-Y, Yong HS, et al. Accuracy of lung nodule volumetry in low-dose CT with iterative reconstruction: an anthropomorphic thoracic phantom study. Br J Radiol 2014;87:20130644. [DOI] [PMC free article] [PubMed] [Google Scholar]
- [11].Rampinelli C, Origgi D, Vecchi V, et al. Ultra-low-dose CT with model-based iterative reconstruction (MBIR): detection of ground-glass nodules in an anthropomorphic phantom study. Radiol Med 2015;120:611–7. [DOI] [PubMed] [Google Scholar]
- [12].Eisenhauer EA, Therasse P, Bogaerts J, et al. New response evaluation criteria in solid tumours: revised RECIST guideline (version 1.1). Eur J Cancer 2009;45:228–47. [DOI] [PubMed] [Google Scholar]
- [13].Recommendations of the International Commission on Radiological Protection: Adopted September 9, 1958. Ann ICRPICRP Publ 1959;1:iii–10. [Google Scholar]
- [14].Bland M, Altman D. Statistical methods for assessing agreement between two methods of clinical measurement. Lancet 1986;327:307–10. [PubMed] [Google Scholar]
- [15].van Klaveren RJ, Oudkerk M, Prokop M, et al. Management of lung nodules detected by volume CT scanning. N Engl J Med 2009;361:2221–9. [DOI] [PubMed] [Google Scholar]
- [16].Gietema HA, Schaefer-Prokop CM, Mali WPTM, et al. Pulmonary nodules: interscan variability of semiautomated volume measurements with multisection CT: influence of inspiration level, nodule size, and segmentation performance. Radiology 2007;245:888–94. [DOI] [PubMed] [Google Scholar]
- [17].Goodman LR, Gulsun M, Washington L, et al. Inherent variability of CT lung nodule measurements in vivo using semiautomated volumetric measurements. Am J Roentgenol 2006;186:989–94. [DOI] [PubMed] [Google Scholar]
- [18].Wormanns D, Kohl G, Klotz E, et al. Volumetric measurements of pulmonary nodules at multi-row detector CT: in vivo reproducibility. Eur Radiol 2004;14:86–92. [DOI] [PubMed] [Google Scholar]
- [19].Boll DT, Gilkeson RC, Fleiter TR, et al. Volumetric assessment of pulmonary nodules with ECG-gated MDCT. Am J Roentgenol 2004;183:1217–23. [DOI] [PubMed] [Google Scholar]
- [20].Petkovska I, Brown MS, Goldin JG, et al. The effect of lung volume on nodule size on CT. Acad Radiol 2007;14:476–85. [DOI] [PMC free article] [PubMed] [Google Scholar]
- [21].Hein PA, Romano VC, Rogalla P, et al. Variability of semiautomated lung nodule volumetry on ultralow-dose CT: comparison with nodule volumetry on standard-dose CT. J Digit Imaging 2008;23:8–17. [DOI] [PMC free article] [PubMed] [Google Scholar]
- [22].Liang M, Yip R, Tang W, et al. Variation in screening CT-detected nodule volumetry as a function of size. Am J Roentgenol 2017;209:304–8. [DOI] [PubMed] [Google Scholar]
- [23].Vardhanabhuti V, Pang C-L, Tenant S, et al. Prospective intra-individual comparison of standard dose versus reduced-dose thoracic CT using hybrid and pure iterative reconstruction in a follow-up cohort of pulmonary nodules: effect of detectability of pulmonary nodules with lowering dose based on nodule size, type and body mass index. Eur J Radiol 2017;91:130–41. [DOI] [PubMed] [Google Scholar]
- [24].Kim Y, Kim YK, Lee BE, et al. Ultra-low-dose CT of the thorax using iterative reconstruction: evaluation of image quality and radiation dose reduction. Am J Roentgenol 2015;204:1197–202. [DOI] [PubMed] [Google Scholar]
- [25].Lee SW, Kim Y, Shim SS, et al. Image quality assessment of ultra low-dose chest CT using sinogram-affirmed iterative reconstruction. Eur Radiol 2014;24:817–26. [DOI] [PubMed] [Google Scholar]
- [26].Hammond E, Sloan C, Newell JD, et al. Comparison of low- and ultralow-dose computed tomography protocols for quantitative lung and airway assessment. Med Phys 2017;44:4747–57. [DOI] [PMC free article] [PubMed] [Google Scholar]


