Abstract
Background:
Raman spectroscopy could be applied to distinguish tumor from normal tissues. This meta-analysis assessed the accuracy of Raman spectroscopy in differentiating skin cancer from normal tissue.
Methods:
PubMed, Embase, Cochrane Library, and CNKI were searched to identify suitable studies before Februray 4th, 2018. We estimated the pooled sensitivity, specificity, positive, and negative likelihood ratios, diagnostic odds ratio, and constructed summary receiver-operating characteristics curves to identify the accuracy of Raman spectroscopy in differentiating skin cancer from normal tissue.
Results:
A total of 12 studies with 2461 spectra were included. For basal cell skin cancer (BCC) ex vivo detection, the pooled sensitivity and specificity were 0.99 (95% confidence interval [CI] 0.97–0.99) and 0.96 (95% CI 0.95–0.97), respectively. The area under the curve (AUC) was 0.9837. For BCC in vivo detection, the pooled sensitivity and specificity were 0.69 (95% CI 0.61–0.76) and 0.85 (95% CI 0.82–0.87), respectively. The AUC was 0.9213. For melanoma (MM) ex vivo detection, the pooled sensitivity and specificity were 1.00 (95% CI 0.91–1.00) and 0.98 (95% CI 0.95–1.00), respectively. The AUC was 0.9914. For MM in vivo detection, the sensitivity (0.93) and the specificity (0.96) balanced relatively well. For squamous cell skin cancer (SCC) ex vivo detection, the pooled sensitivity and specificity were 0.96 (95% CI 0.81–1.00) and 1.00 (95% CI 0.92–1.00), respectively. For SCC in vivo detection, the sensitivity was 0.81 (95% CI 0.70–0.90) and the specificity was 0.89 (95% CI 0.86–0.91).
Conclusion:
This meta-analysis suggested that Raman spectroscopy could be an effective and accurate tool for differentiating BCC, MM, SCC from normal tissue, which would assist us in the diagnosis and treatment of skin cancer.
Keywords: basal cell cancer, melanoma, Raman spectroscopy, skin cancer, squamous cell cancer
1. Introduction
Skin cancer is the most common form of cancer, globally accounting for at least 40% of cases.[1,2] There are 3 main types of skin cancers: basal cell skin cancer (BCC), squamous cell skin cancer (SCC), and melanoma (MM). The first 2, along with a number of less common skin cancers, are known as non-melanoma skin cancer (NMSC).[3] The World Health Organization (WHO) estimated 2 to 3 million NMSC and 132,000 melanoma skin cancers occur globally each year.[4]
Early diagnosis and treatment are recommended for the management of skin cancer. The current “criterion standard” for diagnosis is based on clinical examination followed by biopsy and histopathology, which is invasive, costly, and time-consuming.[5] For the treatment of skin cancer, surgical removal is the optimal choice. However, the challenge for complete removal is to differentiate between normal skin and the cancer. Histopathology can hardly provide surgeons a precise margin of the tumor even with an increased number of biopsies. Meanwhile, more biopsies means increased financial burden and associated discomfort from the additional biopsy procedures. Dermoscope is a noninvasive in situ diagnostic tool, which is based on visual inspection and recognition of morphologic characteristics.[6] The use of it can improve the accuracy of MM diagnosis but requires well-trained skills and rich experience.[7] Thus, we need an accurate and objective technique with high efficiency to assist us in diagnosis and treatment of skin cancer.
Recent studies reported Raman spectroscopy (RS) has the potential to diagnose and study the evolution of human malignancies both in vitro and in vivo in esophagus,[8] stomach,[9] lung,[10] breast,[11] prostate[12] arteries,[13] and others. Raman spectroscopy is an optical technique, which uses the inelastic scattering of monochromatic light to analyze vibrational modes of molecules.[14] Tumor tissue and normal tissue have different compositions because of the changes in the molecular structures of proteins, lipids, and pigments. Raman spectroscopy is able to detect the differences, and therefore, it has been considered as a promising tool for cancer diagnosis. Among other noninvasive optical techniques such as optical coherence tomography (OCT),[15,16] confocal laser scanning microscopy (CLSM)[17] or multiphoton tomography, Raman spectroscopy is molecular-specific and objective. Besides, its rapidity in examination and analysis allows real-time diagnosis. All these characteristics make RS a complementary tool in incipient lesion differentiation and intraoperative tumor margin assessment where histopathology is relatively impractical.
Raman spectroscopy has gained some clinical acceptance in the diagnosis of skin cancer.[18–29] However, these studies were inconclusive because of insufficient sample and different diagnostic algorithms. The aim of this meta-analysis was to systematically evaluate the accuracy of RS for discriminating normal tissue and skin cancer tissue.
2. Methods
2.1. Search strategy
As this is a meta-analysis, ethical approval was not necessary. We followed the guidelines for the systematic review and the meta-analysis of diagnostic studies.[30] Then we searched four databases, including PubMed, Embase, Cochrane Library, and CNKI, for the studies on February 4th, 2018, and no start date limit was applied. The search terms were “Raman” and “skin cancer." No language restriction is exposed. Reference lists of relevant articles were also searched. Two reviewers independently reviewed the articles. Disagreements were resolved by consensus.
2.2. Study selection criteria
The studies were selected on the basis of the following criteria: only human tissue used in the experiments; Raman spectroscopy was used as a diagnosis tool to distinguish tumor and normal tissues; used histopathology as criterion standard; provided with detailed data to construct a 2 × 2 contingency table for true-positive (TP), false-positive (FP), true-negative (TN), and false-negative (FN). If the 4 values were not reported, we calculated backwards using indexes including sensitivity, specificity, positive predictive value (PPV), and negative predictive value (NPV). Corresponding authors were contacted for the detailed data if no enough data was available.
Excluded criteria: unrelated articles, abstracts presented at academic conferences; included <10 spectra samples; without sufficient calculable data; duplicated reports, or studies based on the same study.
2.3. Date extraction
Two investigators extracted the data independently and disagreements were resolved by consensus. First author, year of publication, country, sample size, tumor type, methodological and technical data, numbers of TP, FP, TN, and FN were extracted from each study.
2.4. Quality assessment
The quality of each study was assessed by using a checklist based on the Quality Assessment of Diagnostic Accuracy Studies (QUADAS) guidelines, which is an established, evidence-based tool for systematic reviews of diagnostic studies designed for diagnostic accuracy.
2.5. Statistical method
Using the extracted data of TP, TN, FP, and FN, the pooled sensitivity, specificity, positive and negative likelihood ratios (LRs), and diagnostic odds ratio (DOR), with 95% confidence intervals (CI), were calculated based on bivariate generalized linear mixed modeling. Meta-Disc version 1.4 statistical software was used.
Furthermore, summary receiver operator characteristics (SROC) curves were constructed to examine the relationship between sensitivity and specificity. And the area under the curve (AUC) was calculated to assess the overall performance of Raman spectroscopy. In general, a diagnostic tool is regarded excellent when AUC values were between 0.9 and 1, good when AUC values were between 0.8 and 0.9, fair when AUC values were between 0.7 and 0.8, poor when AUC values were between 0.6 and 0.7, and failed when AUC values were between 0.5 and 0.6.[31] The SROC curves were also performed by Meta-Disc version 1.4.
2.6. Publication bias
Publication bias was assessed using Deeks funnel plot asymmetry test (P < .05 was considered that potential publication bias exits). The Deeks funnel plot asymmetry test was performed by Stata 11.0.
3. Results
3.1. Literature research
The initial literature search yielded 140 articles, which were then reviewed in title and abstract. Of these, 31 articles were further reviewed in full text. Then, 19 articles failed to satisfy the inclusion criterion: 5 were not relative, 8 were repeated reports, 3 did not use normal tissue as control group, and 3 had insufficient details to reconstruct the 2 × 2 table. So, 12 studies were included in this meta-analysis.[18–29] The study selection process is shown in Figure 1.
Figure 1.
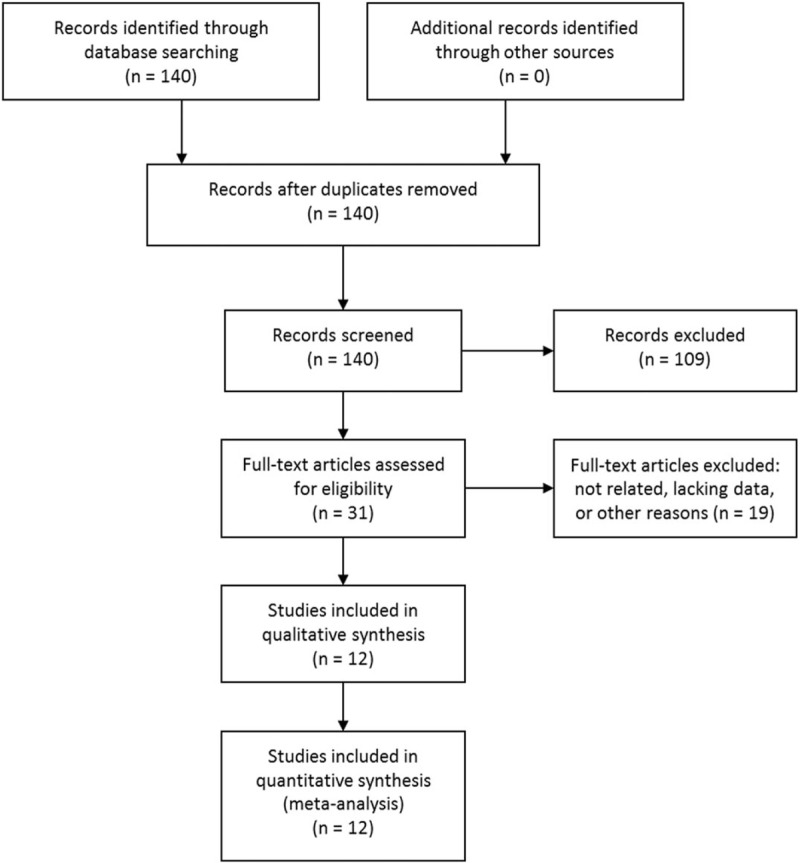
Literature search and selection.
3.2. Study characteristics
The detailed characteristics of the 12 studies were given in Table 1. These studies were operated in 6 different countries. All the articles were published between 2003 and 2015, and >75% were after 2008. The number of tissues involved in each study varied from 8 to 223. The number of the spectra retrieved varies from 13 to 505. The total number of spectra was 2461, with an average of 273.
Table 1.
Baseline characteristics of included studies.
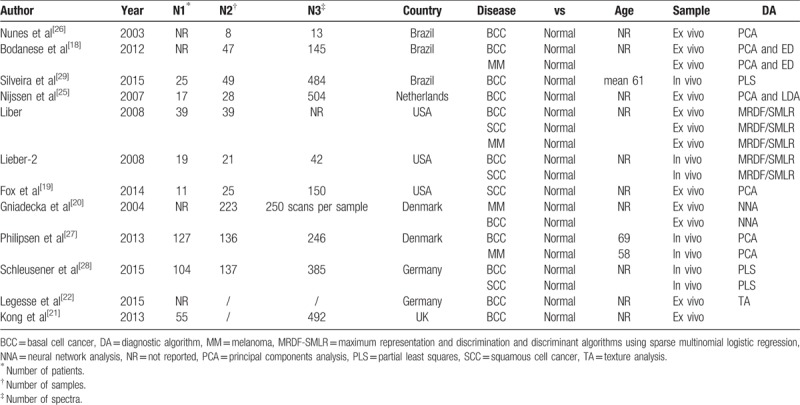
In these 12 eligible studies, BCC, SCC and MM were addressed in 10 studies, 4 studies, and 4 studies, respectively. Raman spectroscopy was applied both in vivo (4 studies) and ex vivo (8 studies). The analysis of the Raman spectra was performed with various diagnostic algorithms, including PCA (Principal components analysis), PLS (Partial Least Squares), MRDF-SMLR (maximum representation and discrimination and discriminant algorithms using sparse multinomial logistic regression), TA (Texture analysis), and NNA (Neural network analysis).
3.3. Pooled results
3.3.1. BCC/ex vivo group
Seven studies[18,20–23,25,26] examined BCC samples ex vivo. The pooled sensitivity and specificity of Raman spectroscopy for discriminating BCC samples and normal tissues ex vivo were 0.99 (95% CI 0.97–0.99) and 0.96 (95% CI 0.95–0.97), respectively. The plots were shown in Figure 2. The pooled PLR and NLR were 26.40 (95% CI 11.22–62.13) and 0.03 (95% CI 0.01–0.09), respectively. The DOR was 938.93 (95% CI 187.85–4693.05), demonstrating high accuracy. The SROC curve analysis was used to summarize overall diagnostic accuracy. The AUC was 0.9837.
Figure 2.
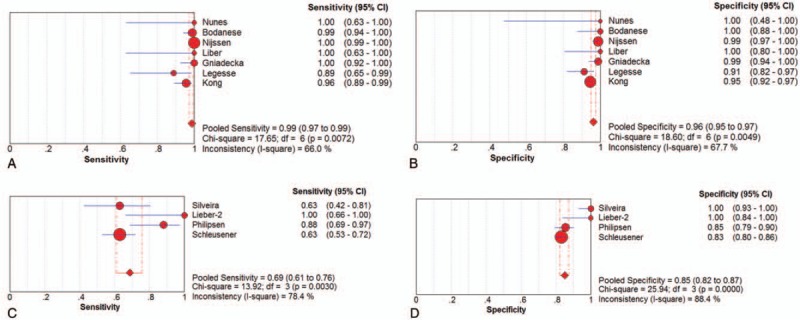
Individual study and pooled estimates of sensitivity and specificity and their 95% confidence intervals (CIs) of Raman spectroscopy to differentiate basal cell cancer from normal tissues ex vivo (A, B) and in vivo (C, D).
3.3.2. BCC/in vivo group
Four studies[24,27–29] examined BCC samples in vivo. The pooled sensitivity and specificity of Raman spectroscopy for discriminating BCC samples and normal tissues in vivo were 0.69 (95% CI 0.61–0.76) and 0.85 (95% CI 0.82–0.87), respectively. The plots were also shown in Figure 2. The pooled PLR and NLR were 6.20 (95% CI 3.05–12.57) and 0.32 (95% CI 0.19–0.55), respectively. The DOR was 44.85 (95% CI 7.63–263.43), also demonstrating very high accuracy. The SROC curve was also performed to summarize overall diagnostic accuracy. The AUC was 0.9213.
3.3.3. MM/ex vivo group
Three studies[18,20,23] examined MM samples ex vivo. The pooled sensitivity and specificity of Raman spectroscopy for discriminating MM samples and normal tissues ex vivo were 1.00 (95% CI 0.91–1.00) and 0.98 (95% CI 0.95–1.00), respectively. The plots were shown in Figure 3. The pooled PLR and NLR were 29.21 (95% CI 5.40–157.90) and 0.04 (95% CI 0.01–0.19), respectively. The DOR was 837.77 (95% CI 104.1–6742.41), demonstrating high accuracy. The SROC curve analysis was used to summarize overall diagnostic accuracy. The AUC was 0.9914.
Figure 3.
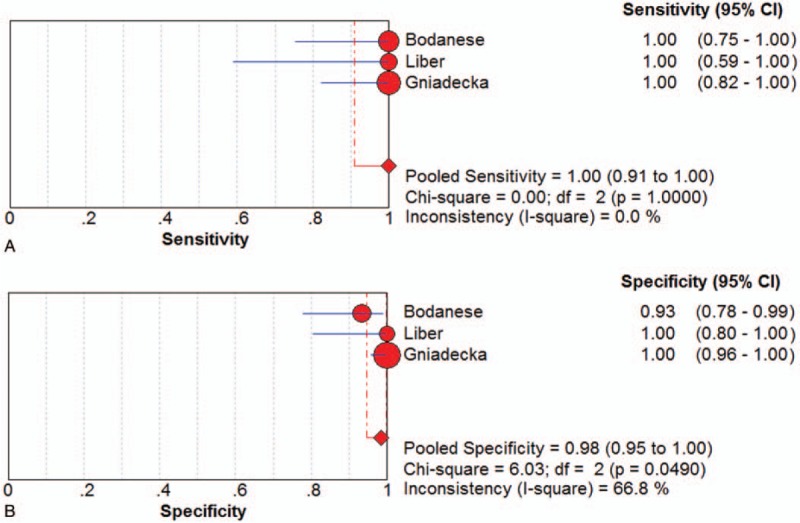
Individual study and pooled estimates of sensitivity (A) and specificity (B) and their 95% confidence intervals (CIs) of Raman spectroscopy to differentiate melanoma from normal tissues ex vivo.
3.3.4. MM/in vivo group
Only one study[27] examined MM samples in vivo for the discriminating role of the Raman spectroscopy. The sensitivity (0.93) and the specificity (0.96) balanced relatively well. The DOR was 371.
3.3.5. SCC/ex vivo group
Two studies[19,23] examined SCC samples ex vivo. The pooled sensitivity and specificity of Raman spectroscopy for discriminating SCC samples and normal tissues in vivo were 0.96 (95% CI 0.81–1.00) and 1.00 (95% CI 0.92–1.00), respectively. The plots were shown in Figure 4. The pooled PLR and NLR were 42.59 (95% CI 6.12–296.61) and 0.07 (95% CI 0.02–0.27), respectively. The DOR was 646.37 (95% CI 51.68–8084.81).
Figure 4.

Individual study and pooled estimates of sensitivity and specificity and their 95% confidence intervals (CIs) of Raman spectroscopy to differentiate squamous cell cancer from normal tissues ex vivo (A, B) and in vivo (C, D).
3.3.6. SCC/in vivo group
SCC samples were examined in vivo in 2 studies,[24,28] as shown in Table 2. The sensitivity of Raman spectroscopy for discriminating SCC samples and normal tissues in vivo was 0.81 (95% CI 0.70–0.90) and the specificity was 0.89 (95% CI 0.86–0.91), whereas the PLR and NLR were 7.29 (95% CI 5.69–9.33) and 0.22 (95% CI 0.13–0.35), respectively. The DOR was 33.81 (95% CI 17.78–64.31). The plots were shown in Figure 4.
Table 2.
Pooled estimations of sensitivity, specificity, positive likelihood ratio, negative likelihood ratio, diagnostic odd ratio, and area under curve of Raman spectroscopy to differentiate skin cancer from normal tissues.

3.4. Assessment of study quality
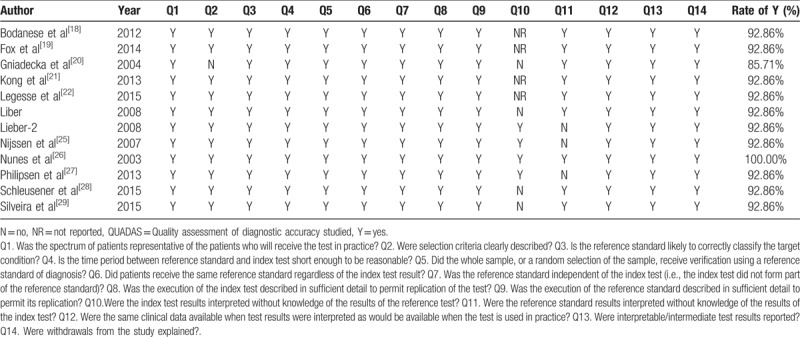
Two reviewers evaluated methodological quality for each study according to the QUADAS guidelines independently. Of the 12 studies, one study had a total quality score of 14 (100% rate of Y), 10 studies had a score of 13 (92.9% rate of Y), and the last 1 study had a score of 12 (85.7% rate of Y). Table 3 shows the results of the evaluation of each study.
Table 3.
Quality assessment of included studies using QUADAS questionnaire.
3.5. Publication bias
No publication bias was found in this meta-analysis (P values shown in Table 2).
4. Discussion
4.1. Implications
In this meta-analysis, we assessed the accuracy of Raman spectroscopy in differentiating skin cancer from normal tissue. For BCC ex vivo samples, the pooled sensitivity and specificity of RS were 0.99 and 0.96, respectively. The AUC was 0.9837. And those for BCC in vivo samples were 0.69 (sensitivity), 0.85 (specificity), and 0.9213 (AUC). For BCC, RS gave a better performance ex vivo comparing to in vivo detection. This can be found in MM and SCC as well. The most important reason might be that in vivo detection could provide less information about the lesions towing to the limited time to collect Raman images.[19] Ex vivo Raman images by scanning across the surface of the lesions could provide the spatial distribution of different tissue structures. However, it usually takes a long period of time. It would not be feasible for in vivo use, as it is hard for the patients to keep highly immobilized to obtain high spatial-resolution images.[18,19] There is a dearth of studies focused on in vivo detection, whereas many reports have demonstrated various ex vivo detection.[18] Thus, continued patient recruitment and future development of in vivo RS will be necessary to elucidate this matter.[18]
As we can see in Table 2, the accuracy of RS to differentiate between MM and normal tissue was higher than that of BCC and SCC. It is like because of the differences in the cellular origins of the cancers, as both BCC and SCC involve malignancy of keratinized epidermal cells and melanomas result from malignancy of melanocytes.[32–34] Because of the differences in composition, the spectral differences in the melanoma spectra are seen to be much more significant and at different wave number ranges that the BCC and SCC spectra, whereas the BCC and SCC spectra show significant differences in similar wave number ranges.[35] That may be the reason why the accuracy was different between MM and other 2 types of skin cancer.
According to the results, we can conclude that RS is a viable candidate for differentiating skin cancer from normal skin tissue. This research for the first time summarized the evidence on the accuracy of Raman spectroscopy in the detection of BCC, MM, and SCC both in vivo and ex vivo.
Raman spectroscopy is a promising diagnostic tool with several advantages. First, RS is easy to perform and requires no special staining or preparation.[19] This makes real-time diagnosis possible and be able to avoid surgical workflow disruption. Second, it only takes a few minutes to obtain an accurate diagnostic result with RS, whereas traditional analytic technique requires hours or days.[36] Third, RS is a noninvasive technique and does no harm to the patients. Besides, RS is molecular-specific, and therefore objective.[37] That is why RS is able to differentiate incipient lesions. Also, its high accuracy helps decrease the number of expensive tests needed to guarantee the correct diagnosis.[38]
With these characteristics, RS can be used as intraoperative guidance in skin cancer excision. By providing clear tumor margin, RS contributes to minimize the volume of residual tumor and avoid excessive removal of normal tissue. Besides, Raman-guided biopsy allows more accurate biopsy and reduces the incidence of repeated stereotactic biopsy procedure when no representative tumor tissue is found for the first time.[39] With its ability in differentiating incipient lesions, RS can be used in early screening test for skin cancer.[40] In radiation therapy, Raman technique can also find its value.[41]
To achieve extensive application of Raman spectroscopy, several factors need to be taken into consideration, including cost, maintenance, personnel training, analysis of the data, and time of investigation. RS requires periodic calibration and routine maintenance, which may increase its cost.[42] Although using RS to get data from the sample is easy to perform, the analysis of these data requires exquisite skills. That is why the training for qualified algorithm designers is so important.[43]
4.2. Limitations
This study also had several limitations. First, this meta-analysis is based on a limited number of studies. Although the number of spectra involved in is large (2461 spectra), more studies are needed. Second, the patient size in each study was small and the numbers of spectra differed sharply among the included studies and this variability might have affected the outcome. Third, two-thirds of the studies used ex vivo tissue. To prove whether Raman spectroscopy is an optimal diagnostic tool or not, more studies involving in vivo technique are needed. Furthermore, different techniques of Raman spectroscopy, and multiple algorithms were used in the included studies. Finally, the publication bias was a major concern for all meta-analysis. In our meta-analysis, although no publication bias was found (P > .05), it should be noted that any meta-analysis could not completely exclude biases. Therefore, more studies with more patients examined in vivo are needed.
4.3. Future research
In conclusion, our study suggested that Raman spectroscopy could be an effective and accurate tool for differentiating BCC, MM, SCC from normal tissue. The application of this promising novel method would improve the accuracy of skin cancer diagnosis and surgical removal in the future, by both avoiding removal of normal tissue and minimizing the volume of residual tumor. However, more studies are warranted to verify that and more efforts are still needed to improve this equipment and better serve clinical work.
Author contributions
Conceptualization: Jing Zhang, Jianguo Xu.
Data curation: Jing Zhang, Yimeng Fan, Yanlin Song.
Formal analysis: Jing Zhang, Yimeng Fan, Jianguo Xu.
Investigation: Jing Zhang.
Methodology: Jing Zhang.
Resources: Jing Zhang.
Software: Jing Zhang, Yimeng Fan, Yanlin Song.
Supervision: Jianguo Xu.
Writing – original draft: Jing Zhang, Yimeng Fan, Yanlin Song.
Writing – review & editing: Jing Zhang, Yimeng Fan, Yanlin Song, Jianguo Xu.
Footnotes
Abbreviations: AUC = area under curve, BCC = basal cell cancer, CI = confidence interval, DA = diagnostic algorithm, DOR = diagnostic odds ratio, MM = melanoma, MRDF-SMLR = maximum representation and discrimination and discriminant algorithms using sparse multinomial logistic regression, NLR = negative likelihood ratio, NNA = Neural network analysis, PCA = Principal components analysis, PLR = positive likelihood ratio, PLS = partial least squares, SCC = squamous cell cancer, TA = texture analysis.
The authors report no conflicts of interest.
References
- [1].Cakir BO, Adamson P, Cingi C. Epidemiology and economic burden of nonmelanoma skin cancer. Facial plast Surg Clin North Am 2012;20:419–22. [DOI] [PubMed] [Google Scholar]
- [2].Dubas LE, Ingraffea A. Nonmelanoma skin cancer. Facial Plast Surg Clin North Am 2013;21:43–53. [DOI] [PubMed] [Google Scholar]
- [3].Board PDQATE. Skin Cancer Treatment (PDQ(R)): Health Professional Version, PDQ Cancer Information Summaries. Bethesda (MD): National Cancer Institute (US); 2002. [Google Scholar]
- [4].Barker J, Kumar A, Stanton W, et al. The needs and experiences of people with a diagnosis of skin cancer. JBI Libr Syst Rev 2009;7(16 suppl):1–9. [DOI] [PubMed] [Google Scholar]
- [5].Slater DN. Doubt and uncertainty in the diagnosis of melanoma. Histopathology 2000;37:469–72. [DOI] [PubMed] [Google Scholar]
- [6].van der Rhee JI, Mooi WJ, Kukutsch NA, et al. Iatrogenic melanoma. Comment on: Melanoma epidemic: a midsummer night's dream? Br J Dermatol 2010;162:457–8. [DOI] [PubMed] [Google Scholar]
- [7].Skvara H, Teban L, Fiebiger M, et al. Limitations of dermoscopy in the recognition of melanoma. Arch Dermatol 2005;141:155–60. [DOI] [PubMed] [Google Scholar]
- [8].Kendall C, Hutchings J, Barr H, et al. Exploiting the diagnostic potential of biomolecular fingerprinting with vibrational spectroscopy. Faraday Discuss 2011;149:279–90. discussion 333-256. [DOI] [PubMed] [Google Scholar]
- [9].Huang Z, Teh SK, Zheng W, et al. In vivo detection of epithelial neoplasia in the stomach using image-guided Raman endoscopy. Biosens Bioelectron 2010;26:383–9. [DOI] [PubMed] [Google Scholar]
- [10].Magee ND, Beattie JR, Carland C, et al. Raman microscopy in the diagnosis and prognosis of surgically resected nonsmall cell lung cancer. J Biomed Opt 2010;15:026015. [DOI] [PubMed] [Google Scholar]
- [11].Haka AS, Shafer-Peltier KE, Fitzmaurice M, et al. Diagnosing breast cancer by using Raman spectroscopy. Proc Natl Acad Sci U S A 2005;102:12371–6. [DOI] [PMC free article] [PubMed] [Google Scholar]
- [12].Stone N, Hart Prieto MC, Crow P, et al. The use of Raman spectroscopy to provide an estimation of the gross biochemistry associated with urological pathologies. Anal Bioanal Chem 2007;387:1657–68. [DOI] [PubMed] [Google Scholar]
- [13].Brennan JF, 3rd, Romer TJ, Lees RS, et al. Determination of human coronary artery composition by Raman spectroscopy. Circulation 1997;96:99–105. [DOI] [PubMed] [Google Scholar]
- [14].Calin MA, Parasca SV, Savastru R, et al. Optical techniques for the noninvasive diagnosis of skin cancer. J Cancer Res Clin Oncol 2013;139:1083–104. [DOI] [PubMed] [Google Scholar]
- [15].Alawi SA, Kuck M, Wahrlich C, et al. Optical coherence tomography for presurgical margin assessment of non-melanoma skin cancer—a practical approach. Exp Dermatol 2013;22:547–51. [DOI] [PubMed] [Google Scholar]
- [16].Welzel J, Lankenau E, Birngruber R, et al. Optical coherence tomography of the human skin. J Am Acad Dermatol 1997;37:958–63. [DOI] [PubMed] [Google Scholar]
- [17].Caspers PJ, Lucassen GW, Puppels GJ. Combined in vivo confocal Raman spectroscopy and confocal microscopy of human skin. Biophys J 2003;85:572–80. [DOI] [PMC free article] [PubMed] [Google Scholar]
- [18].Bodanese B, Silveira FL, Zangaro RA, et al. Discrimination of basal cell carcinoma and melanoma from normal skin biopsies in vitro through Raman spectroscopy and principal component analysis. Photomed Laser Surg 2012;30:381–7. [DOI] [PMC free article] [PubMed] [Google Scholar]
- [19].Fox SA, Shanblatt AA, Beckman H, et al. Raman spectroscopy differentiates squamous cell carcinoma (SCC) from normal skin following treatment with a high-powered CO2 laser. Lasers Surg Med 2014;46:757–72. [DOI] [PubMed] [Google Scholar]
- [20].Gniadecka M, Philipsen PA, Sigurdsson S, et al. Melanoma diagnosis by Raman spectroscopy and neural networks: structure alterations in proteins and lipids in intact cancer tissue. J Invest Dermatol 2004;122:443–9. [DOI] [PubMed] [Google Scholar]
- [21].Kong K, Rowlands CJ, Varma S, et al. Diagnosis of tumors during tissue-conserving surgery with integrated autofluorescence and Raman scattering microscopy. Proc Natl Acad Sci U S A 2013;110:15189–94. [DOI] [PMC free article] [PubMed] [Google Scholar]
- [22].Legesse FB, Medyukhina A, Heuke S, et al. Texture analysis and classification in coherent anti-Stokes Raman scattering (CARS) microscopy images for automated detection of skin cancer. Comput Med Imag Graph 2015;43:36–43. [DOI] [PubMed] [Google Scholar]
- [23].Lieber CA, Majumder SK, Billheimer D, et al. Raman microspectroscopy for skin cancer detection in vitro. J Biomed Optics 2008;13:024013. [DOI] [PubMed] [Google Scholar]
- [24].Lieber CA, Majumder SK, Ellis DL, et al. In vivo nonmelanoma skin cancer diagnosis using Raman microspectroscopy. Lasers Surg Med 2008;40:461–7. [DOI] [PMC free article] [PubMed] [Google Scholar]
- [25].Nijssen A, Maquelin K, Santos LF, et al. Discriminating basal cell carcinoma from perilesional skin using high wave-number Raman spectroscopy. J Biomed Optics 2007;12:034004. [DOI] [PubMed] [Google Scholar]
- [26].Nunes LO, Silveira MA, Zampieri L., Jr FT-Raman spectroscopy study for skin cancer diagnosis. Spectroscopy 2003;17:597–602. [Google Scholar]
- [27].Philipsen PA, Knudsen L, Gniadecka M, et al. Diagnosis of malignant melanoma and basal cell carcinoma by in vivo NIR-FT Raman spectroscopy is independent of skin pigmentation. Photochem Photobiol Sci 2013;12:770–6. [DOI] [PubMed] [Google Scholar]
- [28].Schleusener J, Gluszczynska P, Reble C, et al. In vivo study for the discrimination of cancerous and normal skin using fibre probe-based Raman spectroscopy. Exp Dermatol 2015;24:767–72. [DOI] [PubMed] [Google Scholar]
- [29].Silveira FL, Pacheco MT, Bodanese B, et al. Discrimination of non-melanoma skin lesions from non-tumor human skin tissues in vivo using Raman spectroscopy and multivariate statistics. Lasers Surg Med 2015;47:6–16. [DOI] [PubMed] [Google Scholar]
- [30].Moher D, Shamseer L, Clarke M, et al. Preferred reporting items for systematic review and meta-analysis protocols (PRISMA-P) 2015 statement. Syst Rev 2015;4:1. [DOI] [PMC free article] [PubMed] [Google Scholar]
- [31].Metz CE. Basic principles of ROC analysis. Semin Nucl Med 1978;8:283–98. [DOI] [PubMed] [Google Scholar]
- [32].Lapouge G, Youssef KK, Vokaer B, et al. Identifying the cellular origin of squamous skin tumors. Proc Natl Acad Sci U S A 2011;108:7431–6. [DOI] [PMC free article] [PubMed] [Google Scholar]
- [33].Regad T. Molecular and cellular pathogenesis of melanoma initiation and progression. Cell Mol Life Sci 2013;70:4055–65. [DOI] [PMC free article] [PubMed] [Google Scholar]
- [34].Youssef KK, Van Keymeulen A, Lapouge G, et al. Identification of the cell lineage at the origin of basal cell carcinoma. Nat Cell Biol 2010;12:299–305. [DOI] [PubMed] [Google Scholar]
- [35].Clark WH, Jr, From L, Bernardino EA, et al. The histogenesis and biologic behavior of primary human malignant melanomas of the skin. Cancer Res 1969;29:705–27. [PubMed] [Google Scholar]
- [36].Huang Z, McWilliams A, Lui H, et al. Near-infrared Raman spectroscopy for optical diagnosis of lung cancer. Int J Cancer 2003;107:1047–52. [DOI] [PubMed] [Google Scholar]
- [37].Michalska M, Chodorowska G, Krasowska D. SIAscopy—a new non-invasive technique of melanoma diagnosis. Ann Univ Mariae Curie Sklodowska Med 2004;59:421–31. [PubMed] [Google Scholar]
- [38].Leslie DG, Kast RE, Poulik JM, et al. Identification of pediatric brain neoplasms using Raman spectroscopy. Pediatr Neurosurg 2012;48:109–17. [DOI] [PubMed] [Google Scholar]
- [39].Bohorfoush AG. Tissue spectroscopy for gastrointestinal diseases. Endoscopy 1996;28:372–80. [DOI] [PubMed] [Google Scholar]
- [40].Bratchenko IA, Artemyev DN, Myakinin OO, et al. Combined Raman and autofluorescence ex vivo diagnostics of skin cancer in near-infrared and visible regions. J Biomed Optics 2017;22:27005. [DOI] [PubMed] [Google Scholar]
- [41].Bakker Schut TC, Witjes MJ, Sterenborg HJ, et al. In vivo detection of dysplastic tissue by Raman spectroscopy. Anal Chem 2000;72:6010–8. [DOI] [PubMed] [Google Scholar]
- [42].Zeng H, Zhao J, Short M, et al. Raman spectroscopy for in vivo tissue analysis and diagnosis, from instrument development to clinical applications. J Innovative Opt Health Sci 2008;01:95–106. [Google Scholar]
- [43].Zhao J, Lui H, Kalia S, et al. Real-time Raman spectroscopy for automatic in vivo skin cancer detection: an independent validation. Anal Bioanal Chem 2015;407:8373–9. [DOI] [PubMed] [Google Scholar]


