Abstract
The purpose of this study was to determine the diagnostic value of multidetector computed tomography (MDCT) imaging findings, to identify the most predictive findings, and to assess diagnostic performance in the diagnosis and differentiation of acute cholecystitis from chronic cholecystitis.
In this retrospective study, we enrolled 382 consecutive patients with pathologically proven acute or chronic cholecystitis who underwent computed tomography (CT) within 1 month before surgery. The CT findings were compared and logistic regression analysis was used to identify significant CT findings in predicting acute cholecystitis. Diagnostic performance of each CT finding and of combined findings was also assessed.
Statistically significant CT findings distinguishing acute cholecystitis from chronic cholecystitis were increased gallbladder dimension (85.5% vs 50.6%, P < .001), increased wall enhancement (61.8% vs 78.9%, P = .001), increased wall thickness (67.9% vs 31.1%, P < .001), mural striation (64.9% vs 28.3%, P < .001), pericholecystic haziness or fluid (66.4% vs 21.2%, P < .001), increased adjacent hepatic enhancement (80.0% vs 32.4%, P < .001), focal wall defect (9.2% vs 0, P < .001), and pericholecystic abscess (10.7% vs 0, P < .001). Subsequent multivariate logistic regression analysis revealed that increased adjacent hepatic enhancement [P = .006, odds ratio (OR) = 3.82], increased gallbladder dimension (P = .027, OR = 3.12), increased wall thickening or mural striation (P = .019, OR = 2.89), and pericholecystic haziness or fluid (P = .032, OR = 2.61) were significant predictors of acute cholecystitis. When 2 of these 4 CT findings were observed together, the sensitivity, specificity, and accuracy for the detection of acute cholecystitis were 83.2%, 65.7%, and 71.7%, respectively. When 3 of these 4 CT findings were observed together, the sensitivity, specificity, and accuracy were 56.5%, 84.5%, and 74.9%, respectively. When none of these 4 CT findings were observed, the negative predictive value was 96.4%.
Increased adjacent hepatic enhancement, increased gallbladder dimension, increased wall thickening or mural striation, and pericholecystic fat haziness or fluid were the most discriminative MDCT findings for the diagnosis and differentiation of acute cholecystitis from chronic cholecystitis.
Keywords: acute cholecystitis, chronic cholecystitis, multidetector computed tomography
1. Introduction
Acute cholecystitis occurs in about one-third of patients with acute right upper quadrant (RUQ) pain,[1] which can also occur in various diseases, including chronic cholecystitis, acute pancreatitis, diverticulitis, colitis, appendicitis, Fitz-Hugh-Curtis syndrome, ureteral stone, and omental infarction.[2] In 1 study of patients with acute RUQ pain, only about one-third had acute cholecystitis (34.6%), while others had chronic cholecystitis (32.7%) or a normal gallbladder (32.7%).[3] Treatment strategies differ between acute cholecystitis and chronic cholecystitis. The former warrants prompt cholecystectomy or percutaneous cholecystostomy and antibiotic therapy in high-risk patients, whereas the latter can be generally managed with elective cholecystectomy. Thus, to avoid potential complications of emergent surgery or intervention and disease progression to complicated cholecystitis by delayed diagnosis, timely accurate diagnosis and differentiation of acute cholecystitis from chronic cholecystitis is important.
A recent meta-analysis reported that cholescintigraphy has the highest diagnostic accuracy for detection of acute cholecystitis, and ultrasonography (US) and magnetic resonance imaging (MRI) show considerable diagnostic accuracy; however, computed tomography (CT) was underevaluated due to scarce data.[4] Furthermore, a recent comparison study of CT and MRI in the differentiation of acute from chronic cholecystitis showed better sensitivity and accuracy in individual findings on MRI compared to CT.[5] Although several studies reported moderate-to-excellent diagnostic performance by CT,[6–10] most of them occurred 15 years ago before the widespread use of multidetector CT (MDCT) and only observed the frequency of a specific variable, not the overall capacity of CT.
In the era of MDCT, CT is frequently performed in the acute abdomen setting because of its large field of view for differential diagnosis, fast scan time, and high temporal and spatial resolution.[4] To our knowledge, no reports have described all the imaging findings for acute and chronic cholecystitis on MDCT with regard to diagnostic performance, unlike MRI.[11]
Typical CT findings of acute cholecystitis have been well described, with overlapping findings between acute and chronic cholecystitis.[12,13] Therefore, it has been challenging to routinely differentiate between acute and chronic cholecystitis, compared with the ease of differentiating cholecystitis from normal gallbladder.
Thus, the present study was conducted on a large number of populations to determine the diagnostic value of individual imaging findings, to identify the most predictive findings, and to assess the sensitivity, specificity, accuracy, positive predictive value (PPV), and negative predictive value (NPV) of MDCT in the diagnosis and differentiation of acute from chronic cholecystitis, with pathologic results as the gold standard.
2. Materials and methods
2.1. Patients
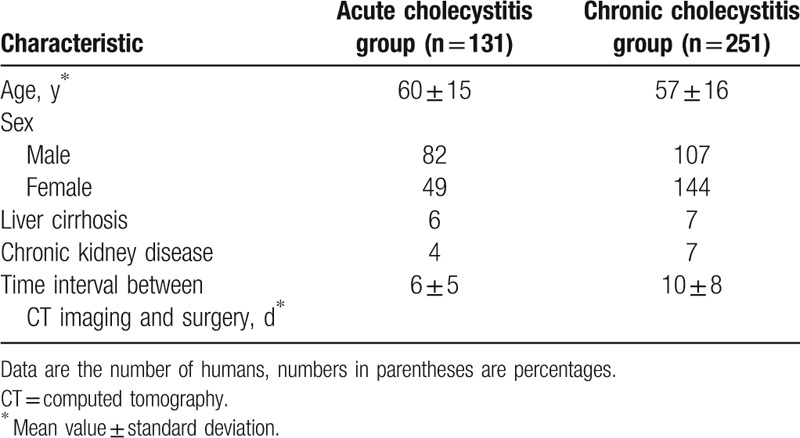
This retrospective study was approved by our Institutional Review Board, and patient informed consent was waived. From January 2014 to September 2016, cholecystectomy was performed on 608 patients. Two hundred twenty-six patients were excluded for the following reasons: 87 did not undergo CT, 15 underwent unenhanced CT, 59 underwent surgery more than 30 days after CT, 4 presented with predominant findings of pancreatitis, and 61 had other pathologic results such as xanthogranulomatous cholecystitis (n = 13), adenomyomatosis (n = 6), gallbladder cancer (n = 20), a Klatskin tumor (n = 2), or no pathologic gallbladder (n = 20). Thus, we enrolled 382 consecutive patients with acute or chronic cholecystitis proven pathologically by surgery who underwent preoperative contrast-enhanced CT within 1 month before surgery. There were 82 men and 49 women in the acute cholecystitis group (n = 131) and 107 men and 144 women in the chronic cholecystitis group (n = 251) (Fig. 1). The mean age was 60 (range, 14–93 years) and 57 (range, 18–93 years) years, respectively. The mean time interval between CT and surgery was 6 ± 5 [SD] and 10 ± 8 days, respectively (Table 1).
Figure 1.

Flowchart illustrates the patient selection process.
Table 1.
Characteristics of study population (n = 382).
2.2. Image acquisition
CT images were acquired with a 64- or 128-channel MDCT (Sensation 64 and Somatom Definition Flash; Siemens, Erlangen, Germany) with the following scanning parameters: beam collimation 0.6 to 1.2 mm; pitch 1.2 to 1.4; tube voltage, 100 to 120 kVp; and tube current and rotation time, 160 to 210 mAs. Contrast-enhanced images were obtained after infusion with 110 to 120 mL of iopromide (Ultravist 300; Bayer-Schering Pharma, Berlin, Germany) or iohexol (Iobrix 350; Taejoon Pharmaceutical, Kyungkido, South Korea) injected at 3 to 4 mL/s using a power injector. The contrast-enhanced images were obtained 20 seconds after achieving 100-Hounsfield unit (HU) attenuation of the descending aorta, as measured with a bolus-tracking technique for the arterial phase images. For the portal venous phase, a 70-second fixed delay was adopted. All 382 patients involved in the study had performed portal phase CT, but the arterial images were obtained in part (acute cholecystitis, n = 45; chronic cholecystitis, n = 136). Axial CT images were reconstructed with a 3 mm section thickness and a 3-mm interval, and then coronal and sagittal multiplanar reconstruction images were reconstructed with a 3 mm section thickness and a 3-mm interval.
2.3. Image analysis
To prevent recall bias, CT images were reviewed 2 weeks after patient enrollment. One gastrointestinal radiologist (D.M.Y, with 5 years of experience) who was blinded to the clinical information, imaging reports, and final pathologic type of cholecystitis (though aware that cholecystitis was present) reviewed the images retrospectively in random order using picture archiving and communication system software (Maroview 5.4; Infinite, Seoul, South Korea). CT imaging findings of acute cholecystitis were evaluated according to the following criteria[7,13,14]: gallstone, increased bile attenuation within the gallbladder including measurement of bile CT number (HU), short and long diameters of the gallbladder lumen, increased gallbladder dimension, increased gallbladder wall enhancement (mucosal or mural enhancement), increased gallbladder wall thickening (>3 mm[9]), measurement of the wall thickness, mural striation, pericholecystic fat stranding or fluid, increased adjacent hepatic enhancement on the arterial phase, focal wall defect, pericholecystic abscess, and sloughed membrane.
Gallstones were deemed present if a sufficient attenuation difference (higher or lower) from bile was visualized. Bile was evaluated for increased attenuation relative to the fluid density within the bowel.[15] Bile attenuation was measured at least 5 times. Then, the highest CT number was achieved. The luminal diameter was measured without including the wall. The presence of increased gallbladder dimension was assessed by cutoff values, which were determined by using receiver operating characteristic (ROC) curve analysis for differentiating acute from chronic cholecystitis. GB wall enhancement was considered to be increased when it was equal to or greater than liver parenchymal enhancement on portal phase images in patients with normal renal function.[15] In the 11 patients with chronic kidney disease, gallbladder wall enhancement was evaluated solely on the basis of the reviewer's experiences. Mural striation was identified if a central hypodense halo was present between the inner and outer margin enhancement of the wall. Given that acute cholecystitis is a progressive disease (mild edematous disease to a suppurative form[16]), we assumed that 2 findings of mural striation (subserosal edema) or increased thickness (>3 mm) of the gallbladder wall could be considered associated with a spectrum of gallbladder wall inflammation. Pericholecystic fat stranding was defined as increased fat attenuation around the gallbladder as well as loss of the sharp fat plane between the gallbladder and the liver. Increased adjacent hepatic enhancement was assessed if arterial phase CT images were available (acute cholecystitis, n = 45; chronic cholecystitis, n = 136) and was deemed present if a thin or thick curvilinear shape around the gallbladder fossa was present, as opposed to a geographic pattern at the expected location of focal fat sparing or deposition on a nonenhanced CT image.[17] Sloughed membrane was considered when the presence of internal irregular linear soft-tissue densities was observed within the gallbladder.
2.4. Statistical analysis
All statistical analyses were performed using statistical software R, version 3.2.1.[18] Pearson Chi-square tests were used for comparisons of CT findings between acute and chronic cholecystitis groups with the moonBook package.[19] The Student t test was used to evaluate differences in bile attenuation, gallbladder wall thickness, and luminal diameter between the 2 groups. The cut-off values for short and long luminal diameters were determined by ROC curve analysis.[20] Univariate logistic regression analysis was used to determine the significance of each CT finding in predicting acute cholecystitis by odds ratio (OR) evaluation. Multivariate stepwise logistic regression analysis with backward elimination was used to determine the most significant CT findings for diagnosing acute cholecystitis. Variables with a P value of <.2 in the univariate analysis were used as input variables for multivariate stepwise logistic regression. The diagnostic performance (sensitivity, specificity, accuracy, PPV, NPV) of each CT finding and of combined findings in the diagnosis and differentiation between acute and chronic cholecystitis was calculated on the basis of the pathologic diagnosis as a reference standard. For all tests, P < .05 was considered indicative of a statistically significant difference.
3. Results
Out of 382 enrolled patients, there were 14 liver cirrhosis patients (acute cholecystitis, n = 6; chronic cholecystitis, n = 7). One patient was Child-Pugh class C and the rest were Child-Pugh class A, and 4 patients had minimal ascites only in the pelvic cavity (acute cholecystitis, n = 6; chronic cholecystitis, n = 7). The 1 Child-Pugh class C patient did not show mural striation of the gallbladder or pericholecystic fluid, which could be produced by decreased liver function due to cirrhosis.
3.1. Comparison of MDCT findings between acute cholecystitis and chronic cholecystitis groups
The distribution of MDCT findings between the 2 groups is summarized in Table 2. There were significant differences in CT findings of increased gallbladder dimension (P < .001), increased wall enhancement (P = .001), increased wall thickness (P < .001), mural striation (P < .001), pericholecystic haziness or fluid (P < .001), increased adjacent hepatic enhancement (P < .001), focal wall defects (P < .001), and pericholecystic abscess (P < .001) between the 2 groups. Of these, increased gallbladder dimension showed the highest frequency in the acute cholecystitis group [85.5% (112 of 131)]. There was also a high frequency of increased adjacent hepatic enhancement [80.0% (36 of 45)], but this finding was assessed in the small number of patients who underwent arterial phase imaging. Combined findings of increased thickness or mural striation [70.2% (92 of 131)] showed higher frequencies in the acute cholecystitis group than each finding separately [67.9% (89 of 131) and 64.9% (85 of 131), respectively].
Table 2.
The distribution of CT findings between acute cholecystitis group and chronic cholecystitis group.
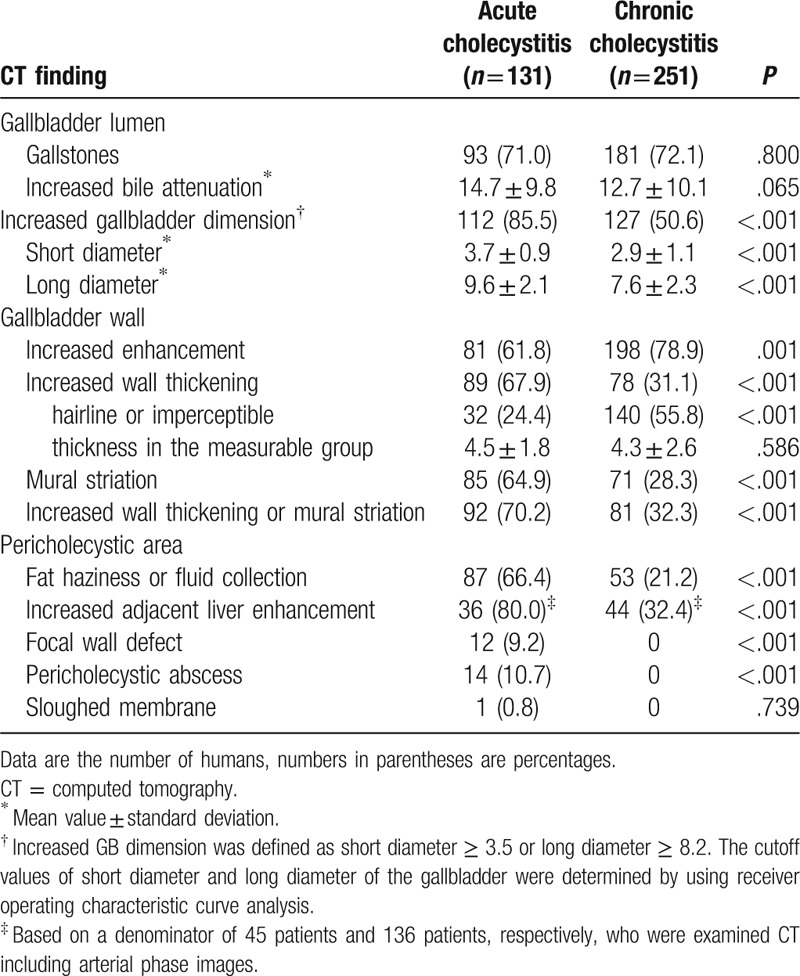
However, the presence of gallstones (P = .800), increased bile attenuation (P = .065), and sloughed membrane (P = .739) were not statistically different by group. Sloughed membrane was seen in only 1 patient with acute cholecystitis.
The mean short and long diameter of the gallbladder in acute cholecystitis was significantly larger than in chronic cholecystitis (short diameter, 3.7 ± 0.9 vs 2.9 ± 1.1 cm; long diameter 9.6 ± 2.1 vs 7.6 ± 2.3 cm) (all, P < 0.001). Gallbladder wall thickness and bile attenuation did not exhibit significant differences between the groups. However, hairline or imperceptible gallbladder wall was seen at a significantly higher frequency in the chronic cholecystitis group [acute cholecystitis, 24.4% (32 of 131); chronic cholecystitis, 55.8% (140 of 251)] (P < .001) (Figs. 2 and 3).
Figure 2.
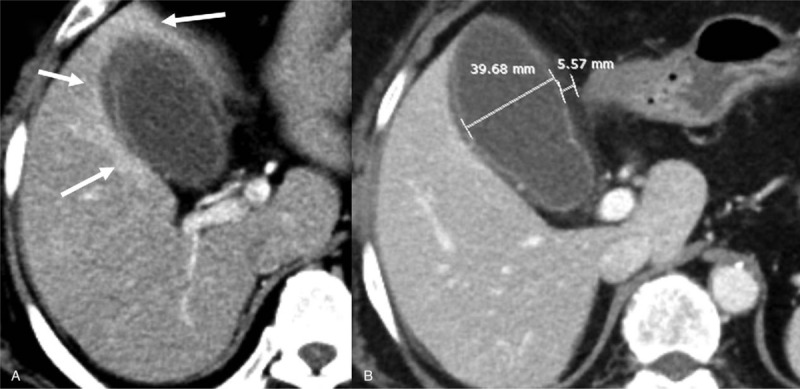
A 72-year-old woman with acute cholecystitis. (A) The arterial phase CT image shows an area of thick rim-like enhancement around the gallbladder in all directions. (B) The portal phase CT image shows mural striation with a thickened wall (5.57 mm) and luminal distension (3.97 cm) of the gallbladder.
Figure 3.
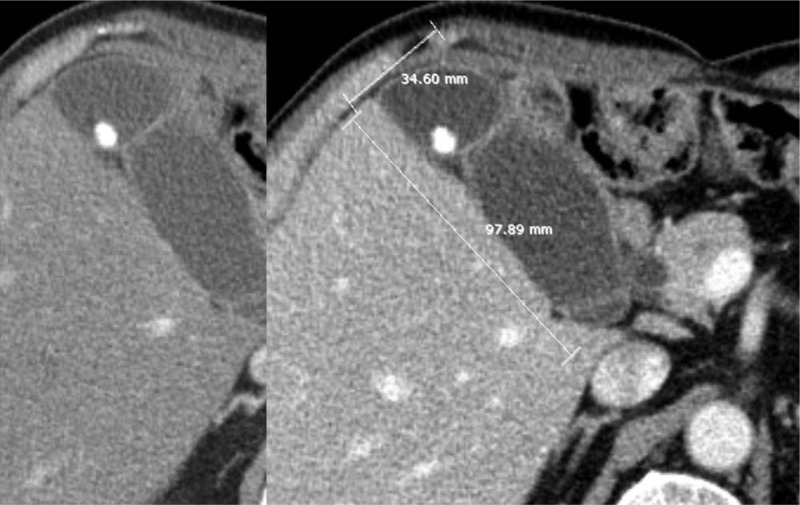
A 65-year-old man with chronic cholecystitis. CT images show gallstones and a distended gallbladder (short axis 3.46 cm, long axis 9.79 cm). However, the arterial phase CT image (left) does not display increased adjacent liver hyperenhancement around the gallbladder. Increased gallbladder wall thickening or mural striation is also not seen.
3.2. Univariate and multivariate logistic regression analysis
Univariate logistic regression analysis showed that increased gallbladder dimension, increased wall enhancement, wall thickening, mural striation, pericholecystic haziness or fluid, and increased adjacent hepatic enhancement were significant predictors of acute cholecystitis (Table 3). Multivariate logistic regression analysis revealed that increased adjacent hepatic enhancement (P = .006, OR = 3.82), increased gallbladder dimension (P = .027, OR = 3.12), increased wall thickening or mural striation (P = .019, OR = 2.89), and pericholecystic haziness or fluid (P = .032, OR = 2.61) were the most discriminative MDCT findings for the diagnosis of acute cholecystitis and the differentiation between acute and chronic cholecystitis (Fig. 4).
Table 3.
Results of univariate and multivariate analysis for diagnosis of acute cholecystitis.

Figure 4.
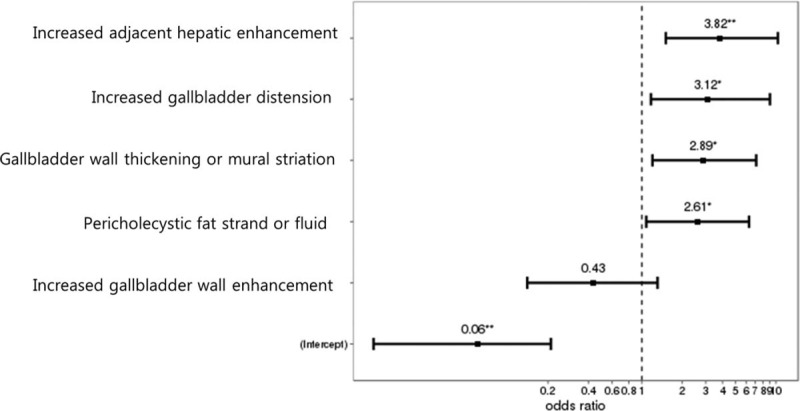
Plot illustrates the odds ratio of significant CT findings for the diagnosis and differentiation of acute cholecystitis from chronic cholecystitis.
3.3. Diagnostic performance in differentiating acute cholecystitis from chronic cholecystitis
Table 4 lists the sensitivity, specificity, accuracy, PPV, and NPV of each finding and combined findings for the diagnosis and differentiation of acute cholecystitis. Considering each finding alone, increased gallbladder dimension had the highest sensitivity for the detection of acute cholecystitis (85.5%), the lowest specificity (50.6%), and low accuracy (62.6%). Pericholecystic haziness or fluid collection had the highest specificity (78.8%), the lowest sensitivity (66.4%), and moderate accuracy (74.5%). When at least 1 of these 4 CT findings was detected, the sensitivity was 97.7%. When 2 of these 4 CT findings were observed in combination, the sensitivity, specificity, and accuracy for the detection of acute cholecystitis were 83.2%, 65.7%, and 71.7%, respectively. When 3 of these 4 CT findings were observed in combination, sensitivity, specificity, and accuracy were 56.5%, 84.5%, and 74.9%, respectively. When none of these 4 CT findings were observed, the NPV was 96.4%.
Table 4.
Diagnostic performance of CT findings for diagnosis and differentiation of acute cholecystitis.

4. Discussion
Our study revealed significant imaging findings for acute cholecystitis, identified the most discriminative findings by logistic regression analysis, and quantified the performance of MDCT to diagnose and differentiate acute from chronic cholecystitis by calculating the sensitivity, specificity, accuracy, PPV, and NPV of individual or combined findings.
Typical CT findings of acute cholecystitis have been described as gallstones, high-attenuated bile, gallbladder distension, increased wall thickening, increased wall enhancement, mural striation, pericholecystic stranding or fluid, and increased hyperenhancement of the adjacent liver.[7,12,13] Of these, gallstones and high-attenuated bile were not statistically different between acute and chronic cholecystitis, and the chronic cholecystitis group revealed more frequent hyperenhancement of the gallbladder wall than the acute cholecystitis group. Acute cholecystitis is related to gallstones in about 90% to 95% of cases and chronic cholecystitis is also almost always associated with the presence of gallstones. The ability to detect gallstones by CT is approximately 75%, due to the gallstones isodense to bile.[13] Our study showed 71.0% and 72.1% sensitivities for the detection of gallstones in acute and chronic cholecystitis, respectively. High-attenuated bile and gallbladder wall hyperenhancement have been described as common findings in acute cholecystitis patients, compared with the normal population. However, as gallbladder dysmotility is commonly present in chronic cholecystitis, increased bile CT attenuation due to concentrated bile was also frequently seen in the chronic cholecystitis group. Furthermore, in a recent study, CT attenuation of gallbladder bile did not differ between acute cholecystitis patients and a control group.[15] The present study noted gallbladder wall hyperenhancement in both groups, but it was seen more frequently in chronic cholecystitis. Chronic cholecystitis is thought to be the result of mechanical irritation or recurrent acute cholecystitis leading to chronic inflammation, fibrosis, and thickening of the gallbladder wall, which explains increased wall enhancement of the gallbladder compared with acute cholecystitis with edematous, necrotizing, or suppurative gallbladder wall, which leads to fluid or microabscess lowering CT attenuation.
With the ORs obtained via multivariate logistic regression analysis, the diagnostic value for each finding was in the following order: increased adjacent liver enhancement, pericholecystic fat haziness and fluid, increased gallbladder dimension, and increased wall thickening or mural striation. In 1 recent case-control study of acute cholecystitis versus normal population on helical CT, the most discriminating findings by univariate analysis were pericholecystic fat stranding, mural stratification, pericholecystic hypervascularity, hyperattenuated gallbladder wall, short and long gallbladder axis enlargement, and gallbladder wall thickening, which were similar results.[10]
Increased adjacent liver enhancement is well known to be a transient hepatic attenuation difference (THAD) on arterial phase CT, which is induced by increased arterial flow secondary to adjacent gallbladder inflammation and portal inflow reduction due to interstitial edema.[21] Although THAD is also induced by accessory veins, especially in segment IV, it is generally geographic or localized and is frequently identified as fat deposition in normal liver or sparing in fatty liver by persistent hemodynamic change at a corresponding area on nonenhanced imaging.[22] Hence, this can be carefully differentiated from the THAD of acute cholecystitis, which has a rim-like or thicker enhancement surrounding the gallbladder in all directions. The high sensitivity and moderate specificity of THAD in our study is also in close agreement with previous reports. One of these reports suggested that THAD is the most predictive finding in early or mild cholecystitis.[11,15] However, THAD should be assessed only in the arterial phase due to rapid change from isodense to normal hepatic parenchyma. Therefore, arterial phase CT is recommended for patients with suspected gallbladder disease.
Pericholecystic fat haziness or fluid collection and increased wall thickening or mural striation show moderate sensitivity and specificity. We considered increased wall thickening or mural striation as gallbladder wall inflammation. There are several explanations for this. Because increased wall thickening was defined as thicker than 3 mm based on previous reports, a mildly thickened wall was not included, although the normal gallbladder wall is thin-hairline or imperceptible. As acute cholecystitis is a progressive inflammatory disease from the edematous phase to the necrotizing phase to the suppurative phase, CT features can be subserosal edema without thickening or wall thickening without edema, depending on timing of the disease progression. Therefore, to include various stages of acute cholecystitis, any 2 findings were assessed as a spectrum of gallbladder wall inflammation.
However, single imaging finding of mural striation is nonspecific that could be observed in a variety of disease states, including hypoalbuminemia, hepatitis, and other inflammatory processes in the abdomen such as pancreatitis.[13,23] And because chronic cholecystitis can lead to chronic inflammation, fibrosis, and thickening of the gallbladder wall, imaging feature of inflamed wall overlaps significantly between acute and chronic cholecystitis. The previous report regarding gallbladder wall findings on MRI in acute and chronic cholecystitis also mentioned that mural striation is a common finding between the 2 groups, with marginal differences showing ill-defined or sharply demarcated striation, respectively.[24] Although our results showed statistically significant differences of gallbladder wall thickening or mural striation between the acute and chronic cholecystitis groups, radiologists should keep in mind inherent weakness and unavoidable overlap of these findings between these groups when interpreting images.
Increased gallbladder distension showed the highest sensitivity but low specificity. Increased gallbladder size has been defined as a transverse diameter > 4 cm or a longitudinal diameter > 8 cm based on previous studies.[7,11,13] Our study showed that the cut-off values for differentiating acute from chronic cholecystitis were 3.5 and 8.2 cm, respectively. Although the cut-off of the transverse diameter was slightly smaller, this is consistent with that of the earlier study, which reported that mild or early acute cholecystitis shows less than 4 cm of axial diameter (range, 3.0–4.3 cm; mean, 3.7 cm) in most cases,[15] This suggests that mild or early acute cholecystitis probably could be included in our cases.
In daily practice, we observe partial or all of CT findings of increased adjacent liver enhancement, pericholecystic fat haziness or fluid, increased gallbladder dimension, and increased wall thickening or mural striation in patients. In addition, if these CT findings appear, it is necessary to distinguish them from those of other diseases or clinical situations mentioned above, including hypoalbuminemia associated with liver or kidney disease, hepatitis, pancreatitis, or long fasting by considering clinical and laboratory information. Furthermore, after excluding other situations, even if cholecystitis is strongly suspected in the patient, there is another obstacle that overlaps clinical and imaging features between acute and chronic cholecystitis. Thus, to provide sufficient diagnostic performance to differentiate these entities, we used a combination of findings as well as individual findings. If at least 1 of these 4 CT findings was not detected, the possibility of acute cholecystitis was quite low due to high sensitivity and NPV. This is consistent with an earlier study, which showed that CT was more sensitive than ultrasonography for the diagnosis of acute cholecystitis if any of the typical CT findings were considered as acute cholecystitis.[25] A combination of 2 or 3 of the 4 CT findings could provide diagnosis and differentiation of acute cholecystitis from chronic cholecystitis with appropriate confidence.
Our study had several limitations. First, this is a retrospective study. Although we recruited consecutive patients, there was an unavoidable selection bias. In addition, we did not calculate the interobserver agreement of CT evaluation. However, the CT findings of cholecystitis are well known, and the difference of interpretation between radiologists is not expected to be significant. Second, the inclusion of only patients who had pathologic results from cholecystectomy may have resulted in the exclusion of severe complicated cases or clinically severely ill patients who underwent only interventional procedures such as percutaneous drainage. Third, our data included acute cholecystitis complicated by gangrene, which might display specific findings such as lack of gallbladder wall enhancement, intraluminal membrane, and pericholecystic abscess. As gangrenous cholecystitis is a form of acute cholecystitis, exclusion of these cases was not appropriate for practical circumstances, and the relatively large population of the present study might have led to the significance of study results.
In conclusion, increased adjacent liver enhancement, increased gallbladder dimension, increased wall thickening or mural striation, and pericholecystic fat haziness or fluid are the most discriminative MDCT findings of acute cholecystitis. As the clinical and radiological findings of acute cholecystitis and chronic cholecystitis overlap, the combination of 2 or 3 of the 4 CT findings can provide efficient performance for the diagnosis and differentiation of acute from chronic cholecystitis.
Author contributions
Conceptualization: Dong Myung Yeo.
Data curation: Dong Myung Yeo.
Formal analysis: Dong Myung Yeo.
Supervision: Seung Eun Jung.
Writing – original draft: Dong Myung Yeo.
Writing – review & editing: Dong Myung Yeo, Seung Eun Jung.
Footnotes
Abbreviations: HU = Hounsfield unit, MDCT = multidetector computed tomography, MRI = magnetic resonance imaging, NPV = negative predictive value, OR = odds ratio, PPV = positive predictive value, ROC = receiver operating characteristic, RUQ = right upper quadrant, THAD = transient hepatic attenuation difference, US = ultrasonography.
The authors of this work have nothing to disclose.
The authors have declared that they have no conflict of interest.
References
- [1].Hanbidge AE, Buckler PM, O’Malley ME, et al. From the RSNA refresher courses: imaging evaluation for acute pain in the right upper quadrant. Radiographics 2004;24:1117–35. [DOI] [PubMed] [Google Scholar]
- [2].Kim SW, Kim HC, Yang DM, et al. Cystic duct enhancement: a useful CT finding in the diagnosis of acute cholecystitis without visible impacted gallstones. AJR Am J Roentgenol 2015;205:991–8. [DOI] [PubMed] [Google Scholar]
- [3].Laing FC, Federle MP, Jeffrey RB, et al. Ultrasonic evaluation of patients with acute right upper quadrant pain. Radiology 1981;140:449–55. [DOI] [PubMed] [Google Scholar]
- [4].Kiewiet JJ, Leeuwenburgh MM, Bipat S, et al. A systematic review and meta-analysis of diagnostic performance of imaging in acute cholecystitis. Radiology 2012;264:708–20. [DOI] [PubMed] [Google Scholar]
- [5].Kaura SH, Haghighi M, Matza BW, et al. Comparison of CT and MRI findings in the differentiation of acute from chronic cholecystitis. Clin Imaging 2013;37:687–91. [DOI] [PubMed] [Google Scholar]
- [6].Blankenberg F, Wirth R, Jeffrey RB, Jr, et al. Computed tomography as an adjunct to ultrasound in the diagnosis of acute acalculous cholecystitis. Gastrointest Radiol 1991;16:149–53. [DOI] [PubMed] [Google Scholar]
- [7].Fidler J, Paulson EK, Layfield L. CT evaluation of acute cholecystitis: findings and usefulness in diagnosis. AJR Am J Roentgenol 1996;166:1085–8. [DOI] [PubMed] [Google Scholar]
- [8].Mirvis SE, Vainright JR, Nelson AW, et al. The diagnosis of acute acalculous cholecystitis: a comparison of sonography, scintigraphy, and CT. AJR Am J Roentgenol 1986;147:1171–5. [DOI] [PubMed] [Google Scholar]
- [9].Bennett GL, Rusinek H, Lisi V, et al. CT findings in acute gangrenous cholecystitis. AJR Am J Roentgenol 2002;178:275–81. [DOI] [PubMed] [Google Scholar]
- [10].Soyer P, Hoeffel C, Dohan A, et al. Acute cholecystitis: quantitative and qualitative evaluation with 64-section helical CT. Acta Radiol 2013;54:477–86. [DOI] [PubMed] [Google Scholar]
- [11].Altun E, Semelka RC, Elias J, Jr, et al. Acute cholecystitis: MR findings and differentiation from chronic cholecystitis. Radiology 2007;244:174–83. [DOI] [PubMed] [Google Scholar]
- [12].Smith EA, Dillman JR, Elsayes KM, et al. Cross-sectional imaging of acute and chronic gallbladder inflammatory disease. AJR Am J Roentgenol 2009;192:188–96. [DOI] [PubMed] [Google Scholar]
- [13].Shakespear JS, Shaaban AM, Rezvani M. CT findings of acute cholecystitis and its complications. AJR Am J Roentgenol 2010;194:1523–9. [DOI] [PubMed] [Google Scholar]
- [14].Brook OR, Kane RA, Tyagi G, et al. Lessons learned from quality assurance: errors in the diagnosis of acute cholecystitis on ultrasound and CT. AJR Am J Roentgenol 2011;196:597–604. [DOI] [PubMed] [Google Scholar]
- [15].Kim YK, Kwak HS, Kim CS, et al. CT findings of mild forms or early manifestations of acute cholecystitis. Clin Imaging 2009;33:274–80. [DOI] [PubMed] [Google Scholar]
- [16].Kimura Y, Takada T, Kawarada Y, et al. Definitions, pathophysiology, and epidemiology of acute cholangitis and cholecystitis: Tokyo Guidelines. J Hepatobiliary Pancreat Surg 2007;14:15–26. [DOI] [PMC free article] [PubMed] [Google Scholar]
- [17].Gabata T, Matsui O, Kadoya M, et al. Aberrant gastric venous drainage in a focal spared area of segment IV in fatty liver: demonstration with color Doppler sonography. Radiology 1997;203:461–3. [DOI] [PubMed] [Google Scholar]
- [18].R Foundation for Statistical Computing. RCT. R: A Language and Environment for Statistical Computing. Vienna, Austria: R Foundation for Statistical Computing; 2014. Available at: http://www.R-project.org/. [Google Scholar]
- [19].Moon K-W. R statistics and graphs for medical papers. Seoul: Hannaare; 2015. [Google Scholar]
- [20].Robin X, Turck N, Hainard A, et al. pROC: an open-source package for R and S+ to analyze and compare ROC curves. BMC Bioinform 2011;12:77. [DOI] [PMC free article] [PubMed] [Google Scholar]
- [21].Quiroga S, Sebastia C, Pallisa E, et al. Improved diagnosis of hepatic perfusion disorders: value of hepatic arterial phase imaging during helical CT. Radiographics 2001;21:65–81. questionnaire 288-294. [DOI] [PubMed] [Google Scholar]
- [22].Colagrande S, Centi N, Galdiero R, et al. Transient hepatic intensity differences: part 2, Those not associated with focal lesions. AJR Am J Roentgenol 2007;188:160–6. [DOI] [PubMed] [Google Scholar]
- [23].Harvey RT, Miller WT., Jr Acute biliary disease: initial CT and follow-up US versus initial US and follow-up CT. Radiology 1999;213:831–6. [DOI] [PubMed] [Google Scholar]
- [24].Jung SE, Lee JM, Lee K, et al. Gallbladder wall thickening: MR imaging and pathologic correlation with emphasis on layered pattern. Eur Radiol 2005;15:694–701. [DOI] [PubMed] [Google Scholar]
- [25].Fagenholz PJ, Fuentes E, Kaafarani H, et al. Computed tomography is more sensitive than ultrasound for the diagnosis of acute cholecystitis. Surg Infect (Larchmt) 2015;16:509–12. [DOI] [PubMed] [Google Scholar]


