Abstract
Identification of meaningful cluster modules of differential genes or representative biomarkers related to the stages of ovarian cancer (OC) is pivotal, which may help to detect mechanisms of OC progression and evaluate OC patients’ prognosis.
We downloaded gene expression data and the corresponding clinical information of OC patients from The Cancer Genome Atlas (TCGA) database, which included 379 ovarian cancer patients. Differentially expressed genes (DEGs) of OC patients between stages were picked out using R. There were 731 differential genes between ovarian cancer stage II and stage III (DEGs II-III) and 563 differential genes between ovarian cancer stage III and stage IV (DEGs III-IV), then we performed GO analysis and Kyoto Encyclopedia of Gene and Genome (KEGG) pathway analysis using Database for Annotation, Visualization and Integrated Discovery (DAVID). Moreover, CytoHubba was used to detect the top 20 hub genes in DEGs II-III and DEGs III-IV, followed Cytoscape with search tool for the retrieval of interacting genes (STRING) and MCODE plug-in was utilized to construct protein-protein interaction (PPI) modules of these genes. Three important coexpression modules of DEGs II-III and 3 more meaningful modules of DEGs III-IV were detected from PPI network using molecular complex detection (MCODE) tool. In addition, 5 hub genes in these stage-related DEGs modules with worse overall survival were selected, including COL3A1, COL1A1, COL1A2, KRAS, NRAS. This bioinformatics analysis demonstrated that stage-related prognostic DEGs, such as COL3A1, COL1A1, COL1A2, KRAS, and NRAS might play an unfavorable role in the development as well as metastasis of ovarian cancer. Furthermore, they need to be experimentally verified as a new biomarker to predict OC patient prognosis.
Keywords: differential genes, ovarian cancer, overall survival, prognosis
1. Introduction
Ovarian cancer (OC) is the most lethal gynecological cancer and the fifth most common cause of cancer-related death among women in the United States.[1] Due to latent symptoms and lack of reliable early screening means, most OC patients are diagnosed at an advanced stage (stage III–IV; International Federation of Gynecology and Obstetrics, FIGO).[2] Early detection and diagnosis of OC remain the main target for successful treatment. For advanced-stage OC are much more likely to have a poor prognosis, exploring gene expression characteristics related to OC stage is critical.
Currently, the only biomarker that is widely used in clinical practice is cancer antigen 125 (CA125).[3] This high MW glycoprotein CA125 is elevated in 90% of patients with advanced stage disease. However, a number of false positive results could also occur since levels of CA125 could naturally be elevated during ovulation and may also be elevated due to a range of benign gynecologic causes such as fibroids, endometriosis, and pelvic inflammatory disease among others. CA125 can also be elevated in a variety of cancers other than ovarian such as pancreatic, lung, and breast cancer.[4,5] In addition to CA125, other biomarkers are used routinely in medical practice and these include CA 19-9, CA 15-3, CA 72-4, and CEA. CA 19-9 has the advantage of high sensitivity for mucinous ovarian cancers that fail to express CA125.[6] Serum levels of CA 19-9 are elevated in 68% to 83% of mucinous ovarian cancers but in only 28% to 29% of nonmucinous types. CA 15–3, CA 72–4, and CEA levels are found to be elevated in 50% to 56%, 63% to 71%, and 25% to 50% of patients with ovarian cancer.[7,8] However, serial measurement of these tumor markers still plays a vital role in the management of patients with a CA125 negative tumor.[6] Panels of biomarkers are thought to offer the potential for higher discriminatory power. Recent studies that constructed putative biomarker panels with samples from the prostate, lung, colorectal, and ovarian (PLCO) cancer trial found no improvement in diagnostic power in preclinical samples.[9,10] Therefore, researchers still try hard to discover new biomarker to assist diagnose ovarian cancer earlier and can accurately predict the patients’ prognosis.
High-throughput sequencing is increasingly used and it has been used as a very significant tool for life sciences, such as cancer early diagnosis, cancer stage, and prognosis prediction.[11] In this analysis, we downloaded data from TCGA database and used Edger R package to detect the stage-related differentially expressed genes (DEGs). Followed by, we selected the top 20 hub genes in the 2 groups of DEGs and established PPI network of the stage-related DEGs modules. Moreover, analysis of biological process (BP), molecular function (MF), cellular component (CC), and KEGG pathways of the DEGs and 6 meaningful coexpression modules significantly related to tumor stage were performed. Finally, overall survival (OS) analysis of these genes in the 6 modules was conducted using the Kaplan–Meier plotter online database (http://kmplot.com/analysis/). Then, COL3A1, COL1A1, COL1A2, KRAS, and NRAS were selected as the prognostic genes that could be used as a new potential biomarker for diagnosis and to predict the prognosis of OC patients.
2. Materials and methods
2.1. Microarray data
Gene expression data of OC patients were downloaded from TCGA database (The Cancer Genome Atlas, http://cancergenome.nih.gov/. The National Cancer Institute and National Human Genome Research Institute work with physicians who collect tissue for TCGA to gain approval with local Institutional Review Boards (IRBs). An IRB is a group of scientists, doctors, clergy, and consumers who review and approve the research proposal for every research project that involves human subjects. These boards ensure that the research is well designed, legal and ethical, and does not involve unnecessary risks to patients.). Meanwhile, the relevant clinical information was also obtained. We download 379 tumor samples of stage II to stage IV. The data is level 3 data which has been normalized.
2.2. Screening of stage-related DEGs and hub genes
We use R Language (Edger R package) to screen the differential genes between ovarian cancer stage II and stage III, and next obtained the DEGs between stage III and stage IV. The adjusted P value < .05 and FDR < .05 were set as the cut-off criterion. Then, 731DEGs II-III and 563DEGs III-IV were detected. CytoHubba is a tool that provides 11 topological analysis methods including Degree, Edge Percolated Component, Maximum Neighborhood Component, Density of Maximum Neighborhood Component, Maximal Clique Centrality, and 6 centralities (Bottleneck, EcCentricity, Closeness, Radiality, Betweenness, and Stress) based on shortest paths to detect the hub genes. Therefore, the top 20 DEGs II-III hub genes and the top 20 DEGs III-IV hub genes were screened by the cytoHubba according to the high degree of connectivity, then we selected these DEGs and hub genes between stages for the further analysis.
2.3. Functional and pathway enrichment analysis of DEGs
DAVID is the Database for Annotation, Visualization and Integrated Discovery (https://david.ncifcrf.gov/) which aims to provide online bioinformatics tools for the functional interpretation of lists of genes or proteins.[12] We could visualize the main pathways and biological processes, molecular functions, cellular components among those DEGs through DAVID.
2.4. PPI network, module analysis, and hub genes
Search Tool for the Retrieval of Interacting Genes (STRING, https://string-db.org) is an online tool designed to evaluate the protein–protein interaction (PPI) information.[13] To look for the potential interaction among those DEGs, we used STRING and input those DEGs into STRING, set confidence score ≥ 0.4, the maximum number of interactors = 0 as the cut-off criterion. Then we used the MCOED to construct 6 correlation modules. The pathway analysis of genes in each module was performed using DAVID. Also, some of the top 20 DEGs II-III hub genes and the top 20 DEGs III-IV hub genes which were screened by the cytoHubba according to the high degree of connectivity were found in these modules.[14]
2.5. Survival analysis of hub genes in stage-related modules
The Kaplan–Meier plotter (http://kmplot.com/analysis/) is capable of assessing the effect of 54,675 genes on survival using 10,461 cancer samples. These include 5143 breast, 1816 ovarian, 2437 lung, and 1065 gastric cancer patients with a mean follow-up of 69/ 40/ 49/ 33 months. The primary purpose of the tool is a meta-analysis-based biomarker assessment.[15] We used this online tool to plot the OS of the hub genes in the stage-related modules.
2.6. Visualization of the prognostic genes expression level
The Gene Expression Profiling Interactive Analysis (GEPIA, http://gepia.cancer-pku.cn/index.html) is an interactive web server for analyzing the RNA expression sequencing data of 9736 normal and 8587 tumors samples from the GTEx and TCGA the projects, based on a standard processing pipeline.[16] We displayed the expression level of prognostic genes among stages through the stage plot.
3. Results
3.1. Screening stage-related DEGs and the top 20 hub genes
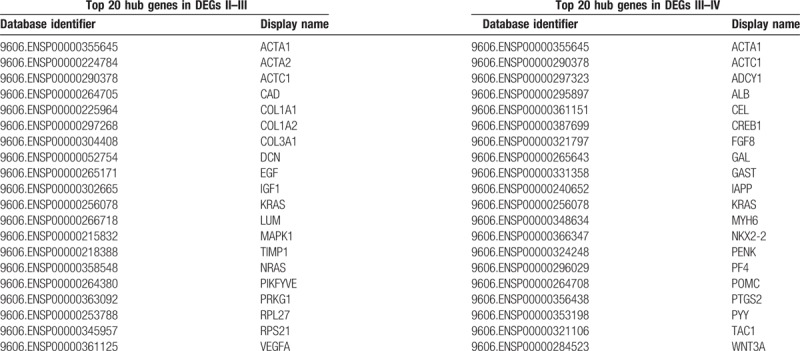
There were 379 ovarian cancer samples obtained from TCGA in this study. We aimed to obtain the differential genes between stages and found the prognostic genes for ovarian cancer. The R analysis (Edger R package) was applied to detect the DEGs between stage II and stage III, stage III and stage IV, using adjusted P value < .05 and FDR < 0.05 as cut-off criteria. Finally, 731 DEGs II-III that include 328 upregulated and 403 dysregulated genes and 563DEGs III-IV that include 222 upregulated and 341 dysregulated genes were found. Meanwhile, there are 62 overlap genes between DEGs II-III and DEG III-IV. Moreover, the top 20 DEGs II-III hub genes and the top 20 DEGs III-IV hub genes were screened by the cytoHubba according to the high degree of connectivity (Table 1). We selected these DEGs and hub genes between stages for further analysis.
Table 1.
Top 20 hub genes in differential genes between stage II and stage III as well as top 20 hub genes in differential genes between stage III and stage IV.
3.2. GO function and KEGG pathway enrichment analysis
For a more profound exploring of the screened DEGs, we used DAVID tools to perform GO function and KEGG pathway enrichment analysis. Above all, we mapped 731 DEGs II-III and 563 DEGs III-IV to DAVID web server and conducted GO analysis, the results demonstrated the enriched KEGG pathway of the DEGs II-III and DEGs III-IV. The DEGs II-III were most significantly enriched in protein digestion and absorption, ribosome, melanoma, TGF-beta signaling pathway, vascular smooth muscle contraction, signaling pathways regulating pluripotency of stem cells, focal adhesion, platelet activation, malaria, oxytocin signaling pathway. The DEGs III-IV were mainly enriched in protein digestion and absorption, maturity onset diabetes of the young, ABC transporters, neuroactive ligand-receptor interaction, adrenergic signaling in cardiomyocytes, bile secretion, gap junction, nicotine addiction, pancreatic secretion, melanogenesis. In addition, the BP of DEGs II-III includes regulation of cell proliferation, tube development, homeostatic process, blood vessel development, response to estrogen stimulus, and cell–cell signaling. For MF, these genes were enriched in growth factor activity, carbohydrate binding, structural molecule activity, heparin binding, and cytokine activity. GO CC analysis also revealed that the DEGs II-III were significantly enriched in the extracellular region, extracellular region part, proteinaceous extracellular matrix, ribonucleoprotein complex, and cytoplasmic membrane-bounded vesicle (Fig. 1A). Meanwhile, the BP of DEGs III-IV includes chemical synaptic transmission, cell–cell signaling, positive regulation of cell proliferation, transmembrane transport, cell adhesion. For MF, these genes were enriched in sequence-specific DNA binding, structural constituent of cytoskeleton, heparin binding, transporter activity, and receptor binding. At last GO CC analysis also showed that the DEGs III-IV were significantly enriched in the extracellular space, proteinaceous extracellular matrix, extracellular region, anchored component of membrane (Fig. 1B).
Figure 1.
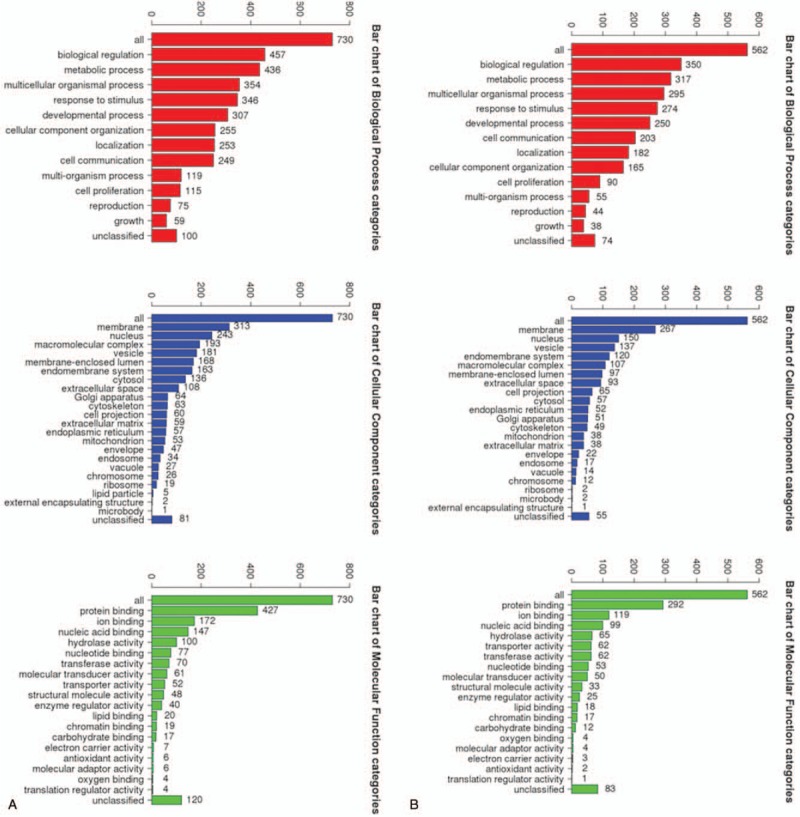
The BP, CC, MF of DEGs II––III (A), and DEGs III-IV (B). BP = biological process, CC = cellular component, MF = molecular function, DEGs II–III = differential genes between ovarian cancer stage II and stage III, DEGs III–IV = differential genes between ovarian cancer stage III and stage IV.
3.3. Construct stage-related EDGs modules from PPI co-expression network
We made the PPI network of these DEGs that based on the information in the STRING protein query from public databases. Aim to detect meaningful modules in this PPI coexpression network, we used MCODE plug-in. The modules of DEGs II-III and DEGs III-IV were conducted separately. KEGG pathway enrichment analysis demonstrated that these 3 DEGs II-III modules were mainly associated with RAS signaling pathway, MAPK signaling pathway, PI3K-Akt signaling pathway, and ECM-receptor interaction, focal adhesion (Fig. 2). Meanwhile, these 3 DEGs III-IV modules were mainly associated with neuroactive ligand-receptor interaction, pathways in cancer, retinol metabolism, WNT signaling pathway (Fig. 3).
Figure 2.
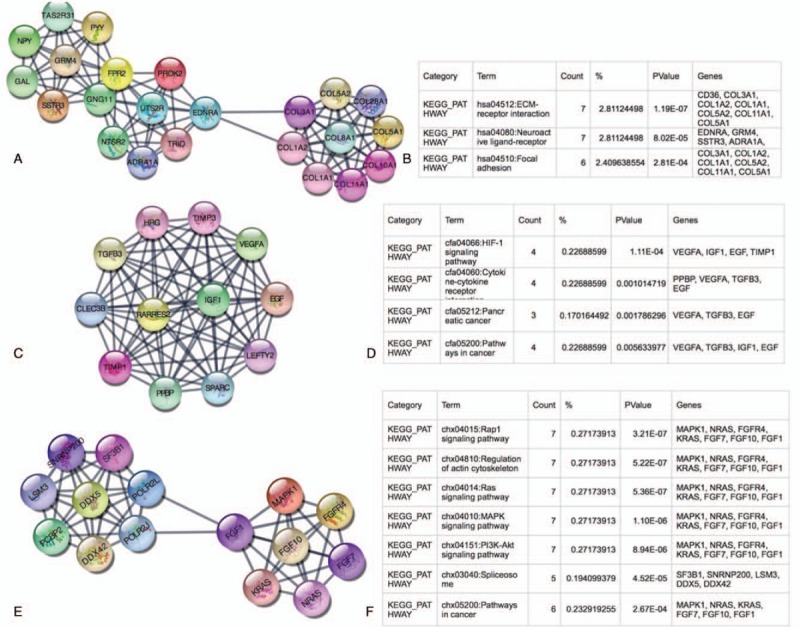
Top 3 modules from the DEGs II–III protein-protein interaction network and the enriched pathways of DEGs II–III modules. DEGs II–III = differential genes between ovarian cancer stage II and stage III, DEGs III–IV = differential genes between ovarian cancer stage III and stage IV.
Figure 3.
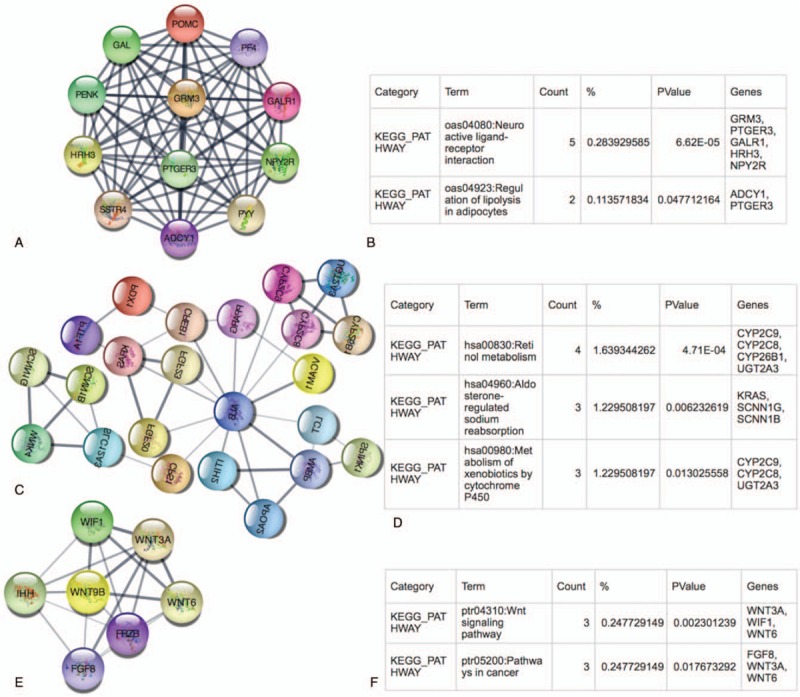
Top 3 modules from the DEGs III-IV protein-protein interaction network and the enriched pathways of DEGs III-IV modules. DEGs II–III = differential genes between ovarian cancer stage II and stage III, DEGs III–IV = differential genes between ovarian cancer stage III and stage IV.
3.4. The Kaplan–Meier plotter and expression level of prognostic genes
There are 10 hub genes in the 3 stage-related modules of DEGs II-III, they are COL1A1, COL1A2, COL3A1, EGF, IGF1, KRAS, MAPK1, NRAS, TIMP1, VEGFA. Besides, there are also 10 hub genes in the 3 stage-related DEGs III-IV modules, they are ADCY1, ALB, FGF8, GAL, KRAS, PENK, PF4, POMC, PYY, WNT3A. The prognostic information of the DEGs in these modules was obtained from Kaplan–Meier plotter software (http://kmplot.com/analysis/). It revealed that the expression of COL3A1 (HR 1.5 [1.3–1.72], P = 7.7 × 10⁻⁹) was associated with worse OS for ovarian cancer patients in these DEGs II-III module as well as COL1A2 (HR [1.39 1.21–1.6], P = 3.4 × 10⁻⁶), COL1A1 (HR [1.33 1.16–1.53], P = 5.8 × 10⁻⁵), KRAS (HR 1.18 [1.03–1.34], P = .014), NRAS (HR 1.49 [1.2–1.86] P = .00024). And in DEGs III-IV modules the expression of KARS (HR 1.18 [1.03–1.34], P = .014) was associated with worse OS (Fig. 4). Furthermore, we used GEPIA to detect the COL3A1, COL1A1, COL1A2, KRAS, NRAS expression level in different stages (Fig. 5).
Figure 4.
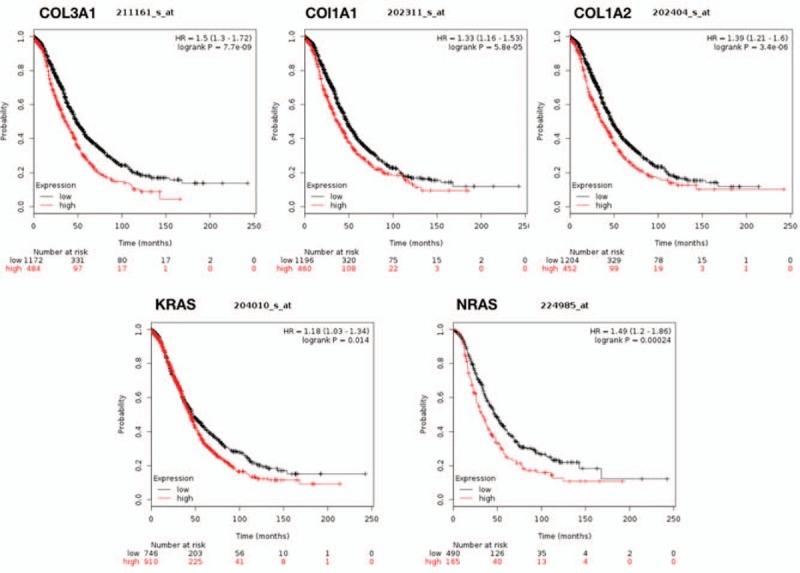
Prognostic value of 5 genes (COL3A1, COL1A2, COL1A1, KRAS, NRAS) in ovarian cancer patients. HR = hazard ratio, CI = confidence interval.
Figure 5.
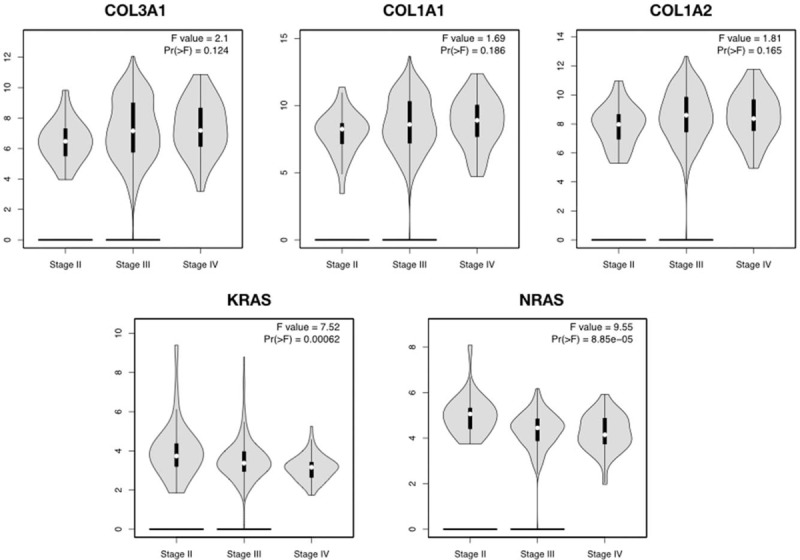
GEPIA database displayed that COL3A1, COL1A1, COL1A2, KRAS, NRAS had a strong correlation with the progression of OC based on TCGA data. GEPIA = gene expression profiling interactive analysis, OC = ovarian cancer.
4. Discussion
In this study, a total of 731 DEGs II-III and 563 DEGs III-IV were screened, then we conducted 3 DEGs II-III coexpression modules and 3 DEGs III-IV coexpression modules. The DEGs II-III modules were mainly associated with RAS signaling pathway, MAPK signaling pathway, PI3K-Akt signaling pathway, ECM-receptor interaction, and focal adhesion. These pathways might associate with the ovarian cancer progression to the advanced stage. Moreover, COL3A1, COL1A1, COL1A2, KRAS, NRAS were selected as the prognostic genes because they are differential genes between the early and advanced cancer stages and might play an unfavorable role in the development of even the metastasis of ovarian cancer. The DEGs III-IV modules were mainly associated with the neuroactive ligand-receptor interaction, pathways in cancer, retinol metabolism, and WNT signaling pathway, and these pathways might contribute to metastasis of ovarian cancer. All these pathways might function in the progression and metastasis of ovarian cancer. For KRAS is the differential gene in both DEGs II-III module and DEGs III-IV module, then we select it as a prognostic gene for its worse overall survival of ovarian cancer patients.
Analysis of the 3 selected DEGs II-III modules from the PPI network showed that advanced ovarian cancer was associated with focal adhesion, PI3K-Akt signaling pathway and ECM- receptor interaction, RAS signaling pathway, MAPK signaling pathway. COL1A1, COL1A2, COL3A1were enriched in focal adhesion (bta04510) and ECM-receptor interaction (bta04512) KEGG pathway. It has been shown that ECM containing a large amount of collagen increases the invasiveness and the progression of tumors.[17] It was reported that high expression of focal adhesion kinase activity was associated with elevated level of fibrosis and poor CD8+T cell infiltration. Focal adhesion kinase inhibition could substantially limit tumor progression and extend the survival time of cancer patients.[18] In contrast to normal tissues where collagen is organized as thin, long wavy fibrils parallel to the epithelial boundary, collagen fibrils in tumor stroma are thicker and shorter.[19] In epithelial ovarian cancer, collagen tracts that are perpendicular to the epithelial boundary have been observed.[20] Thus far, the expression of COL1A1 and COL1A2 has been noted in gastric cancer and was positively correlated with the degree of invasion, metastasis, and advanced stages.[21]COL3A1 is frequently in association with type III collagen.[22] In our study, COL3A1 is the differential stage-II-III hub gene and with the worst OS of OC. There was a study demonstrating that COL3A1 mRNA and protein was upregulated in CRC which was associated with clinicopathologic factors and poor survival, and COL3A1 was also increased in plasma of CRC patient. COL3A1 could be a potential diagnostic biomarker for colon cancer.[23] A report indicates that COL3A1 gene had a prognostic implication in brain tumor.[24] It also was associated with breast cancer development and progression.[25] Moreover, it has been suggested that progressive ovarian carcinoma can induce expression of type III procollagen both in the tumor tissue and peritoneal cavity. In addition, in poorly differentiated serous ovarian carcinoma, the formation of type III procollagen may occur in the neoplastic cells.[26] In serous ovarian carcinoma, production of type III procollagen has been found to be related to an increased degree of malignancy.[26]
KRAS, NRAS are predominantly expressed in various malignancies. RAS has 4 major isoforms, HRAS, NRAS and KRAS splice variants, KRas4A and KRas4B.[27,28] RAS protein family members (KRAS4A, KRAS4B, HRAS, and NRAS) function as GDP-GTP-regulated on-off switches, which regulate cytoplasmic-nuclear signaling networks ruling diverse normal cellular processes. Constitutive activating mutations in RAS genes are found in up to 30% of human cancers,[29] most frequently in KRAS (85%), then NRAS (15%), then HRAS (1%).[30] And remarkably, the oncogenic RAS mutations and mutations in other components of RAS/MAPK signaling pathways seem to be mutually exclusive in most tumors, pointing out that deregulation of RAS-dependent signaling is an essential requirement for tumorigenesis.[29] The mutations of 3 oncogenes KRAS and NRAS are very important in the development, spread, as well as in diagnostics and therapy of colorectal cancer and melanoma. In addition, KRAS and NRAS mutations are very well known to be mutated and play important role in pancreatic cancer, lung cancer, bladder cancer, and acute myeloid leukemia.[29] Mucinous ovarian cancer tumors have prevalent KRAS mutations. KRAS and NRAS mutations have been shown to have transforming activity, so it showed that these mutations are rare but important drivers in High grade serous ovarian cystadenocarcinoma (HGS-OvCa).[30]NRAS mutations are much rarer than KRAS, meta-analysis of colorectal cancer patients carrying NRAS mutations had shorter progression-free survival (HR 2.30; 95% CI 1.30–4.07) and shorter overall survival (HR 1.85;95% CI 1.23–2.78).[31] In RAS-driven cancers, KRas4B commanded most of the attention. Oncogenic mutants of KRas4B are abundant, particularly in adenocarcinomas, appearing in staggering frequencies, although KRas4A is currently also reappraised.[32–35] RAS-driven cancer cells predominantly proliferate by the combined action of 2 pathways: MAPK and PI3Kα/Akt.[36] Several studies indicated that numerous components of the phosphatidylinositol-3-kinase (PI3K)/AKT pathway were targeted by amplification, mutation, and translocation more frequently than any other pathway in cancer patients, leading to pathway activation.
In conclusion, our bioinformatics analysis detected stage-related DEGs and they might play a central role in the development and metastasis of ovarian cancer. In this study, a total of 1294 DEGs and 6 stage-related coexpression network modules were selected, and COL3A1, COL1A1, COL1A2, KRAS, and NRAS might be the prognostic genes of ovarian cancer. To get more accurate correlation results, we need to make a series of further verification experiments later to prove the results of this prediction.
Acknowledgments
The authors appreciate the researchers who provided their data and analyzed tools for this analysis, and thank Xu Wang for correcting the R code.
Author contributions
YY and LY conceived and designed the experiment. YY, LY, JJ, and LS analyzed data. LY wrote this manuscript. All authors reviewed and approved the final manuscript.
Conceptualization: Lili Yang, Ying Yue.
Data curation: Lili Yang, Liqun Sun.
Formal analysis: Lili Yang, Jili Jing, Liqun Sun.
Investigation: Jili Jing.
Methodology: Lili Yang, Jili Jing, Liqun Sun, Ying Yue.
Resources: Lili Yang.
Software: Lili Yang.
Supervision: Ying Yue.
Validation: Lili Yang, Ying Yue.
Visualization: Lili Yang, Jili Jing.
Writing – original draft: Lili Yang.
Writing – review & editing: Lili Yang, Jili Jing, Liqun Sun, Ying Yue.
Footnotes
Abbreviations: CA125 = cancer antigen 125, DAVID = Database for Annotation, Visualization and Integrated Discovery, DEGs = differentially expressed genes, DEGs II-III = differential genes between ovarian cancer stage II and stage III, DEGs III-IV = differential genes between ovarian cancer stage III and stage IV, FIGO = International Federation of Gynecology and Obstetrics, HGS-OvCa = high grade serous ovarian cystadenocarcinoma, KEGG = Kyoto Encyclopedia of Gene and Genome pathway, MCODE = molecular complex detection, OC = ovarian cancer, PPI = protein-protein interaction, STRING = search tool for the retrieval of interacting genes.
The authors have no conflicts of interest.
References
- [1].Siegel RL, Miller KD, Jemal A. Cancer statistics, 2015. CA Cancer J Clin 2015;65:5–29. [DOI] [PubMed] [Google Scholar]
- [2].Seidman JD, Horkayne-szakaly I, Haiba M, et al. The histologic type and stage distribution of ovarian carcinomas of surface epithelial origin. Int J Gynecol Pathol 2004;23:41–4. [DOI] [PubMed] [Google Scholar]
- [3].Skates SJ, Jacobs IJ, Knapp RC. Tumor Markers in Screening for Ovarian Cancer. In: Ovarian Cancer. Methods in Molecular MedicineTM. Humana Press; 2000:61–73. [DOI] [PubMed] [Google Scholar]
- [4].Gupta D, Lis CG. Role of CA125 in predicting ovarian cancer survival - a review of the epidemiological literature. J Ovarian Res 2009;2:13. [DOI] [PMC free article] [PubMed] [Google Scholar]
- [5].Helzlsouer KJ, Bush TL, Alberg AJ, et al. Prospective study of serum CA-125 Levels as markers of ovarian cancer. JAMA 1993;269:1123–6. [PubMed] [Google Scholar]
- [6].Gadducci A, Cosio S, Carpi A, et al. Serum tumor markers in the management of ovarian, endometrial and cervical cancer. Biomed Pharmacother 2004;58:24–38. [DOI] [PubMed] [Google Scholar]
- [7].Fioretti P, Gadducci A, Ferdeghini M, et al. The concomitant determination of different serum tumor markers in epithelial ovarian cancer: relevance for monitoring the response to chemotherapy and follow-up of patients. Gynecol Oncol 1992;44:155–60. [DOI] [PubMed] [Google Scholar]
- [8].Roman LD, Muderspach LI, Burnett AF, et al. Carcinoembryonic antigen in women with isolated pelvic masses. Clinical utility? J Reprod Med 1998;43:403–7. [PubMed] [Google Scholar]
- [9].Cramer DW, Bast RC, Berg CD, et al. Ovarian cancer biomarker performance in prostate, lung, colorectal, and ovarian cancer screening trial specimens. Cancer Prev Res (Phila) 2011;4:365–74. [DOI] [PMC free article] [PubMed] [Google Scholar]
- [10].Zhu CS, Pinsky PF, Cramer DW, et al. A Framework for evaluating biomarkers for early detection: validation of biomarker panels for ovarian cancer. Cancer Prev Res (Phila) 2011;4:375–83. [DOI] [PMC free article] [PubMed] [Google Scholar]
- [11].Kulasingam V, Diamandis EP. Strategies for discovering novel cancer biomarkers through utilization of emerging technologies. Nat Clin Pract Oncol 2008;5:588–99. [DOI] [PubMed] [Google Scholar]
- [12].Huang da W, Sherman BT, Lempicki RA. Bioinformatics enrichment tools: paths toward the comprehensive functional analysis of large gene lists. Nucleic Acids Res 2009;37:1–3. [DOI] [PMC free article] [PubMed] [Google Scholar]
- [13].Szklarczyk D, Franceschini A, Wyder S, et al. STRING v10: protein–protein interaction networks, integrated over the tree of life. Nucleic Acids Res 2015;43:D447–52. [DOI] [PMC free article] [PubMed] [Google Scholar]
- [14].Chin CH, Chen SH, Wu HH, et al. cytoHubba: identifying hub objects and sub-networks from complex interactome. BMC Syst Biol 2014;8:S11. [DOI] [PMC free article] [PubMed] [Google Scholar]
- [15].Lánczky A, Nagy Á, Bottai G, et al. miRpower: a web-tool to validate survival-associated miRNAs utilizing expression data from 2178 breast cancer patients. Breast Cancer Res Treat 2016;160:439–46. [DOI] [PubMed] [Google Scholar]
- [16].Tang Z, Li C, Kang B, et al. GEPIA: a web server for cancer and normal gene expression profiling and interactive analyses. Nucleic Acids Res 2017;45:W98–102. [DOI] [PMC free article] [PubMed] [Google Scholar]
- [17].Provenzano PP, Inman DR, Eliceiri KW, et al. Collagen density promotes mammary tumor initiation and progression. BMC Med 2008;6:11. [DOI] [PMC free article] [PubMed] [Google Scholar]
- [18].Jiang H, Hegde S, Knolhoff BL, et al. Targeting focal adhesion kinase renders pancreatic cancers responsive to checkpoint immunotherapy. Nat Med 2016;22:851–60. [DOI] [PMC free article] [PubMed] [Google Scholar]
- [19].Cho A, Howell VM, Colvin EK. The extracellular matrix in epithelial ovarian cancer—a piece of a puzzle. Front Oncol 2015;5: doi:10.3389/fonc.2015.00245. [DOI] [PMC free article] [PubMed] [Google Scholar]
- [20].Adur J, Pelegati VB, de Thomaz AA, et al. Second harmonic generation microscopy as a powerful diagnostic imaging modality for human ovarian cancer. J Biophotonics 2014;7:37–48. [DOI] [PubMed] [Google Scholar]
- [21].Yasui W, Oue N, Ito R, et al. Search for new biomarkers of gastric cancer through serial analysis of gene expression and its clinical implications. Cancer Sci 2004;95:385–92. [DOI] [PMC free article] [PubMed] [Google Scholar]
- [22].Superti-Furga A, Gugler E, Gitzelmann R, et al. Ehlers-Danlos syndrome type IV: a multi-exon deletion in one of the two COL3A1 alleles affecting structure, stability, and processing of type III procollagen. J Biol Chem 1988;263:6226–32. [PubMed] [Google Scholar]
- [23].Wang X-Q, Tang Z-X, Yu D, et al. Epithelial but not stromal expression of collagen alpha-1 (III) is a diagnostic and prognostic indicator of colorectal carcinoma. Oncotarget 2016;7:8823–38. [DOI] [PMC free article] [PubMed] [Google Scholar]
- [24].Hao JM, Chen JZ, Sui HM, et al. A five-gene signature as a potential predictor of metastasis and survival in colorectal cancer. J Pathol 2010;220:475–89. [DOI] [PubMed] [Google Scholar]
- [25].Xiong G, Deng L, Zhu J, et al. Prolyl-4-hydroxylase α subunit 2 promotes breast cancer progression and metastasis by regulating collagen deposition. BMC Cancer 2014;14:1. [DOI] [PMC free article] [PubMed] [Google Scholar]
- [26].Kauppila S, Saarela J, Stenbäck F, et al. Expression of mRNAs for type I and type III procollagens in serous ovarian cystadenomas and cystadenocarcinomas. Am J Pathol 1996;148:539–48. [PMC free article] [PubMed] [Google Scholar]
- [27].Zhou B, Der CJ, Cox AD. The role of wild type RAS isoforms in cancer. Semin Cell Dev Biol 2016;58:60–9. [DOI] [PMC free article] [PubMed] [Google Scholar]
- [28].Lu S, Jang H, Muratcioglu S, et al. Ras conformational ensembles, allostery, and signaling. Chem Rev 2016;116:6607–65. [DOI] [PubMed] [Google Scholar]
- [29].The RAS Initiative. National Cancer Institute. Available at: https://www.cancer.gov/research/key-initiatives/ras. Accessed March 1, 2018. [Google Scholar]
- [30].The Cancer Genome Atlas Research Network. Integrated genomic analyses of ovarian carcinoma. Nature 2011;474:609–15. [DOI] [PMC free article] [PubMed] [Google Scholar]
- [31].Heinimann K. Toward a molecular classification of colorectal cancer: the role of microsatellite instability status. Front Oncol 2013;3: doi:10.3389/fonc.2013.00272. [DOI] [PMC free article] [PubMed] [Google Scholar]
- [32].Tsai FD, Lopes MS, Zhou M, et al. K-Ras4A splice variant is widely expressed in cancer and uses a hybrid membrane-targeting motif. Proc Natl Acad Sci U S A 2015;112:779–84. [DOI] [PMC free article] [PubMed] [Google Scholar]
- [33].Chakrabarti M, Jang H, Nussinov R. Comparison of the conformations of KRAS isoforms, K-Ras4A and K-Ras4B, points to similarities and significant differences. J Phys Chem B 2016;120:667–79. [DOI] [PMC free article] [PubMed] [Google Scholar]
- [34].Nussinov R, Tsai CJ, Chakrabarti M, et al. A new view of ras isoforms in cancers. Cancer Res 2016;76:18–23. [DOI] [PMC free article] [PubMed] [Google Scholar]
- [35].Li ZL, Buck M. Computational modeling reveals that signaling lipids modulate the orientation of K-Ras4A at the membrane reflecting protein topology. Structure 2017;25:679–89. [DOI] [PMC free article] [PubMed] [Google Scholar]
- [36].Vivanco I, Sawyers CL. The phosphatidylinositol 3-Kinase–AKT pathway in human cancer. Nat Rev Cancer 2002;2:489–501. [DOI] [PubMed] [Google Scholar]


