Abstract
We sought to assess the use of an electro pulmonary nodule (EPN) scanner (FreshMedx, Salt Lake City, UT) in the noninvasive characterization of pulmonary nodules using transcutaneous bioconductance.
Monocentric prospective study including patients with a pulmonary nodule identified on a chest computed tomography scan. Study protocol approved by the institutional review board and written consent was obtained for every patient. 32 patients (12 females and 20 males), average age 65 years, and average lesion size 33.1 mm (range: 9–123 mm). Data collection by a trained physician, 62 skin surface measurements on the chest, arms, and hands bilaterally. Results were anonymized and mailed to a central data center for analysis and compared to histopathology.
Pathology results obtained by percutaneous biopsy (n = 14), surgical biopsy (n = 1), or surgical resection (n = 17) showed 29 malignant lesions (adenocarcinoma n = 21, squamous cell carcinoma n = 5, typical carcinoid n = 1, metastasis n = 2), and 3 benign lesions (necrotic granuloma n = 1, no malignant cells on biopsy n = 2). EPN scanner results had a specificity of 66.67% (95% confidence interval [CI] 0.09–0.99), sensitivity 72.41% (95% CI 0.53–0.87), positive predictive value 95.45% (95% CI 0.81–0.99), and a negative predictive value 20.00% (95% CI 0.08–0.40).
This pilot study showed a high positive predictive value of the EPN scanner, allowing aggressive management of lung nodules characterized as malignant. The low negative predictive value warrants further investigation of nodules that are characterized as benign.
Keywords: computed tomography, lung cancer, transcutaneous bioconductance
1. Introduction
In 2012, 14.1 million new cancer cases were diagnosed worldwide and 8.2 million people died from cancer. It is expected that by 2025, 19.3 million new cancer cases will be diagnosed each year, due partly to the aging population.[1]
Lung cancer is the most common cancer, accounting for 13% of all cancers diagnosed and affecting 1.8 million people worldwide. It is also the first cause of cancer death worldwide, 19% of all cancer deaths responsible for the death of 1.6 million people.[1] This highlights the importance of the early detection of lung cancer and has led to the development of various clinical screening trials including The National Lung Screening Trial (NLST) which was conducted to determine whether screening with low-dose computed tomography (CT) could reduce mortality from lung cancer. The trial enrolled over 50,000 people considered to be at high risk for lung cancer (between 55 and 75 years of age with a history of cigarette smoking of at least 30 pack-years).[2] The study concluded that the use of low-dose CT reduces the mortality from lung cancer by 20%.[2] Lung cancer screening is now a reality in the United States following the results of the NLST, the results of the trial were considered by the US Preventive Task Force who went on to recommend the implementation of lung cancer screening in a defined population. One of the challenges of this widespread screening are the number of false-positive lesions discovered, the NLST had a false-positive rate of 96.4% at baseline. This can lead to unnecessary and costly procedures with possible complications and underlines the importance of finding a noninvasive technique to stratify the risk of malignancy of a lung nodule identified on a chest CT scan. Several models have been developed that incorporate both clinical and radiologic criteria to aid in the discrimination of benign from malignant lesions.[3] One such model is the Brock model that takes into account patient sex, age, family history of lung cancer, emphysema, nodule type (solid, ground glass), nodule location, nodule count, and nodule spiculation.[4] This model was developed from participants enrolled in the Pan-Canadian Early Detection of Lung Cancer Study. The model estimates the probability that the nodule will be diagnosed as cancer within a 2- to 4-year follow-up.[4]
Another technique in risk stratification is the use of bioconductance which has been tested for various cancers. Electrical impedance is the ratio of the voltage difference to the current across a circuit and conductance is the inverse of impedance. The electrical properties of cancerous tissues have been shown to vary from those of normal tissues.[5–8] This has lead to the use of bioconductance which has been reported in the detection of various cancers including the thyroid, cervix, liver, and breast.[9–17] Transcutaneous bioconductance has more recently been evaluated in lung cancer as a technology that may allow risk stratification of suspicious pulmonary lesions.[18]
The purpose of this study was to further evaluate the performance of transcutaneous bioconductance in the characterization of lung nodules discovered on chest CT scans. Our hypothesis was that bioconductance would be different in benign and malignant nodules and that this could be used as a noninvasive method of characterization.
2. Methods and materials
2.1. Patients
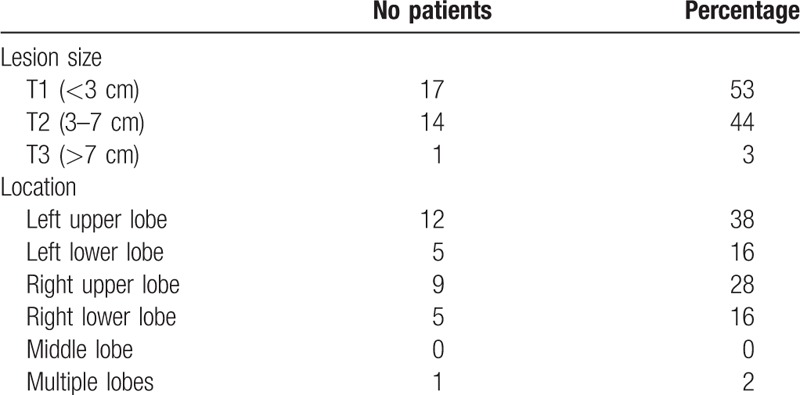
This prospective study was conducted at a single institution, Geneva University Hospitals, from 06/07/15 to 21/12/16 and included patients with a pulmonary nodule identified on a chest CT scan. Patients were enrolled under a study protocol approved by the institutional review board (CCER 15-112) and written consent was obtained for every patient. Thirty-two patients were included (12 females, 20 males) with an average age of 65 years (range 42–84). The average lesion size was of 33.1 mm, ranging from 9 to 123 mm. Patient demographics are shown in Table 1. Lesion size and location are shown in Table 2. Patients selected had a CT scan showing a lung nodule that was to be characterized by histopathology (after surgery or biopsy).
Table 1.
Patient demographics.
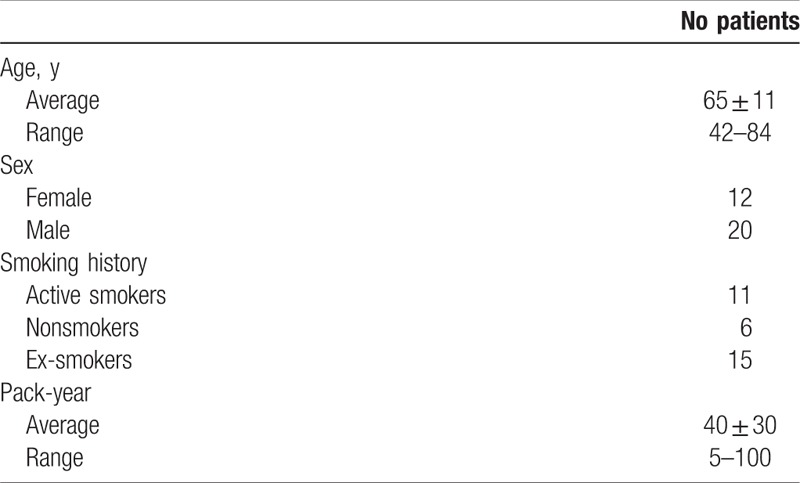
Table 2.
Lesion size and distribution.
2.2. Electro pulmonary nodule scan
Patients underwent a transcutaneous bioconductance scan with an electro pulmonary nodule (EPN) scanner. Data collection was performed by a trained physician. Sixty-two measurements were taken on the chest, arms, and hands bilaterally. The scan operator is guided by a computer screen which indicates the location of 6 reference electrodes that are placed on the patients back and hands and the position of 62 different points on the skin of the patient's hands, arms, and chest where measurements are performed with a probe. The quality of the measurements is checked in real time, each measurement can be repeated if deemed unsatisfactory. The entire scan takes between 20 and 30 minutes. Results are then recorded, anonymized, and mailed to a central data center for analysis. The result of each scan provides a score with a cutoff of 0.292 to distinguish between benign and malignant lesions. These results were compared to gold standard histopathologic examination, that were obtained by percutaneous biopsy (n = 14), surgical biopsy (n = 1), or surgical resection (n = 17). The EPN scanner was performed before histopathologic examination so the operator can be considered to be blinded.
2.3. Brock model
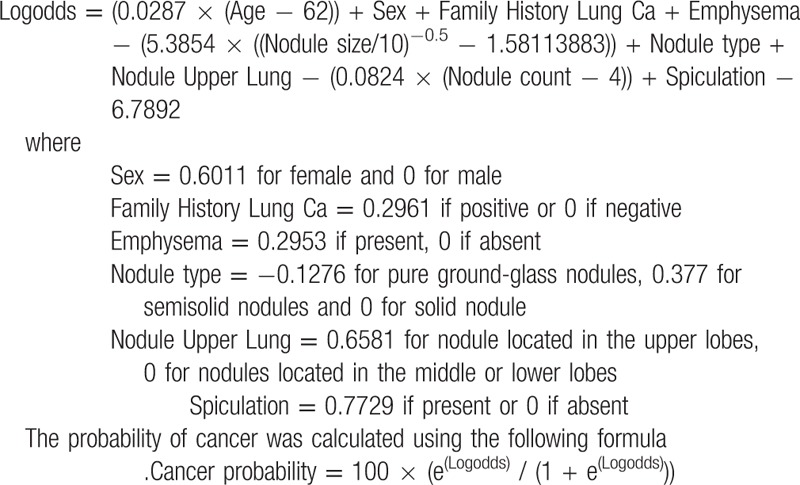
Each scan was reviewed by a radiologist with 8 years of experience and a probability of malignancy was calculated using the Brock model. As described in the Brock model, the following formulas were used:
2.4. Statistical analysis
The sensitivity (Se), specificity (Sp), positive predictive value (PPV), and negative predictive value (NPV) were calculated for the EPN scan using the cutoff of 0.292 suggested by the manufacturer, a value superior to this cutoff was considered a malignant diagnosis. Se, Sp, PPV, and NPV were not calculated for the Brock model as this varies according to the chosen threshold. Receiver operating characteristic (ROC) curves were generated by varying the positive threshold value and the area under the curve (AUC) were calculated for both models. Statistical analysis was performed with Prism (Prism, version 6b, 2012; GraphPad Software, San Diego, CA).
3. Results
Of the 32 patients, 14 underwent percutaneous biopsy, 1 underwent surgical biopsy, and 17 were treated with surgical resection. Pathology results showed 29 malignant lesions (adenocarcinoma n = 21, squamous cell carcinoma n = 5, typical carcinoid n = 1, metastasis n = 2), and 3 benign lesions (necrotic granuloma n = 1, no malignant cells on biopsy n = 2).
The EPN scanner results showed 21 true positives, 8 false negatives, 1 false positive, and 2 true negative. This corresponds to a Sp of 66.67% (95% confidence interval [CI] 0.09–0.99), a Se of 72.41% (95% CI 0.53–0.87), a PPV of 95.45% (95% CI 0.81–0.99), and a NPV of 20.00% (95% CI 0.08–0.40).
Of the true positive cases, average lesion size was of 34.2 mm, with a range from 9 to 123 mm. Concerning the false negatives, average lesion size was of 35 mm, with a range from 10 to 58 mm. The true negative cases measured 18 mm in average and the false positive case 19 mm.
The staging of the 26 primary lung malignant lesions (adenocarcinoma and squamous cell) was as follows: stage Ia n = 5, Ib n = 4, IIa n = 2, IIb n = 2, IIIa n = 4, IIIb n = 0, IV n = 9 according to the 7th edition of Lung Cancer Staging of the American Joint Committee on Cancer (Figs. 1 and 2).
Figure 1.
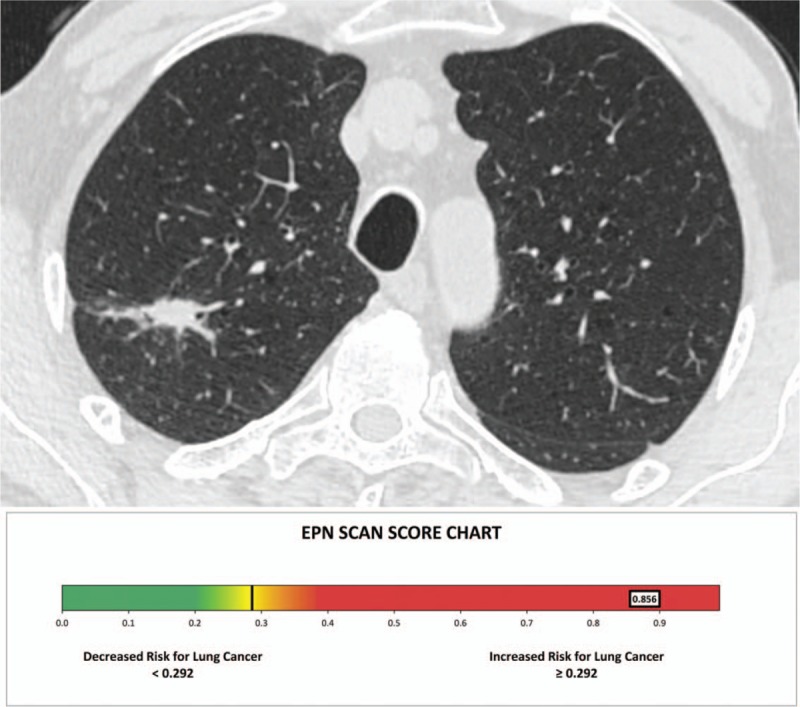
Chest computed tomography scan shows a right upper lobe nodule measuring 23 mm. The electro pulmonary nodule scan result was of 0.856 (malignant), and the patient underwent surgical resection of the nodule which confirmed an adenocarcinoma.
Figure 2.
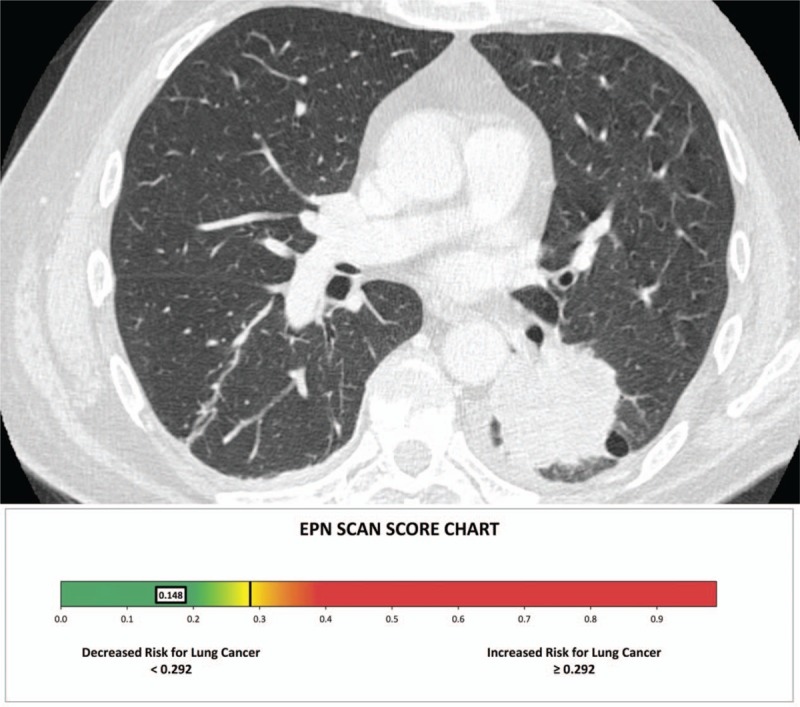
Chest computed tomography scan shows a left lower lobe mass measuring 50 mm. The electro pulmonary nodule scan result was of 0.148 (benign), the patient underwent surgical resection of the nodule which was adenocarcinoma.
ROC curves were obtained for both models and the AUC were of 0.79 for the Brock model and 0.76 for the EPN (Fig. 3). They were no statistical differences between the Brock model and the EPN (P = .75).
Figure 3.
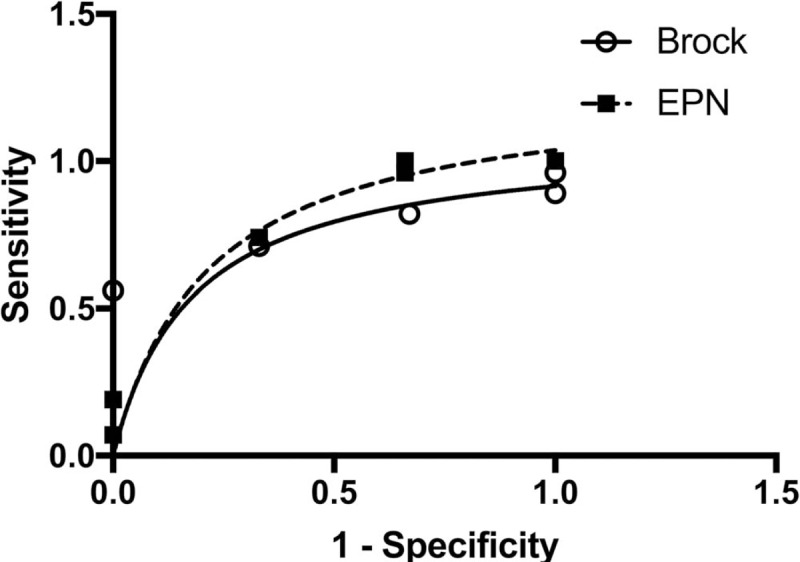
Receiver operating characteristic curves for the Brock model and electro pulmonary nodule. The curves were statistically identical (P = .75).
4. Discussion
The development of noninvasive techniques in the characterization of lung nodules is of high clinical interest. As previously stated, lung cancer is the most common type of cancer worldwide and the most deadly. Attempts to decrease mortality linked to this cancer have led to the development of screening programs.[19] Screening of high-risk patients has been shown to decrease mortality but an adverse and nonnegligible effect is that screening can lead to the identification of false positive lesions and consecutively to invasive procedures including percutaneous CT-guided biopsies, endoscopic biopsies, and video-assisted or open surgical biopsies. The development of a noninvasive tool as a means of characterizing lung nodules could therefore be integrated in a screening program if proven efficient. Different models incorporating both clinical and radiologic criteria have been proposed. In our study, we aimed to investigate another method, which is the use of bioconductance for the characterization of lung nodules. This was a pilot study performed with a sample population with a device that is currently investigational. A previous study conducted by Yung et al on the transcutaneous bioconductance measurement in lung cancer showed promising results of this technique.[18] The study included 41 patients with an outcome of 29 malignant and 12 benign diagnoses. For the 29 malignant cases, they were 26 true positives and 3 false negatives, resulting in a Se of 89.7% and a PPV of 96.3%. For the 12 benign cases, data resulted in 11 true negatives and 1 false positive, resulting in a Sp of 91.7% and a NPV of 78.5%.
In the present study, the average lesion size of the true positive cases was of 34.2 mm and the average lesion size of the false negative lesions was of 35 mm. These preliminary results suggest that the size of the lesion does not affect the results of the EPN scanner, as shown by Yung et al.[18]
We found that the Brock model and EPN performed similarly with an AUC of 0.79 and 0.76, respectively. However, studies have shown that predictive models are of limited value, especially for larger lung nodules.[18] Hammer et al[20] found the Brock model to be the most performant model; however even so, at its optimal threshold it had a positive predictive value of 81% and a negative predictive value of 53% in nodules over 8 mm in diameter.[18]
The current results of the EPN scan provide a binary response of risk assessment, further development and analysis of the current algorithms used after including larger patient groups may lead to the development of subgroups of cancer risk.[18]
4.1. Study limitations
The small size of the study population is a limitation in our study.
The proportion of malignant lesions characterized was much higher than those detected in screening programs such as the NLST with more advanced stage lung cancer representing a selection bias. This reflects the selection criteria used in the current study and must be taken into account when interpreting the results.
5. Conclusion
The use of bioconductance as a noninvasive tool to characterize lung nodules performed equally to best predictive tool we currently have (i.e., the Brock model).
The high positive predictive value of the EPN allows to aggressively manage lung nodules characterized as malignant; however, the low negative predictive value warrants further investigation of nodules that are characterized as benign.
Author contributions
Conceptualization: Joanna Gariani, Steve P Martin, Xavier Montet.
Data curation: Joanna Gariani, Steve P Martin.
Formal analysis: Joanna Gariani, Steve P Martin, Xavier Montet.
Funding acquisition: Christoph D Becker, Xavier Montet.
Investigation: Joanna Gariani, Steve P Martin, Xavier Montet.
Methodology: Joanna Gariani, Steve P Martin, Wolfram Karenovics, Dan Adler, Christoph D Becker, Xavier Montet.
Project administration: Joanna Gariani, Steve P Martin.
Resources: Wolfram Karenovics.
Supervision: Wolfram Karenovics, Dan Adler, Paola M Soccal, Christoph D Becker, Xavier Montet.
Validation: Joanna Gariani, Steve P Martin, Xavier Montet.
Writing – original draft: Joanna Gariani.
Writing – review & editing: Joanna Gariani, Steve P Martin, Anne-Lise Hachulla, Wolfram Karenovics, Dan Adler, Paola M Soccal, Christoph D Becker, Xavier Montet.
Footnotes
Abbreviations: AUC = area under the curve, CI = confidence interval, CT = computed tomography, EPN = electro pulmonary nodule, NPV = negative predictive value, PPV = positive predictive value, ROC = receiver operating characteristic, Sn = sensitivity, Sp = specificity.
The authors have no funding and conflicts of interest to disclose.
References
- [1].Centers for Disease Control and Prevention: http://www.cdc.gov/cancer/international/statistics.htm. [Google Scholar]
- [2].Aberle DR, Adams AM, et al. National Lung Screening Trial Research Team. Reduced lung-cancer mortality with low-dose computed tomographic screening. N Engl J Med 2011;365:395–409. [DOI] [PMC free article] [PubMed] [Google Scholar]
- [3].Bartholmai BJ, Koo CW, Johnson GB, et al. Pulmonary nodule characterization, including computer analysis and quantitative features. J Thorac Imaging 2015;30:139–56. [DOI] [PubMed] [Google Scholar]
- [4].Tammemagi MC, Schmidt H, Martel S, et al. Participant selection for lung cancer screening by risk modelling (the Pan-Canadian Early Detection of Lung Cancer [PanCan] study): a single-arm, prospective study. Lancet Oncol 2017;18:1523–31. [DOI] [PubMed] [Google Scholar]
- [5].Blad B, Baldetorp B. Impedance spectra of tumour tissue in comparison with normal tissue; a possible clinical application for electrical impedance tomography. Physiol Meas 1996;17(Suppl 4A):A105–15. [DOI] [PubMed] [Google Scholar]
- [6].Morimoto T, Kimura S, Konishi Y, et al. A study of the electrical bio-impedance of tumors. J Invest Surg 1993;6:25–32. [DOI] [PubMed] [Google Scholar]
- [7].Weitzen R, Epstein N, Shoenfeld Y, et al. Diagnosing diseases by measurement of electrical skin impedance: a novel technique. Ann N Y Acad Sci 2007;1109:185–92. [DOI] [PubMed] [Google Scholar]
- [8].Scholz B, Anderson R. On electrical impedance scanning – principles and simulations. Electromedica 68 – onco 2000. [Google Scholar]
- [9].Brown BH, Milnes P, Abdul S, et al. Detection of cervical intraepithelial neoplasia using impedance spectroscopy: a prospective study. BJOG 2005;112:802–6. [DOI] [PubMed] [Google Scholar]
- [10].Lurie Y, Landau DA, Kanevsky A, et al. Medex test, a novel modality for liver disease diagnosis: a pilot study. J Clin Gastroenterol 2007;41:700–5. [DOI] [PubMed] [Google Scholar]
- [11].Abdul S, Brown BH, Milnes P, et al. The use of electrical impedance spectroscopy in the detection of cervical intraepithelial neoplasia. Int J Gynecol Cancer 2006;16:1823–32. [DOI] [PubMed] [Google Scholar]
- [12].Stojadinovic A, Fields SI, Shriver CD, et al. Electrical impedance scanning of thyroid nodules before thyroid surgery: a prospective study. Ann Surg Oncol 2005;12:152–60. [DOI] [PubMed] [Google Scholar]
- [13].Jossinet J. The impedivity of freshly excised human breast tissue. Physiol Meas 1998;19:61–75. [DOI] [PubMed] [Google Scholar]
- [14].Malich A, Bohm T, Facius M, et al. Additional value of electrical impedance scanning: experience of 240 histologically-proven breast lesions. Eur J Cancer 2001;37:2324–30. [DOI] [PubMed] [Google Scholar]
- [15].Stojadinovic A, Nissan A, Gallimidi Z, et al. Electrical impedance scanning for the early detection of breast cancer in young women: preliminary results of a multicenter prospective clinical trial. J Clin Oncol 2005;23:2703–15. [DOI] [PubMed] [Google Scholar]
- [16].Stojadinovic A, Nissan A, Shriver CD, et al. Electrical impedance scanning as a new breast cancer risk stratification tool for young women. J Surg Oncol 2008;97:112–20. [DOI] [PubMed] [Google Scholar]
- [17].Zheng B, Lederman D, Sumkin JH, et al. A preliminary evaluation of multi-probe resonance-frequency electrical impedance based measurements of the breast. Acad Radiol 2011;18:220–9. [DOI] [PMC free article] [PubMed] [Google Scholar]
- [18].Yung RC, Zeng MY, Stoddard GJ, et al. Transcutaneous computed bioconductance measurement in lung cancer: a treatment enabling technology useful for adjunctive risk stratification in the evaluation of suspicious pulmonary lesions. J Thorac Oncol 2012;7:681–9. [DOI] [PubMed] [Google Scholar]
- [19].Wille MM, Dirksen A, Ashraf H, et al. Results of the randomized danish lung cancer screening trial with focus on high-risk profiling. Am J Respir Crit Care Med 2016;193:542–51. [DOI] [PubMed] [Google Scholar]
- [20].Hammer MM, Nachiappan AC, Barbosa EJM., Jr Limited utility of pulmonary nodule risk calculators for managing large nodules. Curr Probl Diagn Radiol 2018;1:23–7. [DOI] [PubMed] [Google Scholar]


