

Abstract
Malaria parasites export many proteins into their host erythrocytes and increase membrane permeability to diverse solutes. While most solutes use a broad-selectivity channel known as the plasmodial surface anion channel (PSAC), increased Ca++ uptake is mediated by a distinct, poorly characterized mechanism that appears to be essential for the intracellular parasite. Here, we examined infected cell Ca++ uptake with a kinetic fluorescence assay and the virulent human pathogen, P. falciparum. Cell surface labeling with N-hydroxysulfosuccinimide esters revealed differing effects on transport into infected and uninfected cells, indicating that Ca++ uptake at the infected cell surface is mediated by new or altered proteins at the host membrane. Conditional knockdown of PTEX, a translocon for export of parasite proteins into the host cell, significantly reduced infected cell Ca++ permeability, suggesting involvement of parasite-encoded proteins trafficked to the host membrane. A high-throughput chemical screen identified the first Ca++ transport inhibitors active against Plasmodium-infected cells. These novel chemical scaffolds inhibit both uptake and parasite growth; improved in vitro potency at reduced free [Ca++] is consistent with parasite-killing specifically via action on one or more Ca++ transporters. These inhibitors should provide mechanistic insights into malaria parasite Ca++ transport and may be starting points for new antimalarial drugs.
1 INTRODUCTION
Malaria is an important infectious disease that continues to cause significant morbidity, mortality and economic loss worldwide; human disease is caused by 5 Plasmodium species, with P. falciparum being the most virulent. This pathogen’s success is associated with intracellular development in erythrocytes to evade host immune responses. To facilitate intracellular growth, P. falciparum remodels the host cell by exporting many proteins, generating a network of membranes within the host cytosol, altering deformability, and increasing erythrocyte membrane permeability to uncharged and charged organic solutes as well as some inorganic ions (Maier et al., 2009; Tilley et al., 2008; Desai, 2014).
Amongst inorganic ions with increased permeability, Ca++ uptake may be the most critical for intracellular parasite development. Eukaryotic cells depend on transient changes in intracellular Ca++ and mediator proteins such as calmodulin and Ca++-dependent kinases to signal cell cycle progression, DNA replication, and cytokinesis (Takuwa et al., 1995). The malaria parasite also appears to depend on Ca++ signaling because the Ca++ chelator EGTA inhibits intracellular development and propagation of cultures (Wasserman et al., 1982; Zipprer et al., 2014); nonspecific EGTA toxicity can be excluded as growth is restored by stoichiometric addition of Ca++ with the chelator. Consistent with this, several studies have reported that the Ca++ content of infected erythrocytes increases with intracellular parasite maturation (Tanabe et al., 1982; Kramer and Ginsburg, 1991; Rohrbach et al., 2005), though the precise free and bound Ca++ levels in host and parasite compartments have proven difficult to measure without perturbation. The parasite also expresses multiple Ca++ effector proteins such as calmodulin, Ca++-dependent protein kinases, phosphatases such as calcineurin, and other Ca++-binding proteins (Brochet and Billker, 2016). Moreover, one or more parasite organelles may function as Ca++ stores (Garcia et al., 1998; Budu et al., 2016). Ca++ signaling appears to be critical for not only intracellular parasite development, but also for egress from the host cell and subsequent reinvasion to initiate a new intracellular cycle (Glushakova et al., 2013; Garg et al., 2013; Weiss et al., 2015).
Despite these critical roles, Ca++ transport mechanisms in infected erythrocytes remain poorly characterized. At the host cell membrane, the increased uptake of most solutes is attributed to a parasite-derived channel known as the plasmodial surface anion channel (PSAC) (Desai et al., 2005; Nguitragool et al., 2011), but pharmacological studies suggest that the increased host cell permeability to Ca++ is mediated by a distinct mechanism (Zipprer et al., 2014). Several factors have hindered a clear understanding of the parasite-induced Ca++ uptake mechanism. First, Ca++ is effectively extruded from erythrocytes by an efficient Ca++ ATPase pump (Stauffer et al., 1995). Because specific and potent inhibitors of this extrusion pump are unavailable, erythrocytes must be treated with nonspecific agents such as iodoacetamide and vanadate to inhibit the pump and allow quantification of uptake (Desai et al., 1991); workers must therefore assume that these agents do not affect the passive uptake mechanisms. Second, the parasite-induced increase in Ca++ permeability is relatively modest, with uptake estimated to be only < 20-fold faster than passive entry via endogenous host cell transporters (Desai et al., 1996). The combination of an efficient extrusion pump and relatively modest increase in passive uptake yields slow uptake kinetics and uncertainties about the magnitude and biological significance of increased Ca++ content (Staines et al., 1999). Third, Ca++ buffering by intracellular proteins and active Ca++ sequestration in one or more compartments within infected cells also complicate interpretation of experimental findings. Ca++ sequestration and release from parasite compartments also presumably involves passive and active transmembrane transporters that also remain largely unexplored.
Specific inhibitors of these Ca++ transport mechanisms, whether endogenous to the host membrane or encoded by the intracellular parasite, may offer the best approach to addressing these uncertainties and identifying the molecular basis of these putative transporters. For example, although the increased permeability of organic solutes was known for many years (Overman, 1948; Kutner et al., 1983), specific and potent inhibitors were instrumental in implicating PSAC as a single, shared channel for other solutes with increased permeability, determining its physiological roles and identifying genetic determinants of that channel (Pillai et al., 2010; Nguitragool et al., 2011; Pillai et al., 2013; Pillai et al., 2012; Ito et al., 2017). As a first step to similar insights into parasite-induced Ca++ transport, we have now designed and executed a cell-based high-throughput screen for specific Ca++ uptake inhibitors. Our studies implicate a proteinaceous uptake mechanism on infected cells distinct from a known low capacity Ca++ carrier on human erythrocytes (Lew et al., 1982; Varecka et al., 1986; Desai et al. 1991). Chemically distinct hits identified by our screen act at one or more intracellular membranes, but do not target the host membrane. In vitro parasite growth inhibition studies confirmed action of key compounds on parasite Ca++ acquisition and utilization, suggesting that these compounds may be starting for new antimalarial drugs. These inhibitors may help define the mechanisms of Ca++ transport and how intracellular malaria parasites utilize this essential ion.
2 RESULTS
2.1 NHS ester labeling has differing effects on Ca++ uptake by uninfected and infected cells
Erythrocytes loaded with fluorescent Ca++ indicator dyes exhibit gradually increasing fluorescence when suspended in buffered saline with 1 mM free Ca++; if external Ca++ is replaced with the Ca++ chelator EGTA, these increases are abolished (Zipprer et al., 2014). This Ca++-dependent increase in fluorescence is greater for infected erythrocytes than uninfected cells (Fig. 1A), consistent with an increased host membrane Ca++ permeability after infection.
Fig 1.
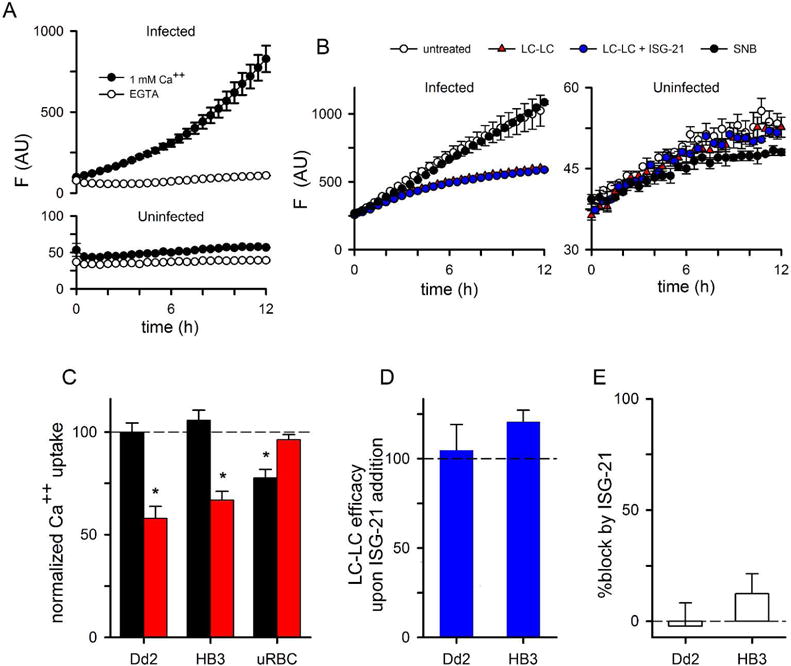
Surface labeling reveals differing mechanisms of Ca++ uptake by infected and uninfected cells. (A) Ca++ uptake kinetics for infected and uninfected cells in the presence of 1 mM external Ca++ or 1 mM EGTA, as indicated. Symbols represent mean ± S.E.M. of replicate wells. Notice the greater permeability of infected cells. (B) Uptake kinetics with and without pre-labeling of cells with sulfo-NHS-LC-LC-biotin or sulfo-NHS-biotin (LC-LC and SNB); LC-LC labeling in the presence of 125 nM ISG-21 is also shown to evaluate the effect of NHS ester uptake. (C) Mean ± S.E.M. Ca++ uptake after labeling with SNB or LC-LC (black and red bars, respectively), calculated as the change in fluorescence over 12 h measurements as shown in panels B and C followed by normalization to 100% for matched untreated cells. Dd2- and HB3-infected cells are shown. *, P < 0.05. (D) Preserved block of infected cell Ca++ transport by LC-LC despite inhibition of NHS ester uptake by 125 nM ISG-21, shown as the mean ± S.E.M. of 100*(% block with ISG-21)/(% block in matched controls without ISG-21). (E) Mean ± S.E.M. % block of Ca++ uptake by 125 nM ISG-21 alone. Values in D and E were calculated using change in fluorescence over 12 h.
To examine the responsible mechanisms, we examined Ca++ uptake after labeling surface-exposed proteins on erythrocytes with amine-reactive N-hydroxysulfosuccinimide (sulfo-NHS) esters (Anjaneyulu and Staros, 1987). Using two sulfo-NHS esters with different spacer lengths between the reactive NHS group and a biotin tag, we identified differing effects on infected and uninfected erythrocytes. Ca++ uptake by infected cells was significantly slowed by sulfo-LC-LC-biotin, a reagent with a long 30.5 Å spacer arm (Fig. 1B and 1C, red symbol and bar; P < 10−3, n = 14 trials), but unaffected by the smaller sulfo-NHS-biotin (SNB, 13.5 Å spacer arm, black symbol and bar; P =0.9, n = 14). In contrast, the modest fluorescence increase seen with uninfected cells was significantly reduced by the smaller sulfo-NHS-biotin and unaffected by sulfo-NHS-LC-LC-biotin (P = 10−3 and 0.15, respectively; n = 10 trials). The contrasting effects of the two reagents suggest distinct transport mechanisms for Ca++ uptake by infected and uninfected cells. Erythrocytes infected with the divergent Dd2 or HB3 parasite lines exhibited similar effects of these labelings (Fig. 1C, P > 0.22 for each reagent), suggesting one or more conserved NHS-ester labeling sites on the putative surface channel or transporter.
While NHS esters are generally membrane-impermeant and, therefore, only label surface-exposed sites, they have significant permeability into infected cells via PSAC (Cohn et al., 2003). To determine whether Ca++ uptake was inhibited by exofacial labeling or instead through reaction with one or more sites in erythrocyte cytosol, we performed labeling in the presence of 125 nM ISG-21, a potent PSAC inhibitor that abolishes uptake and hemoglobin labeling under our experimental conditions (Fig. S1; Pillai et al., 2012). Addition of this PSAC inhibitor had no effect on the block in Ca++ transport produced by sulfo-NHS-LC-LC-biotin (Fig. 1D), confirming that blocked Ca++ uptake results from exofacial labeling. ISG-21 addition without NHS ester labeling was without effect on Ca uptake (Fig. 1E, P = 0.7, n = 5), indicating that Ca++ uptake is independent of PSAC.
2.2 Exported parasite protein(s) are involved in Ca++ uptake
To explore whether parasite proteins are involved in formation of a putative Ca++ transporter at the host membrane, we measured uptake in 13F10, a transfected parasite clone with conditional knockdown of parasite protein export into the host cell (Beck et al., 2014). In this clone, HSP101, an essential component of the PTEX export translocon (Goldberg and Cowman, 2010; Elsworth et al., 2014), carries a trimethoprim-sensitive degradation domain at its C-terminus (Muralidharan et al., 2011); removal of trimethoprim (TMP) from cultures aborts export of nearly all parasite proteins to the host compartment. We found that Ca++ uptake was significantly reduced in 13F10 grown without TMP (Fig. 2A and 2C, P = 0.01, n = 7). As previously reported (Beck et al., 2014; Ito et al., 2017), PSAC activity was also adversely affected by blocking PTEX-mediated protein export (Fig. 2B-C). While sorbitol uptake through PSAC was nearly completed abolished in the conditional knockdown, the effect on Ca++ uptake was less complete, presumably reflecting transport via the divalent cation carrier native to the human erythrocyte membrane (Desai et al., 1991). Although these findings suggest that one or more exported parasite proteins contribute to increased Ca++ permeability at the host cell surface, we recognize that PTEX knockdown may also indirectly compromise Ca++ uptake by interfering with parasite maturation.
Fig 2.
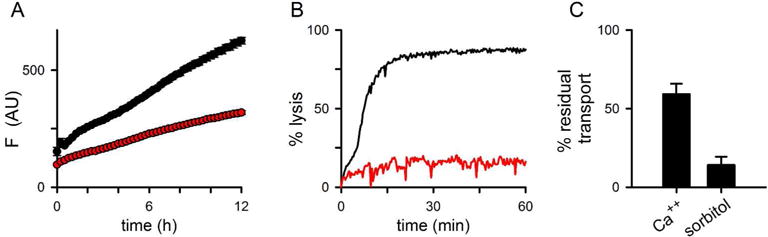
Conditional knockdown of parasite protein export aborts development of host cell permeability. (A) Ca++ uptake kinetics in the 13F10 HSP101-DDD clone after cultivation for 48 h with or without 10 μM TMP (black and red symbols, respectively). Note, the slower development of Ca++-dependent fluorescence in the absence of TMP. (B) PSAC-mediated osmotic lysis kinetics in sorbitol, measured in 13F10 cultivated with and without TMP (black and red traces, respectively). (C) Mean ± S.E.M. residual transport activities, tallied from experiments as in panels (A) and (B).
2.3 High-throughput screen identifies Ca++ transport inhibitors
While there are many inhibitors of mammalian Ca++ channels (Godfraind, 2017), surveys of these compounds and other transport inhibitors have not identified chemicals that inhibit Ca++ uptake by infected cells (Zipprer et al., 2014; Staines et al., 1999). Because inhibitors specific for parasite-associated Ca++ transport may help define the molecular basis of increased permeability and could be antimalarial drug leads, we used the cell-based fluorescence described here to execute a high-throughput screen for chemical inhibitors. To find suitable experimental conditions, we first compared two bright indicator dyes with low background fluorescence and appropriate affinities, Fluo-8 and Cal-520 (K0.5 values for Ca++ binding of 389 and 320 nM, respectively). After loading trophozoite-infected cells with acetoxymethyl (AM) esters of these indicators, we found that Fluo-8 yielded a somewhat larger signal with infected cells, but also significant fluorescence with uninfected cells (Fig. 3A, n = 3, P = 0.19 and 0.04 in matched comparisons of the two dyes for infected and uninfected cells, respectively). The significant Fluo-8 signal from uninfected cells suggested greater leakage of this dye from erythrocytes via organic anion transporters (OATs), as reported for other indicators (Steinberg et al., 1987). We evaluated this concern by adding 5 mM probenecid, a nonspecific inhibitor of OATs, and confirmed greater transporter-mediated leakage of Fluo-8 than Cal-520 from uninfected cells (reductions of 222 ± 41 and 29 ± 9 AU, respectively; P = 0.03). In contrast to uninfected cells, probenecid increased the Ca++-dependent signal of both dyes in infected erythrocytes, possibly due to dye redistribution within parasite compartments as observed previously (Zipprer et al., 2014). Because dye leakage from cells would produce unacceptable background in high-throughput screens, we selected Cal-520 for further study. Although probenecid addition to our screening buffer can prevent leakage and render Fluo-8 useful, effects on other cellular activities and possible interactions with screening compounds make this a less attractive approach for chemical screening.
Fig 3.
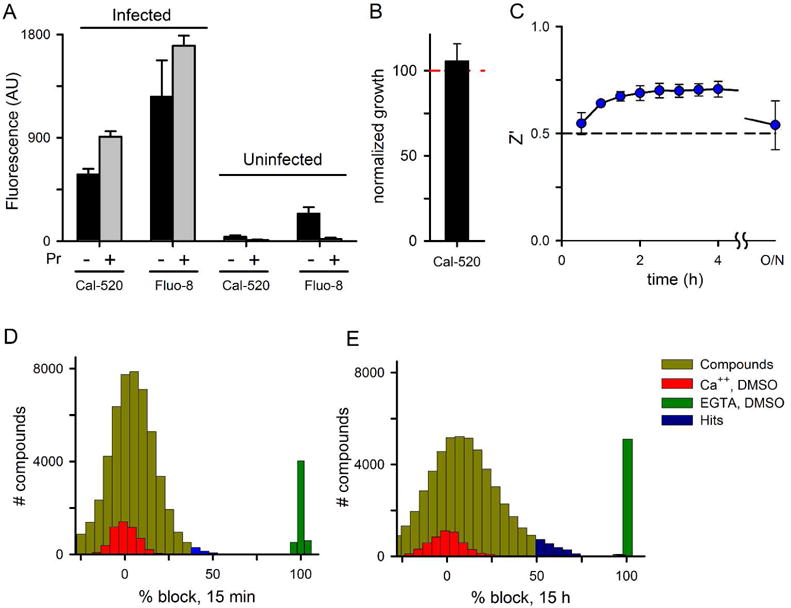
Design and execution of a chemical screen for inhibitors of Ca++ transport into infected cells. (A) Mean ± S.E.M. fluorescence signal from kinetic studies with infected and uninfected cells loaded with either Fluo-8 or Cal-520 indicator dyes at a 2.5 μM concentration. Pr represents 5 mM probenecid, added as an inhibitor of organic anion transporters. (B) Mean ± S.E.M. progression to ring stage parasites after Cal-520 loading and return to culture, normalized to a matched DMSO control. Progression was evaluated with Giemsa-stained slides; n = 3. (C) Z′ factor, calculated from positive and negative control wells in 384-well microplates at indicated timepoints after Ca++ addition. The accepted minimum value for single-well screens, Z′ = 0.5, is shown (dashed line). (D and E) All points histogram of results from a screen of 52,478 compounds, normalized to 0% and 100% block for in-plate negative and positive controls (Ca++ and EGTA, respectively). Panels D and E represent readings taken 15 min and 15 h after initiating Ca++ uptake in screening plates. Hits were defined as compounds that produced block greater than the mean plus 3*standard deviation of the negative control wells.
To obtain a robust signal for a high-throughput screen, we then optimized Cal-520 AM loading conditions and minimized both the required dye concentrations and amounts of cultured parasites. Under the selected conditions and a Cal-520 AM concentration of 0.3125 μM, loading of trophozoite-infected erythrocytes produced no detectable reduction in parasite growth, as indicated by successful egress and reinvasion to produce ring forms (Fig. 3B, P = 0.96 from n = 3 matched comparisons). At the same time, fluorescence readings in 384-well microplates yielded robust signals with Z′ factors of ~ 0.7 at 2 h and subsequent time points (Fig. 3C), above the generally accepted threshold of 0.5 for single point screens with low false positive rates (Zhang et al., 1999).
We used these conditions and the multidrug-resistant Dd2 parasite line to execute a high-throughput screen for inhibitors of Ca++ transport in infected cells. For each 384-well plate, fluorescence readings were taken at timed intervals after addition of 1 mM free Ca++ in EGTA-buffered saline. At each timepoint, readings were normalized to percentage inhibition using inplate controls to allow identification of reversible inhibitors, which should slow Ca++ uptake kinetics. EGTA without Ca++ addition was used as a positive control for complete inhibition of fluorescence development (green bars, Figures 3D-E); DMSO addition with buffered Ca++ was used as a negative control (red bars). All-point histograms of % block, tallied at the 15 min and 15 h timepoints, revealed that most compounds were inactive as their signals were indistinguishable from negative control wells (yellow bars).
Hits were defined as compounds with normalized block values exceeding the mean negative control by 3 standard deviations (blue histogram bars). The compound hit rate increased from 1% at the 15 min reading to 4.2% after 15 h. This increased hit rate at later time points is unexpected and contrasts with the prior PSAC screens, where the higher stringency of late readings allowed rank ordering of the most potent hits (Pillai et al., 2010). With our fluorescence assay, this increased hit rate may reflect either an artifact of extended incubations or, more interestingly, inhibition of Ca++ or Cal-520 redistribution that occurs over extended nonphysiological incubation.
Because our cell-based screen utilized room temperature incubations in nutrient-free saline, we did not expect parasite developmental progression. Giemsa-stained smears of cells incubated in this saline for 12 h revealed intact infected cells that did not advance through their developmental cycle, regardless of free Ca++ concentration. Indeed, we found that a 12 h room temperature incubation in nutrient-free saline renders all parasites nonviable, as confirmed by return to standard culture conditions for 12 days with regular microscopic examination (data not shown). Parasite death, however, does not undermine our goal of identifying and characterizing Ca++ transporters that typically do not require a viable pathogen. As an example, prior cell-based screens successfully identified potent PSAC inhibitors after extended non-physiological incubations that also led to parasite death (Alkhalil et al., 2004; Pillai et al., 2010).
2.4 Novel compounds identified against Ca++ uptake in P. falciparum infected RBC
We obtained 38 hits for secondary studies, obtained a > 90% positive retest rate, and selected six compounds from four novel and unrelated scaffolds for further study (Fig. 4A). Kinetic studies confirmed that each hit blocks fluorescence development associated with Ca++ uptake by infected cells in a dose-dependent manner (Figs. 4B-D). Interestingly, the efficacy of most of the hits improved when extracellular Ca++ was reduced to 8 μM in EGTA-buffered solutions, consistent with action on one or more saturable Ca++ transporters within the infected cell (Fig. 4D, asterisks).
Fig 4.
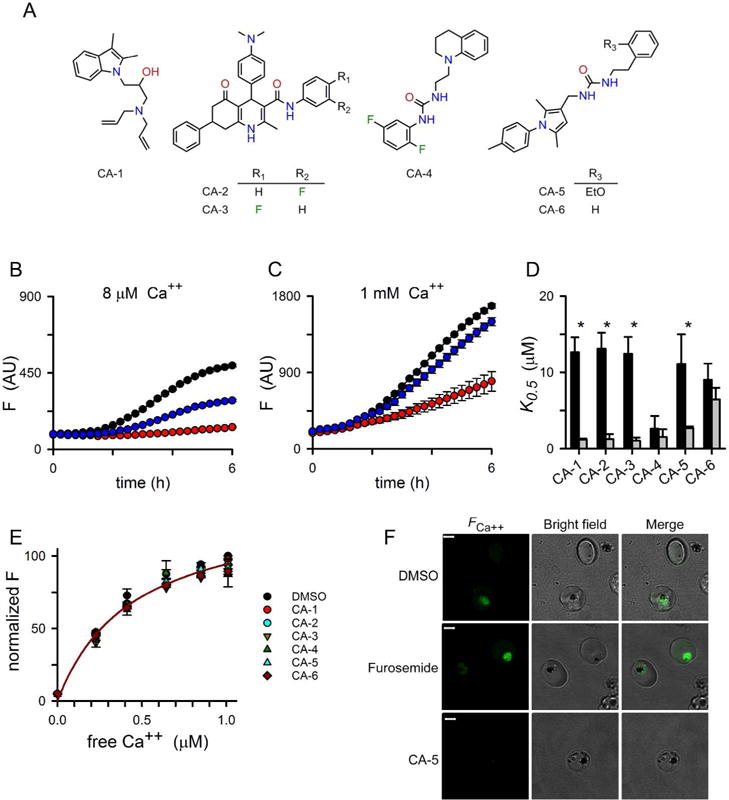
Novel Ca++ uptake inhibitors confirmed through secondary studies. (A) Chemical structures of six hits selected for detailed study. (B – C) Ca++ uptake fluorescence kinetics with 0, 5, and 10 μM CA-5 (black, blue, and red symbols, respectively). Uptake was measured in HBS with Ca++ buffered with EGTA to 8 μM and 1 mM free Ca++ in panels B and C, respectively, using http://www.maxchelator.stanford.edu. (D) Mean ± S.E.M. half-maximal inhibitory concentrations for indicated blockers in 1 mM and 8 μM free Ca++ (black and grey bars, respectively). Values were calculated from dose response measurements at the 330 min timepoint in kinetic experiments as in panels B and C. *, P < 0.05 for comparisons between the two buffers, n= 3 independent trials each, 2-way ANOVA with post-test. (E) Ca++ dose responses for Cal-520 in HBS with indicated hits. Compounds were tested at a 10 μM concentration and compared to a matched DMSO only control. Symbols represent the mean ± S.E.M. of up to 3 independent measurements with fluorescence normalized to the DMSO control. Solid line represents the best fit to y = Fmax*x/(Kd + x), yielding an estimated KD of 450 nM for Cal-520 binding to Ca++. (F) Confocal images of infected cells showing that CA-5 inhibits Ca++ uptake and fluorescence development, in contrast to DMSO or the PSAC inhibitor furosemide. Dye loading and 12 h incubation with inhibitors (25 μM) were performed under standard culture conditions. Scale bar, 3 μm.
We performed control experiments to evaluate two indirect mechanisms: Ca++ chelation by the inhibitor and fluorescence quenching as a result of interactions between the compound and the Cal-520 indicator. Ca++ dose responses and fluorescence measurements using cell-free buffered solution confirmed Cal-520’s reported affinity and excluded these indirect mechanisms (Fig. 4E). These dose response experiments used a high 10 μM inhibitor concentration and Cal-520 at a lower 0.19 μM level, a design that would have permitted detection of relatively low affinity interactions with either Ca++ or the indicator dye.
Because our measurements utilized nonphysiological buffers and prolonged room temperature incubations that deplete cellular ATP and might induce artifactual Ca++ permeability (Staines et al., 1999), we also loaded infected cells with Cal-520 AM in culture medium containing glucose to minimize ATP depletion followed by standard culture for 12 h to examine Ca++ uptake in propagating cells. While the PSAC inhibitor did not affect development of the Ca++-dependent fluorescence, CA-5 remained effective (Fig. 4F); thus, this inhibitor’s activity is not likely to be an artifact of nonphysiological treatments or ATP depletion.
2.5 Inhibitors target intracellular sites within infected cells
Because the targets of these inhibitors may be Ca++ transporters at either the host cell membrane or one or more intracellular membranes, we next measured initial uptake rates at the host membrane with 45Ca++ tracer experiments. These experiments confirmed that infected cells exhibit slow 45Ca++ uptake that is linear over 1 h, as reported previously (Desai et al., 1996). Addition of 10 μM CA-5 did not alter the kinetics of Ca++ uptake (Fig. 5A). Initial rate measurements, calculated as the slope from linear regression fits, revealed that all six inhibitors used in our studies failed to significantly alter initial 45Ca++ uptake kinetics (Fig. 5B). These findings suggest that these compounds inhibit fluorescence development primarily through inhibition of transport at one or more intracellular sites within the infected erythrocyte.
Fig 5.
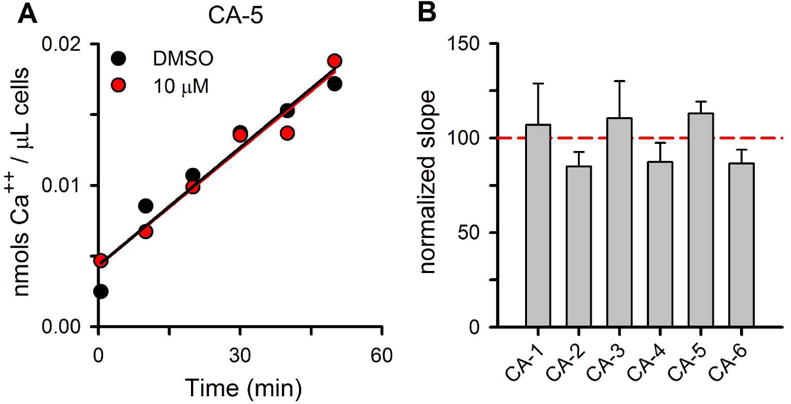
Ca++ uptake inhibitors do not inhibit initial uptake kinetics at the host membrane, suggesting action at one or more intracellular sites. (A) Representative 45Ca uptake kinetics for enriched trophozoite-stage infected cells using the Dd2 parasite line; [Ca++] = 0.1 mM. Symbols represent 45Ca++ accumulation with either 10 μM CA-5 or a DMSO control. Solid lines represent the best fit y = m*x + yo and reveal that uptake is linear over the measured duration. (B) Mean ± S.E.M. slopes of 45Ca++ uptake for indicated inhibitors, normalized to matched DMSO controls, as in panel (A). None of these inhibitors significantly alters initial Ca++ uptake kinetics.
We then used saponin exposure to liberate the intracellular parasite and examine Ca++ transport across intracellular membranes. After loading freed parasites with Cal-520, fluorescence kinetics revealed a low Ca++ permeability at the parasite plasma membrane (PPM, Fig. 6A and S2); addition of SDS to lyse these cells confirmed dye loading and retention (arrow, Fig. 6A). When compared to the host erythrocyte membrane, the PPM exhibits a higher affinity for Ca++ binding and uptake as decreasing the external Ca++ to 8 μM with EGTA buffering did not compromise uptake (Fig. 6B, P = 0.08, paired t test from n = 4 matched experiments with freed parasites).
Fig 6.

Ca++ transport into freed parasites. (A) Fluorescence kinetic measurements using saponin-freed trophozoites in HBS with 1 mm free Ca++ or 0.5 mM EGTA, as indicated. Arrow indicates addition of SDS to lyse cells and release intracellular Cal-520. Notice negligible Ca++ uptake on this time scale. (B) Mean ± S.E.M. increase in fluorescence over a12 h incubation for freed parasites and intact infected cells suspended in HBS with buffering to maintain either an 8 μM or a 1 mM free Ca++ (grey and black bars, respectively; n = 4-5 matched independent trials). *, P < 10−3.
Each of our 6 inhibitors blocked uptake into freed parasites (Fig. S2), supporting the above findings that these compounds act on Ca++ trafficking within the intracellular parasite and not at the host membrane. Somewhat higher concentrations were required of each inhibitor to achieve block comparable to that observed with intact infected cells, possibly because of either altered loading of the Cal-520 AM indicator dye into parasite organelles or evolving leakiness of the freed parasite. Confocal imaging also confirmed action on one or more intracellular membranes (Fig. S2).
2.6 Inhibitors kill parasite cultures through action on Ca++ utilization
As these inhibitors have relatively low target affinities, we selected CA-1 and CA-5 as two distinct scaffolds having marked improvement in K0.5 upon Ca++ restriction for growth inhibition studies. We used a 72-hour growth inhibition assay and compared culture media with and without restricted extracellular Ca++ availability. With the standard RPMI 1640 medium, both compounds interfered with parasite propagation in a dose-dependent manner with micromolar half-maximal inhibitory concentrations (IC50) that compared favorably to their K0.5 values for inhibition of Ca++ transport in our kinetic fluorescence assay (Fig. 7).
Fig 7.
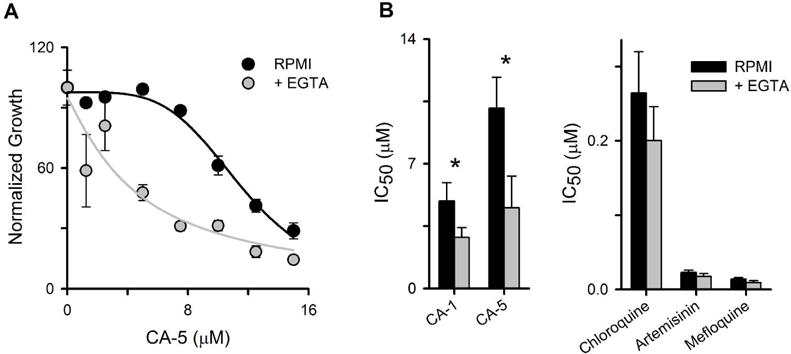
Growth inhibitory effects of inhibitors are consistent with action on Ca++ transport mechanisms. (A) Normalized parasite growth over 72 h with indicated concentrations of CA-5 in RPMI 1640-based medium without or with 0.44 mM EGTA added to limit availability of extracellular Ca++. Symbols represent mean ± S.E.M. of 3 replicate measurements; solid lines represent best fits to y = a/(1 + (x/b)c). Note that CA-5 reduces parasite growth at lower concentrations when extracellular Ca++ is reduced by addition of 0.44 mM EGTA. (B) Mean ± S.E.M. IC50 values for indicated inhibitors or antimalarial drugs in media without or with 0.44 mM EGTA, determined from experiments as in panel (A). *, P < 0.05, 2-way ANOVA with post-test.
We then added EGTA to the standard medium and identified a threshold concentration, 0.44 mM, that allows continued parasite growth but at reduced rates (35 ± 8% of normal culture expansion in 72 h assays, n = 14 trials). Because this reduction suggests growth is limited by Ca++ utilization, the potencies of our inhibitors are expected to improve if they act via similar mechanisms (Tallarida, 2001; Basore et al., 2015). With this modified medium, both CA-1 and CA-5 exhibited improved efficacy against parasite growth. In contrast, the potencies of three approved antimalarial drugs that do not act on Ca++ utilization were not significantly changed (Fig. 7B).
3 DISCUSSION
Erythrocytes infected with malaria parasites have increased permeability to diverse solutes, including Ca++. Uncharged solutes and monovalent ions utilize the plasmodial surface anion channel (PSAC), a nutrient uptake channel linked to the RhopH complex conserved in all examined Plasmodia (Ito et al, 2017; Sherling et al., 2017; Counihan et al., 2017). Divalent ions such as Ca++ are not permeant through PSAC and therefore require a separate mechanism for their increased uptake. Our findings implicate, for the first time, a proteinaceous pathway for Ca++ entry into infected cells. This pathway may reflect either one or more altered host proteins or a parasite-encoded transporter trafficked to the host membrane. While differential susceptibility to NHS esters and abrogated transport upon knockdown of PTEX-mediated protein export are both suggestive of a parasite-encoded transporter, these changes might also reflect regulated modifications of host proteins by parasite effector proteins. Identification of the precise molecular basis of Ca++ uptake by infected cells should be the aim of future studies. This may require a long-range research commitment, as exemplified by the gene identification studies relating to PSAC (Nguitragool et al., 2011); both the resulting insights into host-parasite interactions and the prospect of new antimalarials that target Ca++ uptake justify this investment.
When combined with a requirement for extracellular Ca++ in parasite propagation (Wasserman et al., 1982; Zipprer et al., 2014), it is tempting to assume that increased Ca++ permeability is essential for intracellular development; our findings tentatively support this model with evidence for a proteinaceous mechanism dependent on one or more exported parasite proteins. Caution is, however, required because the increase in Ca++ permeability is modest when compared to the more dramatic increases for organic nutrients (Desai, 2014) and because passive Ca++ carriers endogenous to the host membrane may, in principal, fulfill the parasite’s Ca++ demands. Caution is also warranted in light of the proposal that increased Ca++ permeability may be an artifact of experimental manipulations that deplete cellular ATP (Staines et al., 1999).
As specific inhibitors would help address these uncertainties, we devised and executed a cell-based screen and identified the first inhibitors of infected cell Ca++ trafficking. The identified compounds are unrelated to both known mammalian Ca++ channel blockers and PSAC inhibitors. Our Pubchem structure searches determined that these compounds are not nonspecific hits in other screens but did reveal that CA-2 and CA-3 are related to a compound (CID: 2864758) that kills P. falciparum in a previous growth inhibition screen. These analyses support the view that the parasite uses distinct and novel transporters to traffic Ca++ across its multiple membranes. In secondary studies, these compounds blocked Ca++-dependent fluorescence kinetics with low micromolar affinity. Reducing extracellular free Ca++ accentuated block, consistent with reversible inhibitors that act specifically on one or more transporters; alternatively, these agents may work on enzymes such as kinases that regulate Ca++ concentrations within the parasite. Initial rates of 45Ca++ uptake by infected cells excluded action on the host membrane and, instead, suggest action at intracellular membranes; this was further supported with studies using freed parasites. Two compounds selected for further study also inhibited in vitro parasite propagation at concentrations similar to those required to interfere with Ca++ transport. Improved in vitro growth inhibition with reduced free Ca++ concentrations in culture medium also supports action against parasite Ca++ utilization. Although this improvement reached statistical significance for both compounds, these experiments were constrained by the need to change Ca++ at target sites within the infected cell. Our approach, use of a reduced extracellular Ca++, was likely compromised by mechanisms that regulate this critical ion’s levels at intracellular sites.
Our Cal-520 based screen achieved a high Z′ score in 384-well microplates, permitting confident detection of hits with reproducible activity in secondary studies. We confirmed that the low concentrations of Cal-520 AM we loaded into cells did not interfere with parasite propagation. An important limitation, however, was that the subcellular distribution of this indicator dye could not be precisely controlled; possibly because of this limitation, the screening hits we selected for study did not target the host membrane as we intended, but rather one or more unknown sites within the intracellular parasite. Selection of in vitro resistant mutants followed by genome sequencing, as has been successfully applied to other antimalarial compounds acting on transporters, may address this unknown. An alternative approach, use of genetically-encoded Ca++ sensor proteins known as GCaMPs, may address this limitation and has been reported in both P. falciparum and T. gondii parasites (Pandey et al., 2016; Sidik et al., 2016). Our unpublished studies with GCaMPs in P. falciparum revealed, however, that their signal is weaker than that of fluorescent dyes like Cal-520, yielding Z′ scores well below values acceptable for high-throughput screening.
The relatively slow kinetics of Ca++ uptake in our experiments are consistent with modest, but significantly increased host cell permeability in 45Ca++ uptake studies (Desai et al., 1996; Staines et al., 1999). The slow kinetics in both fluorescence and 45Ca studies are not consistent with larger permeabilities reported in some whole-cell patch-clamp studies (Brand et al., 2003). The small size and technical difficulties associated with infected cell patch-clamp warrant cautious interpretation of such studies, at least in part because our own patch-clamp studies have implicated much smaller Ca++ conductances (Desai et al., 1996; Desai et al., 2005).
We also found that parasites liberated from their host cells exhibit relatively high-affinity, low-capacity Ca++ uptake at their plasma membrane. The parasitophorous vacuolar membrane surrounding the parasite is highly permeable to Ca++ and other solutes (Desai et al., 1993), suggesting that intracellular parasite must scavenge Ca++ in the face of the low levels within erythrocyte cytosol. With such an environment, a high-affinity transporter on the parasite plasma membrane is appealing. Independent approaches to examine this transport will be required because experiments with freed parasites require cautious interpretation due to cell fragility upon saponin-induced release from host cells.
We propose a proteinaceous route dependent on parasite protein export for Ca++ uptake at the host membrane of infected cells. When combined with our new inhibitors, these advances should help clarify the molecular mechanisms responsible for parasite Ca++ uptake and utilization; they may also lead to development of new antimalarials that target these unidentified but essential parasite activities.
4 EXPERIMENTAL PROCEDURES
4.1 Parasite stains and cultivation
The P. falciparum Dd2 and HB3 laboratory clones were cultivated in O+ human erythrocytes from anonymized donors (VA Blood Services, Richmond, VA, USA) by standard methods at 5% hematocrit under 5% O2, CO2, 90% N2 at 37 °C. Cultures were synchronized with sorbitol treatment.
The 13F10 HSP101-DDD clone, kindly provided by J. Beck and D. Goldberg, was cultivated in presence of 10 μM TMP and 2.5 μg/mL blasticidin S as described (Beck et al., 2014). To inhibit PTEX-mediated parasite protein export, HSP101 knockdown was initiated by TMP removal at the trophozoite stage followed by parasite cultivation for 48 hr before harvest for Ca++ uptake and osmotic lysis experiments.
4.2 Ca++ indicator dye loading, kinetic uptake measurements, and high-throughput screen
Trophozoite-stage infected cells were loaded with acetoxymethyl (AM) esters of Ca++ indicator dyes as previously described (Zipprer et al., 2014) after further optimization for high-throughput screening by examination of dye loading, cell resuspension, and fluorescence measurement conditions. Briefly, parasite cultures were enriched by Percoll-sorbitol density gradient centrifugation, washed and loaded with indicated concentrations of Fluo-8 AM or Cal-520 AM (AAT Bioquest, Sunnyvale, CA, USA) by incubation in HBS (150 mM NaCl, 20 mM HEPES, 1 mM EGTA, pH adjusted to 7.4 with NaOH) supplemented with 0.1 mg/mL BSA for 1 h at 37 °C. After dye loading, cells were washed in Ca++-free solutions before resuspension in 384-well microplates at a final hematocrit of 0.05% and 100 μL using HBS. This uptake buffer contained 1 mM EGTA and additional CaCl2 to yield desired free Ca++ concentrations with chelator buffering. Where present, transport inhibitors were added during the final resuspension to initiate kinetic Ca++ uptake measurements at room temperature. Kinetic measurements tracked fluorescence (Synergy HT plate reader, Biotek, Winooski, VT; excitation 485 nm, emission 528 nm) at 15 min intervals. Progression of infected cells through their developmental cycle over the 12 h room temperature incubation was evaluated with microscopic smears; these cells were also returned to standard culture with addition of fresh blood to determine if any parasites remained viable after the incubation.
To evaluate toxicity associated with Cal-520 loading, synchronous trophozoite-stage cultures were loaded with 0.3125 μM Cal-520 AM at 0.1% hematocrit in culture medium for 1 h at 37 °C; with each trial, a matched DMSO only treatment was performed as a negative control. Cells were then washed and returned to culture for 12 h before microscopic examination to estimate ring-stage parasitemia.
High-throughput screens followed this procedure, but used preincubation of 50 μL of 0.1% hct Cal-520 loaded cells with candidate inhibitors from a 50,000 chemical library (ChemDiv, San Diego, CA, USA) in Ca-free HBS. Individual chemicals were dispensed by pin transfer (100 nL of a 10 mM stock), incubated with the cells for ~ 30 min prior to initiation of Ca++ uptake by addition of 50 μL HBS supplemented with CaCl2 to yield a free [Ca++] of 1 mM. Each compound in the library was therefore present at a final concentration of 10 μM during Ca++ uptake. The microplates were vortexed and incubated at room temperature before reading fluorescence at 15 min, 100 min, 200 min and 15 h. In-plate negative and positive controls consisted of DMSO only and 0.5 mM EGTA without Ca++ addition, respectively. Fluorescence readings at each time-point were normalized according to %block = 100*(μneg−Fi)/(μneg − μpos), where μneg and μpos represents mean fluorescence values from in-plate negative and positive control wells and Fi represents the fluorescence from the test compound well. The Z′ statistic was used to evaluate signal-to-noise ratio according to the equation Z′ = 1-3*[(σneg + σpos)/(μpos − μneg)], where σneg and σpos represent the standard deviations of in-plate control fluorescence measurements (Zhang et al., 1999).
Control experiments were used to exclude Ca++-independent quenching of Cal-520 fluorescence by the identified transport inhibitors. The sodium salt of Cal-520 was dissolved at 0.19 μM in HBS with 1 mM EGTA and CaCl2 to generate buffered free Ca++ concentrations between 0 and 1.01 μM, calculated using Maxchelator Ca-EGTA calculator v1.3 at http://maxchelator.stanford.edu/CaEGTA-TS.htm. Inhibitors were added at a final 10 μM concentration; matched inhibitor free controls were performed with an equivalent DMSO concentration.
4.3 Surface labeling with sulfo-NHS esters
Cal-520 loaded cells were labeled with sulfo-NHS esters (ThermoFisher Scientific, Waltham, MA, USA) to evaluate contributions of cell-surface proteins to Ca++ uptake by infected and uninfected cells. Nomenclature used: LC-LC, sulfo NHS-LC-LC-biotin (MW 669.75 g/mol; arm length 30.5 Å); SNB, sulfo NHS biotin (MW 443.42 g/mol; arm length 13.5Å). Labelling was performed in a 384-well microplate at a hematocrit of 0.06% in HBS by incubating cells with 50 μM of freshly prepared NHS ester for 30 min at room temperature. Where present, ISG-21was added from a DMSO stock to a final concentration of 125 nM (K0.5 of 2.6 nM for PSAC block, (Pillai et al., 2012). After this labeling, HBS with CaCl2 was added to yield a final 1 mM Ca++ concentration and initiate kinetic measurements.
NHS ester uptake by infected cells and effectiveness of block by ISG-21 was also evaluated. Enriched trophozoite-infected cells were labeled with 62.5 μM sulfo NHS-LC-LC-biotin in 150 mM NaCl, 20 mM HEPES, pH 7.4 at 0.1% hct with or without 125 nM ISG-21 for 30 min at room temperature. After quenching unreacted NHS ester with 2 mM lysine and extensive washing, the cell cytosol was harvested by hemolysis in hypotonic buffer (7.5 mM Na2HPO4, 1 mM EDTA, 1 mM PMSF, pH 7.5) and ultracentrifugation (100,000 × g, 1 h, 4 °C). The proteins were solubilized in Laemmli sample buffer containing 6% SDS, separated by electrophoresis in a 4-15% Mini-Protean TGX gel (Bio-Rad, Hercules, CA, USA), and transferred to nitrocellulose membrane. After blocking with 3% skim milk in 150 mM NaCl, 20 mM Tris HCl, pH 7.4 with 0.1% Tween20, the blot was probed with streptavidin-HRP. Bands were visualized on x-ray film with chemiluminescent substrate.
4.4 Organic solute permeability measurements
PSAC-mediated sorbitol permeability was quantified using osmotic lysis of infected cells as described previously (Ito et al., 2017). Trophozoite-stage infected cells were enriched using Percoll-sorbitol or Percoll-xylitol gradient separation, washed and resuspended in 150 mM NaCl, 20 mM Na-HEPES, 0.1 mg/ml BSA, pH 7.4. Uptake was initiated by addition of 280 mM sorbitol, 20 mM Na-HEPES, 0.1 mg/ml BSA, pH 7.4. The transmittance of 700 nm light through the cell suspension was continuously recorded to measure osmotic lysis resulting from sorbitol uptake. Transmittance readings were normalized to 100% cell lysis by addition of 0.5% saponin at the end of each recording. Osmotic lysis half-times and the fraction of cells refractory to osmotic lysis were determined as described previously (Ito et al., 2017).
4.5 45Ca++ flux studies
Enriched infected cells were incubated at 20 % hct in HBS with Ca++ transport inhibitors at a 10 μM concentration at 37 °C for 30 min; a matched negative control was incubated with DMSO at the same concentration with each experiment. After centrifugation to remove the supernatant, uptake of 45Ca++ was initiated by resuspension at 20 % hct in HBS with the transport inhibitor and free 45Ca++ at concentrations of 0.1 or 1 mM with a nominal specific activity of 5 μCi/mL. At timed intervals up to 1 h, 10 μL cell suspension was added to 1 ml of ice-cold HBS with 5 mM Na3VO4 and 1 mM EGTA (pH 7.4) plus 200 μL of a 9:1 mixture of dibutyl phthalate (1.043 g/mL) and mineral oil (0.83 g/mL). Centrifugation at 13,000 × g for 30 s was used to terminate 45Ca++ uptake and isolate the infected cells, which were subsequently digested in 1:2 mixture of NCS-II tissue solubilizer (Amersham Biosciences, Little Chalfont, UK) and ethanol, decolorized with 30% H2O2 and counted in 4 mL Ultima Gold AB scintillation cocktail and a 2450 MicroBeta2 counter (Perkin Elmer, Waltham, MA, USA). Initial Ca++ uptake rates were then estimated by linear regression.
4.6 Saponin-released parasites
Enriched trophozoite-stage infected cells were incubated in 20 volumes of HBS with 0.04% saponin at room temperature for 3 minutes before washing with HBS to remove the detergent. The freed parasites were resuspended at 0.1% hct in HBS with 0.1 mg/mL BSA, 1 mM EGTA, and 1 μM Cal-520 AM. After a 30 min incubation at 37 °C to load Cal-520, the cells were washed and resuspended at 0.5 % hct in HBS with 0.1 mg/mL BSA, 0.5 mM EGTA, and CaCl2 to the indicated free Ca++ concentration. The kinetics of fluorescence development were measured in 384-well microplates at room temperature, as described above. Readings were made at 10 s or 15 min intervals. When used, SDS was added to 0.02% to lyse cells and release intracellular Cal-520.
4.7 Confocal microscopy
Confocal microscopy was performed on unfixed cells to image Ca++-dependent fluorescence associated with Cal-520 binding. For imaging of intact infected cells, we loaded enriched trophozoite-stage infected cells in complete culture medium supplemented with 0.5 mM EGTA and 0.3125 μM Cal-520 AM at a 0.1% hct for 1 h at 37 °C. After washing, the cells were resuspended in 96-well microplates using RPMI 1640 supplemented with 25 mM HEPES, 50 μg/L hypoxanthine, 0.5 mM EGTA, 1.5 mM CaCl2, and either 25 μM of indicated transport inhibitor or an equivalent amount of DMSO as a control. After a 12 h incubation at 37 °C, the cells were transferred to cover glass bottom dishes (MatTek, Ashland, MA, USA) and imaged on a Leica SP5 microscope under a 63× oil immersion objective with 488 nm excitation. Images were deconvoluted using Huygens Essential (SVI, Hilversum, Netherlands) and processed using Imaris software (Bitplane, Zurich, Switzerland).
Imaging of freed parasites was similarly performed without fixation. Here, enriched trophozoite-infected cells were lysed with 20 volumes of 0.04% saponin in HBS for 3 min at room temperature. After washing, they were loaded with indicator dye in complete culture medium supplemented with 0.5 mM EGTA and 1 μM Cal-520 AM at a 0.1% hct for 30 min at 37 °C with intermittent gentle resuspension. After washing, these cells were incubated at 37 °C for 12 h with 25 μM transport inhibitor or DMSO and imaged, both as described above for intact infected cells.
4.8 Growth inhibition studies
In vitro parasite killing by transport inhibitors was estimated using a standard 72 h growth experiment and a SYBR green I assay for parasite nucleic acid in 96-well format (Pillai et al., 2012). To examine interactions between extracellular Ca++ availability and inhibitor efficacy, parasite growth was evaluated in standard RPMI 1640-based medium with and without EGTA supplementation. Sorbitol-synchronized cultures were seeded at 0.5 % parasitemia and 2.5 % hct in culture medium with inhibitors at indicated concentrations. Cultures were maintained for 72 h at 37°C without media changes and then lysed in 20 mM Tris, 10 mM EDTA, 0.016% saponin, 1.6% triton X100, pH 7.5 with SYBR Green I nucleic acid gel stain (Invitrogen, Carlsbad, CA, USA) at a 5000-fold dilution. After a 30 min incubation in the dark, parasite nucleic acid production was quantified with triplicate fluorescence measurements (excitation, 485nm; emission, 528nm). IC50 values for each inhibitor were estimated from seven point dose responses after subtraction of background fluorescence measured using matched cultures cultivated with 20 μM chloroquine.
4.9 Statistical analysis
Statistical comparisons were performed in SigmaPlot 10 (Systat Software, San Jose, CA, USA) or Prism 7 (GraphPad Software, La Jolla, CA, USA) using Student’s t tests or two-way analysis of variance with post-test as described (Benjamini et al., 2006).
Supplementary Material
Fig S1 Immunoblots showing sulfo-NHS-LC-LC-biotin labeling of intracellular hemoglobin in infected cells (15 kDa band). ISG-21, added during the labeling, inhibits sulfo-NHS-LC-LC-biotin uptake, indicating that this NHS ester enters infected cells via PSAC; addition of ISG-21 during labeling ensures that only exposed sites on surface proteins are labeled. Other cytosolic proteins are also labeled, but are not apparent in these blots because they are much less abundant.
Fig S2 Ca++ uptake into parasites freed from their host cells. Panels at left show 12 h fluorescence kinetics using saponin-freed trophozoites in HBS with 1 mm free Ca++ or 0.5 mM EGTA (top panel); subsequent panels show block by indicated inhibitors. Confocal images on right show fluorescence development in standard culture medium supplemented with 1 mM Ca++ and each inhibitor at a 25 μM concentration. Positive and negative controls (DMSO alone and 0.5 mM EGTA, respectively) are shown in the top two rows. Scale bar in each row, 3 μm.
Acknowledgments
This study was supported by the Intramural Research Program of National Institutes of Health, National Institute of Allergy and Infectious Diseases. The funders had no role in study design, data collection and analysis, decision to publish, or preparation of the manuscript.
References
- Alkhalil A, Cohn JV, Wagner MA, Cabrera JS, Rajapandi T, Desai SA. Plasmodium falciparum likely encodes the principal anion channel on infected human erythrocytes. Blood. 2004;104:4279–4286. doi: 10.1182/blood-2004-05-2047. [DOI] [PubMed] [Google Scholar]
- Anjaneyulu PS, Staros JV. Reactions of N-hydroxysulfosuccinimide active esters. Int J Pept Protein Res. 1987;30:117–124. doi: 10.1111/j.1399-3011.1987.tb03319.x. [DOI] [PubMed] [Google Scholar]
- Basore K, Cheng Y, Kushwaha AK, Nguyen ST, Desai SA. How do antimalarial drugs reach their intracellular targets? Front Pharmacol. 2015;6:91. doi: 10.3389/fphar.2015.00091. [DOI] [PMC free article] [PubMed] [Google Scholar]
- Beck JR, Muralidharan V, Oksman A, Goldberg DE. PTEX component HSP101 mediates export of diverse malaria effectors into host erythrocytes. Nature. 2014;511:592–595. doi: 10.1038/nature13574. [DOI] [PMC free article] [PubMed] [Google Scholar]
- Benjamini Y, Krieger AM, Yekutieli D. Adaptive linear step-up procedures that control the false discovery rate. Biometrika. 2006;93:491–507. [Google Scholar]
- Brand VB, Sandu CD, Duranton C, Tanneur V, Lang KS, Huber SM, et al. Dependence of Plasmodium falciparum in vitro growth on the cation permeability of the human host erythrocyte. Cell Physiol Biochem. 2003;13:347–356. doi: 10.1159/000075122. [DOI] [PubMed] [Google Scholar]
- Brochet M, Billker O. Calcium signalling in malaria parasites. Mol Microbiol. 2016;100:397–408. doi: 10.1111/mmi.13324. [DOI] [PubMed] [Google Scholar]
- Budu A, Gomes MM, Melo PM, El Chamy MS, Bagnaresi P, Azevedo MF, et al. Calmidazolium evokes high calcium fluctuations in Plasmodium falciparum. Cell Signal. 2016;28:125–135. doi: 10.1016/j.cellsig.2015.12.003. [DOI] [PubMed] [Google Scholar]
- Cohn JV, Alkhalil A, Wagner MA, Rajapandi T, Desai SA. Extracellular lysines on the plasmodial surface anion channel involved in Na+ exclusion. Mol Biochem Parasitol. 2003;132:27–34. doi: 10.1016/j.molbiopara.2003.08.001. [DOI] [PubMed] [Google Scholar]
- Counihan N, Chisholm SA, Bullen HE, Srivastava A, Sanders PR, Jonsdottir TK, et al. Plasmodium falciparum parasites deploy RhopH2 into the host erythrocyte to obtain nutrients, grow and replicate. Elife. 2017;6:e23217. doi: 10.7554/eLife.23217. [DOI] [PMC free article] [PubMed] [Google Scholar]
- Desai SA. Why do malaria parasites increase host erythrocyte permeability? Trends Parasitol. 2014;30:151–159. doi: 10.1016/j.pt.2014.01.003. [DOI] [PMC free article] [PubMed] [Google Scholar]
- Desai SA, Alkhalil A, Kang M, Ashfaq U, Nguyen ML. PSAC-independent phloridzin resistance in Plasmodium falciparum. J Biol Chem. 2005;280:16861–16867. doi: 10.1074/jbc.M414629200. [DOI] [PubMed] [Google Scholar]
- Desai SA, Krogstad DJ, McCleskey EW. A nutrient-permeable channel on the intraerythrocytic malaria parasite. Nature. 1993;362:643–646. doi: 10.1038/362643a0. [DOI] [PubMed] [Google Scholar]
- Desai SA, McCleskey EW, Schlesinger PH, Krogstad DJ. A novel pathway for Ca++ entry into Plasmodium falciparum-infected blood cells. Am J Trop Med Hyg. 1996;54:464–470. doi: 10.4269/ajtmh.1996.54.464. [DOI] [PubMed] [Google Scholar]
- Desai SA, Schlesinger PH, Krogstad DJ. Physiologic rate of carrier-mediated Ca2+ entry matches active extrusion in human erythrocytes. J Gen Physiol. 1991;98:349–364. doi: 10.1085/jgp.98.2.349. [DOI] [PMC free article] [PubMed] [Google Scholar]
- Elsworth B, Matthews K, Nie CQ, Kalanon M, Charnaud SC, Sanders PR, et al. PTEX is an essential nexus for protein export in malaria parasites. Nature. 2014;511:587–591. doi: 10.1038/nature13555. [DOI] [PubMed] [Google Scholar]
- Garcia CR, Ann SE, Tavares ES, Dluzewski AR, Mason WT, Paiva FB. Acidic calcium pools in intraerythrocytic malaria parasites. Eur J Cell Biol. 1998;76:133–138. doi: 10.1016/S0171-9335(98)80026-5. [DOI] [PubMed] [Google Scholar]
- Garg S, Agarwal S, Kumar S, Yazdani SS, Chitnis CE, Singh S. Calcium-dependent permeabilization of erythrocytes by a perforin-like protein during egress of malaria parasites. Nat Commun. 2013;4:1736. doi: 10.1038/ncomms2725. [DOI] [PubMed] [Google Scholar]
- Glushakova S, Lizunov V, Blank PS, Melikov K, Humphrey G, Zimmerberg J. Cytoplasmic free Ca2+ is essential for multiple steps in malaria parasite egress from infected erythrocytes. Malar J. 2013;12:41. doi: 10.1186/1475-2875-12-41. [DOI] [PMC free article] [PubMed] [Google Scholar]
- Godfraind T. Discovery and Development of Calcium Channel Blockers. Front Pharmacol. 2017;8:286. doi: 10.3389/fphar.2017.00286. [DOI] [PMC free article] [PubMed] [Google Scholar]
- Goldberg DE, Cowman AF. Moving in and renovating: exporting proteins from Plasmodium into host erythrocytes. Nat Rev Microbiol. 2010;8:617–621. doi: 10.1038/nrmicro2420. [DOI] [PubMed] [Google Scholar]
- Ito D, Schureck MA, Desai SA. An essential dual-function complex mediates erythrocyte invasion and channel-mediated nutrient uptake in malaria parasites. Elife. 2017;6:e23485. doi: 10.7554/eLife.23485. [DOI] [PMC free article] [PubMed] [Google Scholar]
- Kramer R, Ginsburg H. Calcium transport and compartment analysis of free and exchangeable calcium in Plasmodium falciparum-infected red blood cells. J Protozool. 1991;38:594–601. [PubMed] [Google Scholar]
- Kutner S, Ginsburg H, Cabantchik ZI. Permselectivity changes in malaria (Plasmodium falciparum) infected human red blood cell membranes. J Cell Physiol. 1983;114:245–251. doi: 10.1002/jcp.1041140215. [DOI] [PubMed] [Google Scholar]
- Lew VL, Tsien RY, Miner C, Bookchin RM. Physiological [Ca2+]i level and pump-leak turnover in intact red cells measured using an incorporated Ca chelator. Nature. 1982;298:478–481. doi: 10.1038/298478a0. [DOI] [PubMed] [Google Scholar]
- Maier AG, Cooke BM, Cowman AF, Tilley L. Malaria parasite proteins that remodel the host erythrocyte. Nat Rev Microbiol. 2009;7:341–354. doi: 10.1038/nrmicro2110. [DOI] [PubMed] [Google Scholar]
- Muralidharan V, Oksman A, Iwamoto M, Wandless TJ, Goldberg DE. Asparagine repeat function in a Plasmodium falciparum protein assessed via a regulatable fluorescent affinity tag. Proc Natl Acad Sci USA. 2011;108:4411–4416. doi: 10.1073/pnas.1018449108. [DOI] [PMC free article] [PubMed] [Google Scholar]
- Nguitragool W, Bokhari AA, Pillai AD, Rayavara K, Sharma P, Turpin B, et al. Malaria parasite clag3 genes determine channel-mediated nutrient uptake by infected red blood cells. Cell. 2011;145:665–677. doi: 10.1016/j.cell.2011.05.002. [DOI] [PMC free article] [PubMed] [Google Scholar]
- Overman RR. Reversible cellular permeability alterations in disease. In vivo studies on sodium, potassium and chloride concentrations in erythrocytes of the malarious monkey. Am J Physiol. 1948;152:113–121. doi: 10.1152/ajplegacy.1947.152.1.113. [DOI] [PubMed] [Google Scholar]
- Pandey K, Ferreira PE, Ishikawa T, Nagai T, Kaneko O, Yahata K. Ca(2+) monitoring in Plasmodium falciparum using the yellow cameleon-Nano biosensor. Sci Rep. 2016;6:23454. doi: 10.1038/srep23454. [DOI] [PMC free article] [PubMed] [Google Scholar]
- Pillai AD, Addo R, Sharma P, Nguitragool W, Srinivasan P, Desai SA. Malaria parasites tolerate a broad range of ionic environments and do not require host cation remodeling. Mol Microbiol. 2013;88:20–34. doi: 10.1111/mmi.12159. [DOI] [PMC free article] [PubMed] [Google Scholar]
- Pillai AD, Nguitragool W, Lyko B, Dolinta K, Butler MM, Nguyen ST, et al. Solute restriction reveals an essential role for clag3-associated channels in malaria parasite nutrient acquisition. Mol Pharmacol. 2012;82:1104–1114. doi: 10.1124/mol.112.081224. [DOI] [PMC free article] [PubMed] [Google Scholar]
- Pillai AD, Pain M, Solomon T, Bokhari AA, Desai SA. A cell-based high-throughput screen validates the plasmodial surface anion channel as an antimalarial target. Mol Pharmacol. 2010;77:724–733. doi: 10.1124/mol.109.062711. [DOI] [PMC free article] [PubMed] [Google Scholar]
- Rohrbach P, Friedrich O, Hentschel J, Plattner H, Fink RH, Lanzer M. Quantitative calcium measurements in subcellular compartments of Plasmodium falciparum-infected erythrocytes. J Biol Chem. 2005;280:27960–27969. doi: 10.1074/jbc.M500777200. [DOI] [PubMed] [Google Scholar]
- Sherling ES, Knuepfer E, Brzostowski JA, Miller LH, Blackman MJ, van Ooij C. The Plasmodium falciparum rhoptry protein RhopH3 plays essential roles in host cell invasion and nutrient uptake. Elife. 2017;6:e23239. doi: 10.7554/eLife.23239. [DOI] [PMC free article] [PubMed] [Google Scholar]
- Sidik SM, Hortua Triana MA, Paul AS, El BM, Hackett CG, Tran F, et al. Using a genetically encoded sensor to identify inhibitors of Toxoplasma gondii Ca2+ signaling. J Biol Chem. 2016;291:9566–9580. doi: 10.1074/jbc.M115.703546. [DOI] [PMC free article] [PubMed] [Google Scholar]
- Staines HM, Chang W, Ellory JC, Tiffert T, Kirk K, Lew VL. Passive Ca(2+) transport and Ca(2+)-dependent K(+) transport in Plasmodium falciparum-infected red cells. J Membr Biol. 1999;172:13–24. doi: 10.1007/s002329900579. [DOI] [PubMed] [Google Scholar]
- Stauffer TP, Guerini D, Carafoli E. Tissue distribution of the four gene products of the plasma membrane Ca2+ pump. A study using specific antibodies. J Biol Chem. 1995;270:12184–12190. doi: 10.1074/jbc.270.20.12184. [DOI] [PubMed] [Google Scholar]
- Steinberg TH, Newman AS, Swanson JA, Silverstein SC. Macrophages possess probenecid-inhibitable organic anion transporters that remove fluorescent dyes from the cytoplasmic matrix. J Cell Biol. 1987;105:2695–2702. doi: 10.1083/jcb.105.6.2695. [DOI] [PMC free article] [PubMed] [Google Scholar]
- Takuwa N, Zhou W, Takuwa Y. Calcium, calmodulin and cell cycle progression. Cell Signal. 1995;7:93–104. doi: 10.1016/0898-6568(94)00074-l. [DOI] [PubMed] [Google Scholar]
- Tallarida RJ. Drug synergism: its detection and applications. J Pharmacol Exp Ther. 2001;298:865–872. [PubMed] [Google Scholar]
- Tanabe K, Mikkelsen RB, Wallach DF. Calcium transport of Plasmodium chabaudi-infected erythrocytes. J Cell Biol. 1982;93:680–684. doi: 10.1083/jcb.93.3.680. [DOI] [PMC free article] [PubMed] [Google Scholar]
- Tilley L, Sougrat R, Lithgow T, Hanssen E. The twists and turns of Maurer’s cleft trafficking in P. falciparum-infected erythrocytes. Traffic. 2008;9:187–197. doi: 10.1111/j.1600-0854.2007.00684.x. [DOI] [PubMed] [Google Scholar]
- Varecka L, Peterajova E, Pogady J. Inhibition by divalent cations and sulphydryl reagents of the passive Ca2+ transport in human red blood cells observed in the presence of vanadate. Biochim Biophys Acta. 1986;856:585–594. doi: 10.1016/0005-2736(86)90151-3. [DOI] [PubMed] [Google Scholar]
- Wasserman M, Alarcon C, Mendoza PM. Effects of Ca++ depletion on the asexual cell cycle of Plasmodium falciparum. Am J Trop Med Hyg. 1982;31:711–717. doi: 10.4269/ajtmh.1982.31.711. [DOI] [PubMed] [Google Scholar]
- Weiss GE, Gilson PR, Taechalertpaisarn T, Tham WH, de Jong NW, Harvey KL, et al. Revealing the sequence and resulting cellular morphology of receptor-ligand interactions during Plasmodium falciparum invasion of erythrocytes. PLoS Pathog. 2015;11:e1004670. doi: 10.1371/journal.ppat.1004670. [DOI] [PMC free article] [PubMed] [Google Scholar]
- Zhang JH, Chung TD, Oldenburg KR. A simple statistical parameter for use in evaluation and validation of high throughput screening assays. J Biomol Screen. 1999;4:67–73. doi: 10.1177/108705719900400206. [DOI] [PubMed] [Google Scholar]
- Zipprer EM, Neggers M, Kushwaha A, Rayavara K, Desai SA. A kinetic fluorescence assay reveals unusual features of Ca++ uptake in Plasmodium falciparum-infected erythrocytes. Malar J. 2014;13:184. doi: 10.1186/1475-2875-13-184. [DOI] [PMC free article] [PubMed] [Google Scholar]
Associated Data
This section collects any data citations, data availability statements, or supplementary materials included in this article.
Supplementary Materials
Fig S1 Immunoblots showing sulfo-NHS-LC-LC-biotin labeling of intracellular hemoglobin in infected cells (15 kDa band). ISG-21, added during the labeling, inhibits sulfo-NHS-LC-LC-biotin uptake, indicating that this NHS ester enters infected cells via PSAC; addition of ISG-21 during labeling ensures that only exposed sites on surface proteins are labeled. Other cytosolic proteins are also labeled, but are not apparent in these blots because they are much less abundant.
Fig S2 Ca++ uptake into parasites freed from their host cells. Panels at left show 12 h fluorescence kinetics using saponin-freed trophozoites in HBS with 1 mm free Ca++ or 0.5 mM EGTA (top panel); subsequent panels show block by indicated inhibitors. Confocal images on right show fluorescence development in standard culture medium supplemented with 1 mM Ca++ and each inhibitor at a 25 μM concentration. Positive and negative controls (DMSO alone and 0.5 mM EGTA, respectively) are shown in the top two rows. Scale bar in each row, 3 μm.