Abstract
Purpose
Cerebral palsy (CP) is a disorder characterized by an increased muscle stiffness that can be contingent on both neurological and biomechanical factors. The neurological aspects are related to hyper-excitability of the stretch reflex, while the biomechanical factors are related to modifications in muscle structure. We used smart-shear wave elastography (S-SWE) to analyze muscle properties and to compare shear wave speed in soleus muscles of patients affected by CP and typically developing children.
Methods
We enrolled 21 children (15 males and 6 females; age range 3–16) with spastic hemiplegia CP and 21 healthy children (11 males and 10 females; age range 3–14). Measurements of soleus S-SWE were performed using a Samsung RS80A ultrasound scanner with Prestige equipment (Samsung Medison Co. Ltd., Seoul, Korea), with a convex array transducer (CA1-7; Samsung Medison Co. Ltd., Seoul, Korea). For each CP child clinical assessment included Modified Ashworth Scale (MAS) score.
Results
Children with CP showed greater S-SWE values than the healthy ones (p < 0.001). Our data suggest a significant correlation between the S-SWE values and the MAS scores (Spearman correlation coefficient 0.74; p < 0.001 at Kruskal–Wallis test) in children with CP.
Conclusions
Measuring muscle properties with SWE, a non-invasive and real-time technique, may integrate the physical exam. SWE may be a reliable clinical tool for diagnosis and longitudinal monitoring of muscle stiffness, as well as particularly suitable for grading and for assessing the response to treatments.
Keywords: Elastosonography, Shear wave, Cerebral palsy, Radiology, Muscle, Physiatry
Sommario
Obiettivo
La paralisi cerebrale infantile (PCI) è un disturbo caratterizzato da un aumento del tono muscolare che dipende da fattori sia neurologici che biomeccanici. I primi comprendono un’aumentata eccitabilità del riflesso di stiramento; la componente biomeccanica è correlata a modifiche nella struttura muscolare. Abbiamo usato l’elastosonografia con tecnologia Smart-Shear Wave (S-SWE) per analizzare le proprietà del muscolo e per comparare la velocità dell’onda di taglio nei muscoli solei di pazienti affetti da PCI con quella misurata nei soggetti sani.
Metodi
Sono stati arruolati 21 bambini (15 maschi e 6 femmine; range di età 3–16 anni) con emiplegia spastica da esiti di PCI e 21 bambini sani (11 maschi e 10 femmine; range di età 3–14 anni). Le misurazioni S-SWE del soleo sono state effettuate usando un ecografo RS80 with Prestige (Samsung Medison Co. Ltd., Seoul, Korea), con una sonda convex (CA1-7; Samsung Medison Co. Ltd., Seoul, Korea). Per ogni paziente affetto da PCI è stato valutato anche il punteggio della Modified Ashworth Scale (MAS).
Risultati
I bambini affetti da PCI hanno mostrato valori di S-SWE più alti rispetto ai controlli sani (p < 0.001). I nostri dati suggeriscono una correlazione significativa tra i valori di S-SWE e i punteggi della MAS nei pazienti affetti da PCI (coefficiente di correlazione di Spearman 0.74; p < 0.001 al Kruskal–Wallis test).
Conclusioni
La misurazione delle proprietà elastiche dei muscoli mediante S-SWE, una metodica real-time e non invasiva, può integrare l’esame clinico. La S-SWE può essere uno strumento clinico affidabile per la diagnosi e per il follow-up della stiffness muscolare, particolarmente adatto per definirne il grado e per valutarne la risposta ad un trattamento.
Background
Cerebral palsy (CP) is a neurological disorder caused by a non-progressive brain injury or malformation that occurs while the child’s brain is under development. CP is the most common of all childhood disabilities; the reported prevalence is 2.0–3.0 per 1000 live births [1]. Spasticity is the dominant symptom in the majority of children with CP and it refers to a velocity-dependent abnormally high muscle tone (hypertonia or active muscle stiffness) resulting from hyper-excitability of the stretch reflex [2]. Despite the spasticity possibly having a positive effect in children with CP, due to compensation for muscle weakness, it can also affect mobility control, function, and activity. Furthermore, the increased muscle tone may alter the musculoskeletal development of children with CP, leading to muscle shortening (passive muscle stiffness), torsional deformities, joint dislocations, and scoliosis. Measurement of spasticity is a complex and vexed issue; methods that are easily used in practice are clinical ordinal scales, such as the Ashworth Scale (AS), the Modified Ashworth Scale (MAS) [3], the Tardieu Scale and the Modified Tardieu Scale, that still lack reliability and do not allow to distinguish between active and passive muscle stiffness. Dynamometry is an objective way to measure the force required to move a joint, so it could be suggestive of passive muscular stiffness; however, dynamometry is a complex technique and is affected by stiffness of soft tissues others than muscles [4–6]. Advances in ultrasound elastography techniques provide an opportunity for direct quantification of passive muscle stiffness.
Ultrasound (US) elastography is a non-invasive imaging technique that can evaluate and display tissue displacement (i.e., strain) or stiffness in response to the application of a given force: stiff tissues tend to deform less and show less strain than compliant tissues [7].
All elastography techniques rely on the same basis: an external force is applied to the studied tissue and the resulting movements are then detected. There are several elastosonography methods available depending on the method of stress application and the objectives [8], and each one presents different limits: transient elastography does not grant an accurate anatomic targeting because it does not provide a B-mode image; though acoustic radiation force impulse imaging provides a grayscale image, the region of interest (ROI) is small, and fixed at a depth of 4 cm [9]; real-time strain elastography, that can produce the tissue elastogram and B-mode image simultaneously, is the most commonly used method, but it is operator dependent and cannot calculate the absolute elastic modulus [10, 11].
Actually, shear wave elastography (SWE) represents an operator-independent, relatively reproducible, and quantitative method useful for the evaluation of muscle [12], in spite of the size, shape, and depth limitations of the currently available ROI [2].
The SWE methods use an acoustic pulse to produce shear waves, propagating perpendicularly to and much slower (∼ 1–50 m/s) than the longitudinal ultrasound (US) waves (∼ 1500 m/s) [13, 14].
Then, shear waves are detected and measured within a limited distance; their velocity is faster in harder than in softer tissues [13, 14].
The relationship between the applied force and resulting strain is determined by Young’s modulus, a parameter that quantifies tissue elasticity; the harder the tissue is, the higher Young’s modulus (elasticity) will be. Tissue elasticity can be quantified by Young’s modulus as pressure in kilopascals (kPa) or by shear wave velocity in meters/second (m/s) [13, 14].
The smart-shear wave elastography (S-SWE), installed on the Samsung RS80A Prestige US scanner, is a particular type of point-SWE. In this technique, a localized transient displacement is generated using an ARFI. It creates a transient shear wave spreading with cylindrical symmetry away from the pushing-beam’s axis and focus, which is strongest at the depth of the pushing-beam’s focus [14]. The shear displacement propagates along the ultrasound imaging beam, so the small displacements of the shear wave are measured and its time of arrival at lateral positions of the ROI is detected [14, 15]. In particular, S-SWE enables to place freely the ROI with a fixed height of 1 cm. The width is automatically adjusted depending of the measurement depth. If the ROI is placed in an invalid position, the color of the box changed to orange [15]. The measurements were expressed in kPa. The method had an only performance index, called “Reliability Measurement Index” (RMI), calculated by the weighted sum of the residual of the wave equation and the magnitude of the shear wave. RMI range is from 0.0 ± 1.0 and, in characterizing diffuse liver disease, a standardized value of 0.5 or higher is considered acceptable and correlates with reproducible measurements, according to the manufacturer [15].
This value is used to filter out unreliable measurements and results in performance improvement of shear wave elastography.
The possibility to obtain objective measurements of muscle stiffness in children with cerebral palsy may provide an ideal support for diagnosis, staging and therapeutic monitoring. For these reasons, the aims of this study were (1) to compare the passive muscle stiffness, measured by means of ultrasound shear wave elastography (SWE), in children with CP and in typically developing children and (2) to analyze the statistical relationship (correlation coefficient) between the passive muscle stiffness measured by means of SWE and the MAS scoring.
Methods
Participants
A total of 21 children (15 males and 6 females; age range 3–16) with spastic hemiplegia cerebral palsy were enrolled in the present study. Patients were recruited from Department of Rehabilitation Medicine at University “Federico II” of Naples. Informed consent was obtained from all individual participants’ parents or legal tutors included in the study. The exclusion criteria were: (1) previous ankle or knee surgery; (2) pharmacological treatment of spasticity in the past 6 months or during the study (BTX-A injections, GABAergic medications, benzodiazepines, or muscle relaxants); (3) walking inability (assisted or unassisted). Children with cerebral palsy were compared to a group of 21 typically developing children (11 males and 10 females; age range 3–14).
Study methods
Some demographic information was collected for each child: date of birth, weight, height, sex, medical and surgical history and medications.
Measurements of soleus S-SWE were performed using a Samsung RS80A ultrasound scanner with Prestige equipment (Samsung Medison Co. Ltd., Seoul, Korea), with a convex array transducer (CA1-7; Samsung Medison Co. Ltd., Seoul, Korea). For the S-SWE measurements, each child was positioned prone with feet dangling over the edge of the examination table.
Circumferential measurements of each calf were obtained by a tape, and the area of the greatest muscle bulk was marked on the skin.
The ultrasound transducer was positioned at the mid-belly region of each soleus and the distance from the fibular head to the proximal end of the ultrasound probe was measured and recorded, to ensure an appropriate placement of the probe for the repeated measures.
The region of interest, from which the SW velocities were measured, was placed over the mid-region of the muscle belly on the third medium of the soleus (the point was located at the proximal one-third of a longitudinal line from the midway between the medial and the lateral epicondyles and the calcaneal tuberosity), over the area of greatest muscle bulk. The transducer was aligned transversally to the direction of the muscle fiber. B-mode imaging was used to confirm the correct placement of the transducer. The transducer was held in place with minimal pressure on the skin.
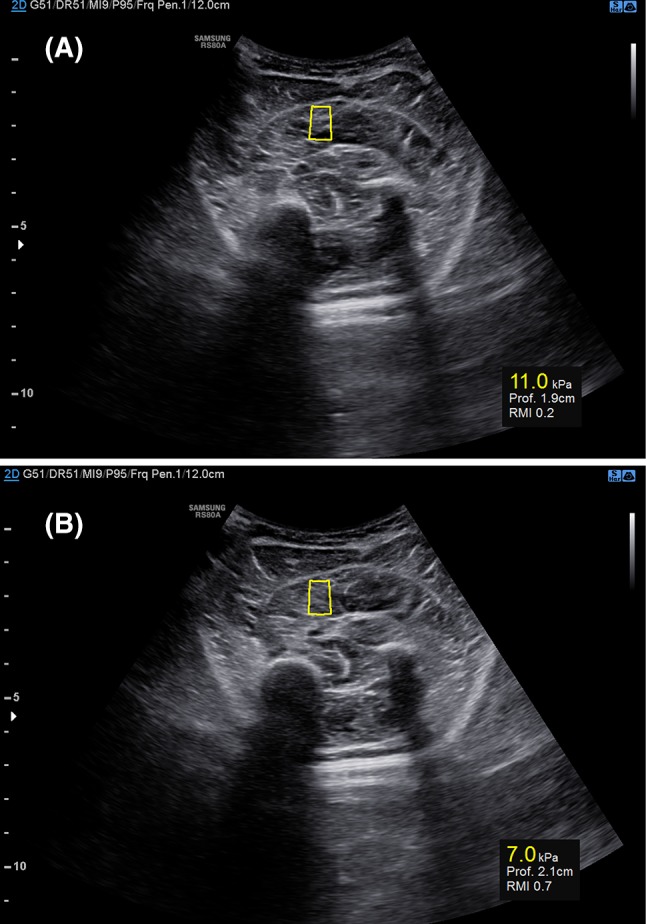
A region of interest (ROI) over the soleus muscle was selected so that muscle fascial borders, tendon, and blood vessels were excluded. Since in musculoskeletal applications, there are no standardized RMI values recommended, we decided to comply with the same conditions suggested by the manufacturer for the liver disease, considering acceptable only the measurements with RMI values equal or higher than 0.5 (Fig. 1).
Fig. 1.

a Samsung S-shearwave elastography assessed on the soleus of a child with CP. The yellow box (center) represents the shear wave measurement area. The ROI depth and the RMI (reliability measurement index) are expressed below. a The elasticity measurement (11.0 kPa) is not reliable given that the RMI is equal to 0.2. b The elasticity value (7.0 kPa) is reliable since RMI measures 0.7
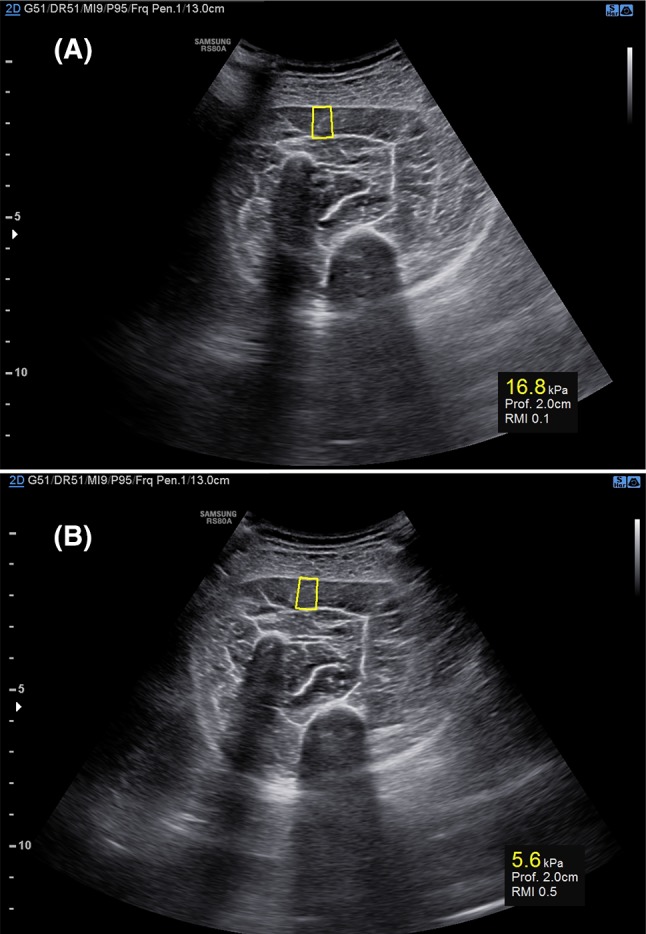
Each child of both groups received a unilateral S-SWE evaluation, performed on the affected soleus of children with CP, on one soleus, chosen randomly, in TD children (Fig. 2). CP group also received clinical evaluation including MAS score assessment for the ankle, performed with the children in supine position with un-flexed knees.
Fig. 2.

a Samsung S-shearwave elastography assessed on the soleus of a TD child. The yellow box (center) represents the shear wave measurement area. The ROI depth and the RMI (reliability measurement index) are expressed below. a The first measurement cannot be considered reliable (16.8 kPa) since RMI measures 0.0. b The second elasticity measurement (7.0 kPa) is considered reliable since RMI measures 0.5
Statistical analysis
Concerning the S-SWE measurements, the normality of the variable distribution has been verified using the Q–Q plot, which suggested that data might not be normally distributed (Fig. 3). Consequently, median and interquartile range have been used for data summary; further, intergroup comparisons of the S-SWE values between both comparative groups were performed using the non-parametric Wilcoxon–Mann–Whitney test. Statistical analysis was performed using 99% confidence intervals and the level of significance was set at p < 0.001.
Fig. 3.
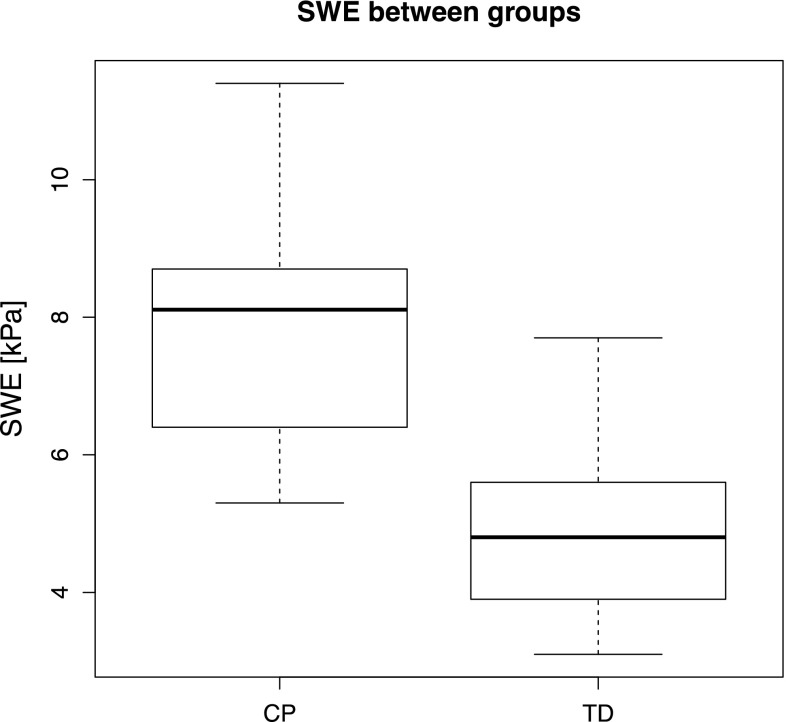
Boxplot of the distributions of SWE for the two groups analyzed (CP cerebral palsy, TD typically developing). The bold line inside the box indicates the median value
To assess the relationship between the S-SWE values and the MAS scores, a Spearman correlation coefficient has been used. Moreover, a non-parametric Kruskal–Wallis test has been used to investigate the relationship between S-SWE values and MAS scores.
Statistical analysis has been performed in R [R Core Team (2014). R: a language and environment for statistical computing. R foundation for statistical Computing, Vienna, Austria. URL http://www.R-project.org].
Results
A statistically significant difference between the S-SWE of the two groups was found (p < 0.001). In particular, the median ± interquartile range of S-SWE values for the CP group was 8.1 ± 2.3 kPa compared to the TD group having 4.8 ± 1.7 kPa.
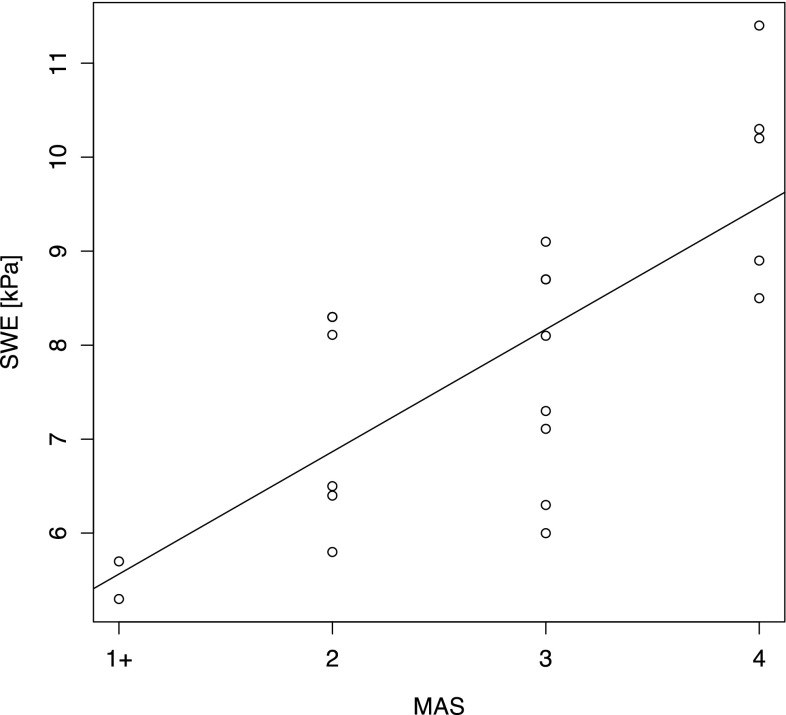
Concerning the relationship between S-SWE values and the MAS scores, the Spearman correlation coefficient was 0.74 (CI 0.33–0.91) suggesting a high positive correlation between these variables (Fig. 4). Further, the Kruskal–Wallis test confirmed (p < 0.001) the difference between S-SWE medians among the different MAS scores.
Fig. 4.
Relationship between MAS groups and SWE. For exemplification purposes a linear regression trend has been superimposed
Discussion
Using S-SWE, we demonstrated objectively that the shear waves spread faster in the affected muscles rather than in the healthy ones. This difference is caused by the higher stiffness characterizing the limbs of CP patients. There are many factors that may contribute to increase stiffness in CP patients. In particular, the spasticity has neural and biomechanical components, where the latter is related to muscle stiffness. Several studies demonstrated that it is probably influenced by titin and collagen content in the spastic muscle [16]. The increased stiffness in CP children muscles was hypothesized to arise from titin, considered the major passive load-bearing protein within the muscle tissue [17]. There is also potential for a fibrosis induced from spasticity to lead directly to a limitation of longitudinal growth; skeletal muscle fibrosis could impede muscle regeneration by forming a mechanical barrier to this process [18, 19]. It seems that in spastic muscles increased passive stiffness is caused by increased amounts of collagen in the extracellular matrix of muscle fiber bundles [20].
US and SWE techniques seem to be ideal tools to investigate these biomechanical muscle properties. Actually US elastography has been established as an excellent diagnostic method for evaluating the biomechanical properties in liver fibrosis, breast cancer, and thyroid cancer. Furthermore, in the musculoskeletal field, many research studies have been conducted on sonoelastography since the early 1990s but only recently it has been applied to clinical practice [20–22]. The use of SWE to study muscles has increased exponentially in the last few years, in particular research studies have been conducted in the evaluation of myopathy, chronic stroke and also of cerebral palsy patients [23–25].
The results of our study come in agreement with those of Lee et al. and Brandenburg et al. [23, 24], showing that SWE values are higher in CP patients muscles than in TD children ones. In contrast to these studies, our research study was conducted on a larger sample and SWE values were measured on soleus that is deeper than anterior tibialis, medial and lateral gastrocnemius, which were evaluated in the previous studies.
The depth of soleus fits better with S-SWE measurement since ROI placement results invalid at too superficial depth.
Furthermore, our data suggested a correlation between the MAS scores and the S-SWE values, indicating that S-SWE may be used in the clinical routine, representing an objective and reliable tool for diagnostic and therapeutic monitoring purposes.
At first, S-SWE values were measured aligning the transducer both in parallel and transversally to the direction of the muscle fibers. Obtaining RMI values higher than 0.5 resulted very difficult when the transducer was oriented in parallel to the muscle fibers and requested many attempts, reducing the compliance of our little patients. Therefore, S-SWE measurements were performed positioning the transducer transversally to the muscle fibers, complying with RMI values higher than 0.5. Though the sample size of this study is larger than those of Lee et al. and Brandenburg et al. [23, 24], it may be extended further and may investigate the relationship between the SWE values and the demographic features, to identify normal SWE value range depending on age or limb dimensions. Future studies may investigate the reliability and repeatability of the S-SWE when monitoring the effects of medical and physical therapies.
Conclusions
This study demonstrates that muscle stiffness can be measured in a reliable and repeatable way, providing advantages from the advances in US elastography.
Measuring muscle properties with SWE is a non-invasive (with a higher compliance of the patients) and real-time technique and can potentially integrate the physical exam, in contrast with other evaluations of muscle properties that are usually performed with invasive tools (muscle biopsy), complex measurements performed in lab (dynamometry) or, indirectly, with qualitative and operator-dependent clinical scales (MAS, Tardieu Scale).
SWE may be a reliable clinical tool for diagnosis and longitudinal monitoring of muscle stiffness, particularly suitable for grading and for assessing the response to treatments. Furthermore, SWE allows a more objective assessment of muscle stiffness comparing to clinical evaluations that are operator dependent. Our study contributes to validate SWE as a useful, quantitative and repeatable measurement of muscle properties, especially in those clinical conditions characterized by an altered muscle tone.
Conflict of interest
The authors declare that they have no conflict of interest.
Ethical approval
All procedures performed in studies involving human participants were in accordance with the ethical standards of the institutional and/or national research committee and with the 1964 Helsinki declaration and its later amendments or comparable ethical standards.
Human and animal rights
This article does not contain any studies with animals performed by any of the authors.
Informed consent
Informed consent was obtained from all individual participants included in the study.
Contributor Information
E. A. Vola, Email: elena.a.vola@gmail.com
M. Albano, Email: albanoalba@hotmail.it
C. Di Luise, Email: carla.diluise@hotmail.it
V. Servodidio, Email: valerservo@gmail.com
M. Sansone, Email: msansone@unina.it
S. Russo, Email: serghiey@hotmail.com
B. Corrado, Email: bruno.corrado@unina.it
C. Servodio Iammarrone, Email: c.servodio@unina.it
M. G. Caprio, Email: mariagrazia.caprio@ibb.cnr.it
G. Vallone, Email: gianfranco.vallone@libero.it
References
- 1.Ozmen M, Caliskan M, Apak S, Gokcay G. 8 years clinical experience in cerebral palsy. J Trop Pediatr. 1993;39:52–54. doi: 10.1093/tropej/39.1.52. [DOI] [PubMed] [Google Scholar]
- 2.Lance J. Spasticity: disorders motor control. In: Feldman RG, Young RP, Koella WP, editors. Symposium synopsis. Miami, FL: Year Book Medical Publishers; 1980. [Google Scholar]
- 3.Haas B, Bergstrom E, Jamous A, Bennie A. The inter rater reliability of the original and of the modified ashworth scale for the assessment of spasticity in patients with spinal cord injury. Spinal Cord. 1996;34:560–564. doi: 10.1038/sc.1996.100. [DOI] [PubMed] [Google Scholar]
- 4.Mentiplay BF, Perraton LG, Bower KJ, et al. Assessment of lower limb muscle strength and power using hand-held and fixed dynamometry: a reliability and validity study. PLoS One. 2015;10(10):e0140822. doi: 10.1371/journal.pone.0140822. [DOI] [PMC free article] [PubMed] [Google Scholar]
- 5.Stark T, Walker B, Phillips JK, Fejer R, Beck R. Hand-held dynamometry correlation with the gold standard isokinetic dynamometry: a systematic review. PM & R. 2011;3(5):472–479. doi: 10.1016/j.pmrj.2010.10.025. [DOI] [PubMed] [Google Scholar]
- 6.Kolber MJ, Cleland JA. Strength testing using hand-held dynamometry. Phys Therapy Rev. 2005;10(2):99–112. doi: 10.1179/108331905X55730. [DOI] [Google Scholar]
- 7.Choi YJ, et al. Ultrasound elastography for evaluation of cervical lymph nodes. Ultrasonography. 2015;34(3):157–164. doi: 10.14366/usg.15007. [DOI] [PMC free article] [PubMed] [Google Scholar]
- 8.Ryu J, Jeong WK. Current status of musculoskeletal application of shear wave elastography. Ultrasonography. 2017;36:185–197. doi: 10.14366/usg.16053. [DOI] [PMC free article] [PubMed] [Google Scholar]
- 9.Klauser AS, Miyamoto H, Bellmann-Weiler R, Feuchtner GM, Wick MC, Jaschke WR. Sonoelastography: musculoskeletal applications. Radiology. 2014;272:622–633. doi: 10.1148/radiol.14121765. [DOI] [PubMed] [Google Scholar]
- 10.Drakonaki EE, Allen GM, Wilson DJ. Ultrasound elastography for musculoskeletal applications. Br J Radiol. 2012;85:1435–1445. doi: 10.1259/bjr/93042867. [DOI] [PMC free article] [PubMed] [Google Scholar]
- 11.Kim SJ, Park HJ, Lee SY. Usefulness of strain elastography of the musculoskeletal system. Ultrasonography. 2016;35:104–109. doi: 10.14366/usg.15072. [DOI] [PMC free article] [PubMed] [Google Scholar]
- 12.Arda K, Ciledag N, Aktas E, Aribas BK, Kose K. Quantitative assessment of normal soft-tissue elasticity using shear-wave ultrasound elastography. AJR Am J Roentgenol. 2011;197:532–536. doi: 10.2214/AJR.10.5449. [DOI] [PubMed] [Google Scholar]
- 13.Gennisson JL, Deffieux T, Fink M, Tanter M. Ultrasound elastography: principles and techniques. Diagn Interv Imaging. 2013;94:487–495. doi: 10.1016/j.diii.2013.01.022. [DOI] [PubMed] [Google Scholar]
- 14.Bamber J, Cosgrove D, Dietrich CF, Fromageau J, Bojunga J, Calliada F, Cantisani V, Correas JM, D’Onofrio M, Drakonaki EE, Fink M, Friedrich-Rust Gilja OH, Havre RF, Jenssen C, Klauser AS, Ohlinger R, Saftoiu A, Schaefer F, Sporea I, Piscaglia F. EFSUMB guidelines and recommendations on the clinical use of ultrasound elastography. Part 1: Basic principles and technology. Ultraschall Med. 2013;34:169–184. doi: 10.1055/s-0033-1335205. [DOI] [PubMed] [Google Scholar]
- 15.Mulabecirovic A, Mjelle AB, Gilja OH, Vesterhus M, Havre RF. Repeatability of shear wave elastography in liver fibrosis phantoms—evaluation of five different systems. PLoS One. 2018;13(1):e0189671. doi: 10.1371/journal.pone.0189671. [DOI] [PMC free article] [PubMed] [Google Scholar]
- 16.Park D-S, Kwon DR, Park G-Y, Lee MY. Therapeutic effect of extracorporeal shock wave therapy according to treatment session on gastrocnemius muscle spasticity in children with spastic cerebral palsy: a pilot study. Ann Rehabilit Med. 2015;39(6):914–921. doi: 10.5535/arm.2015.39.6.914. [DOI] [PMC free article] [PubMed] [Google Scholar]
- 17.Prado LG, Makarenko I, Andresen C, Kruger M, Opitz CA, Linke WA. Isoform diversity of giant proteins in relation to passive and active contractile properties of rabbit skeletal muscles. J Gen Physiol. 2005;126:461–480. doi: 10.1085/jgp.200509364. [DOI] [PMC free article] [PubMed] [Google Scholar]
- 18.Chen X, Li Y. Role of matrix metalloproteinases in skeletal muscle: migration, differentiation, regeneration and fibrosis. Cell Adhes Migr. 2009;3:337–341. doi: 10.4161/cam.3.4.9338. [DOI] [PMC free article] [PubMed] [Google Scholar]
- 19.Smith LR, Lee KS, Ward SR, Chambers HG, Lieber RL. Hamstring contractures in children with spastic cerebral palsy result from a stiffer extracellular matrix and increased in vivo sarcomere length. J Physiol. 2011;589:2625–2639. doi: 10.1113/jphysiol.2010.203364. [DOI] [PMC free article] [PubMed] [Google Scholar]
- 20.Cosgrove D, Piscaglia F, Bamber J, Bojunga J, Correas JM, Gilja OH, et al. EFSUMB guidelines and recommendations on the clinical use of ultrasound elastography. Part 2: Clinical applications. Ultraschall Med. 2013;34:238–253. doi: 10.1055/s-0033-1335375. [DOI] [PubMed] [Google Scholar]
- 21.Bortolotto C, Lungarotti L, Fiorina I, Zacchino M, Draghi F, Calliada F. Influence of subjects’ characteristics and technical variables on muscle stiffness measured by shear wave elastosonography. J Ultrasound. 2017;20(2):139–146. doi: 10.1007/s40477-017-0242-9. [DOI] [PMC free article] [PubMed] [Google Scholar]
- 22.Minafra P, Bortolotto C, Rampinini E, Calliada F, Monetti G. Quantitative elastosonography of the myotendinous junction: normal behavior and correlation with a standard measurement system during functional tests. J Ultrasound Med. 2017;36(1):141–147. doi: 10.7863/ultra.15.11023. [DOI] [PubMed] [Google Scholar]
- 23.Brandenburg JE, Eby SF, Song P, Kingsley-Berg S, Bamlet W, Sieck GC, et al. Quantifying passive muscle stiffness in children with and without cerebral palsy using ultrasound shear wave elastography. Dev Med Child Neurol. 2016;58:1288–1294. doi: 10.1111/dmcn.13179. [DOI] [PMC free article] [PubMed] [Google Scholar]
- 24.Lee SS, Gaebler-Spira D, Zhang LQ, Rymer WZ, Steele KM. Use of shear wave ultrasound elastography to quantify muscle properties in cerebral palsy. Clin Biomech. 2016;31:20–28. doi: 10.1016/j.clinbiomech.2015.10.006. [DOI] [PMC free article] [PubMed] [Google Scholar]
- 25.Eby SF, Song P, Chen S, Chen Q, Greenleaf JF, An KN. Validation of shear wave elastography in skeletal muscle. J Biomech. 2013;46(14):2381–2387. doi: 10.1016/j.jbiomech.2013.07.033. [DOI] [PMC free article] [PubMed] [Google Scholar]


