Abstract
Flavokawain B (FKB), a natural kava chalcone, shows potent antitumor activity in various types of cancer, although the mechanism of action remains unclear. In this study, we report that FKB has profound effects on the metabolic state of human thyroid cancer (TCa) cells, leading to high autophagy flux through upregulation of AMP‐activated protein kinase, which in turn inhibits mTOR and activates Beclin‐1 in TCa cells. We further report that the autophagy induced by FKB plays a prosurvival role in TCa cells both in vitro and in vivo. In conclusion, our findings provide evidence that combination treatment with FKB and pharmacological autophagy inhibitors will be a potential therapeutic strategy for the treatment of TCa.
Keywords: apoptosis, autophagy, flavokawain B, metabolism, thyroid cancer
1. INTRODUCTION
Thyroid cancer (TCa) is the most common endocrine malignancy and is increasing in incidence.1 Although the patients with follicular or papillary thyroid cancer have a relatively favorable prognosis, approximately 10% of cases can develop into more aggressive and dedifferentiated forms of TCa, leading to a high risk of locoregional recurrence and metastatic disease.2 Therefore, the development of safe and effective drugs along with novel therapeutic strategies is critically needed.
Natural products have received recent interest in the discovery of novel anticancer therapeutic agents as they have long been used as alternative remedies for a variety of diseases, including cancer, with relatively few side‐effects.3, 4 Flavokawain B (FKB), a natural kava chalcone, has shown anticancer activity in various types of cancer, such as breast, lung, prostate, and bladder cancers.5, 6, 7, 8 The specific antitumor effect of FKB is mainly attributed to induction of apoptotic cell death characterized by nuclear fragmentation, DNA damage, poly(ADP‐ribose) polymerase (PARP) cleavage, and cytochrome C release followed by caspase‐3 and caspase‐9 activation.5, 8, 9, 10
However, whether FKB induces autophagy and the role it plays in cell death in human TCa cells remain largely unclear. Here, our studies show that FKB induces cell death, reduces the invasive potential, and impairs mitochondrial function while simultaneously inducing autophagy in human TCa cells. Autophagy is a conserved cellular pathway that removes dysfunctional or damaged organelles that are digested and recycled for cellular metabolic needs.11 Therefore, autophagy is essential for maintaining homeostasis and it plays a prosurvival role. Previous studies have shown that treatment with autophagy inhibitors such as bafilomycin A1 and chloroquine (CQ) potentiates the effects of several cancer treatments.12, 13 These studies have led to the initiation of multiple clinical trials combining chemotherapeutic agents and autophagy inhibitors for various cancer types.14 However, it has also been proposed that autophagy stimulates a prodeath signal pathway that could function as a backup when apoptosis is disabled.15, 16 Thus, the specific role of autophagy seems to be highly cell‐type‐dependent and context‐dependent. Previous studies have reported that autophagy was regulated by diverse signaling pathways, such as endoplasmic reticulum stress, energy sensor AMP‐activated protein kinase (AMPK), mTOR kinase, and those controlled by class I PI3k–AKT signaling.17, 18 In this study, we showed that FKB activates the AMPK pathway, which in turn inhibits mTOR and activates Beclin‐1, thus leading to high autophagy flux. Furthermore, we found that autophagy induced by FKB plays a cytoprotective role in TCa cells both in vitro and in vivo. Based on our results, FKB is a potential therapeutic agent in the treatment of human TCa and combination therapy with FKB and autophagy inhibitors might represent a promising avenue with higher efficacy for TCa patients.
2. MATERIALS AND METHODS
2.1. Cell lines and cultures
Human TCa cell lines (ARO, WRO, and TPC‐1) were purchased from the Chinese Academy of Sciences Cell Bank (Shanghai, China). ARO, WRO, and TPC‐1 cells have been recently authenticated through cross‐species checks, DNA fingerprinting, and quarantine. Cells were grown in DMEM (SH30022.01B; Gibco, GE Healthcare Life Sciences, Pittsburgh, PA, USA) supplemented with 10% FBS (10082147; Hyclone, GE Healthcare Life Sciences) in a humidified incubator with 5% CO2 at 37°C.
2.2. Cell viability and proliferation assays
Cell viability was assessed with the CCK‐8 (CK04‐500; Dojindo, Kumamoto, Japan). Thyroid cancer cells (1.0 × 10⁴ cells/well) were seeded into 96‐well plates. After the desired treatment, cells were incubated for an additional 4 h at 37°C with 10 μL CCK‐8 in 100 μL serum‐free DMEM. The absorbance at 450 nm was measured using a microplate reader (Bio‐Rad, Hercules, CA USA). Proliferation was assessed using the EdU incorporation assay according to the manufacturer's protocol (C103103; Ribobio, Guangzhou, China). The percentage of labeled cells (ratio: EdU+/DAPI+ × 100%) was determined using images taken for four random fields per sample under fluorescence.
2.3. Flow cytometric analysis of apoptosis
The TCa cells were harvested and resuspended in a binding buffer. Cells were then stained with annexin V‐FITC (BD Biosciences, San Jose, CA, USA) according to the manufacturer's instructions. Cells were analyzed by a flow cytometry (NovoCyte; ACEA, San Diego, CA, USA), and the data were analyzed with FlowJo Software (Tree Star, Ashland, OR, USA).
2.4. Cell migration and invasion assays
Cell migration was assessed in wound healing assays. A cell‐free gap was generated by scratching the cell monolayer with a 200‐μL pipette tip, and images used for analysis were captured under a light microscope at 0 and 12 h. Cell invasion was examined using the Transwell chamber assay. The bottom of the Transwell membrane was pretreated with Matrigel (Becton‐Dickinson, Bedford, MA, USA) for 4 h. Cells (5 × 10⁴) were resuspended in serum‐free DMEM and seeded into the upper chamber of a Transwell apparatus (8.0‐μm pore; Corning, Kennebunk, ME, USA). DMEM containing 10% FBS (600 μL) was added to the lower chamber, and chambers were incubated at 37°C for 12 h. The cytoskeleton changes in TCa cells were visualized using rhodamine phalloidin (Cytoskeleton, Denver, MA, USA), and the cells were examined under a fluorescence microscope.
2.5. Measurement of ATP levels, mitochondrial membrane potential (Δψm), and mitochondrial morphology
Serum samples of the cells were collected, and the total ATP levels were determined using the CellTiter‐Glo luminescent assay (Promega, Madison, WI, USA) according to the manufacturer's instructions. To determine Δψm measurements, the cells were loaded with 50 nmol/L tetramethylrhodamine methyl ester 5, 5, 6, 6‐tetrachloro‐1, 1, 3, 3‐tetraethylbenzimidazolylcarbocyanineiodide (JC‐1) for 30 min according to the manufacturer's protocol. Fluorescence was measured using a microplate reader, and the fluorescence intensity ratio of JC‐1 aggregates to JC‐1 monomers (ratio of 590 nm : 530 nm emission intensities) was used to determine the Δψm. Cells were examined under an Olympus BX61 fluorescence microscope, and images were acquired using a DP71 charge‐coupled device digital camera (Olympus, Waltham, MA, USA).
2.6. Western blotting
Protein concentrations were determined using the BCA method (23225; Beyotime, Shanghai, China). Proteins (20 μg) were separated on 8–15% SDS‐PAGE and transferred onto PVDF membranes (ISEQ00010 0.22 μm; Millipore, Billerica, MA USA). Membranes were blocked for 2 h at room temperature with 5% non‐fat dry milk in TBST, incubated with primary antibodies overnight at 4°C, and probed with HRP‐conjugated secondary antibody (1:5000; Santa Cruz Biotechnology, Dallas, TX, USA) for 1 h at room temperature. Proteins were visualized with enhanced chemiluminescence (Millipore) and the ChemiDoc Touch detection system (Bio‐Rad). The following primary antibodies were used: rabbit anti‐PARP, cleaved caspase‐3, microtubule associated protein 1 light chain 3 beta (LC3B), sequestosome 1 (p62), AMPK, phosphorylated‐ (p‐)AMPK (Thr172), mTOR, p‐mTOR (Ser2448), Beclin‐1, p‐Beclin‐1 (Ser93), GAPDH (Cell Signaling Technology, Danvers, MA, USA).
2.7. Transmission electron microscopy
Cells were fixed with 4% glutaraldehyde and postfixed with 1% OsO4 in 0.1 mol/L cacodylate buffer containing 0.1% CaCl2 for 2 h at 4°C. The samples were then stained with 1% Millipore‐filtered uranyl acetate, dehydrated in increasing concentrations of ethanol, infiltrated, and embedded in LX‐112 medium (Ladd Research Industries, Williston, VT, USA). After polymerization of the resin at 60°C for 48 h, ultrathin sections were cut with an ultra‐cut microtome (Leica, Allendale, NJ, USA). Sections were stained with 4% uranyl acetate and lead citrate, and images were obtained using a JEM‐100cx II electron microscope (JEM‐1200EX II, JEOL, Tokyo, Japan).
2.8. Constructs, transfection, and lentiviral infection
GFP‐LC3 (pBABEpuro, 22405)‐expressing vectors were obtained from Addgene (Cambridge, MA, USA). Lentiviral supernatants were prepared according to the manufacturer's instructions and provided by GenePharma (Shanghai, China). Lentiviral infections were carried out accordingly. After treatment, we counted the number of autophagic cells indicated by GFP‐LC3 dots (≥3 dots as a positive cell) [42]. Pictures were scanned with a DP71 charge‐coupled device digital camera (Olympus).
2.9. Small interfering RNAs
Gene‐specific siRNAs and one non‐targeting siRNA were synthesized from GenePharma. ATG5#1 and ATG5#2 siRNAs target the sequences 5′‐CCT TTG GCC TAA GAA GAA A‐3′ and 5′‐CAT CTG AGC TAC CCG GAT A‐3′, respectively; ATG7 #1 and ATG7 #2 siRNAs target the sequences 5′‐GGA GTC ACA GCT CTT CCT T‐3′ and 5′‐CAG CTA TTG GAA CAC TGT A‐3′, respectively; Beclin1 siRNA targets the sequences 5′‐GGA AGC TCA GTA TCAGAGA‐3′; and AMPKα1 siRNA targets the sequence 5′‐GAGGAGAGC TAT TTG ATT A‐3′. The non‐targeting control siRNA targets the sequence 5′‐UUCUCCGAACGUGUCACGUTT‐3′.
2.10. Animal studies
Athymic mice (male, 4 weeks old, 20–30 g) were provided by Shanghai SLAC Laboratory Animal Co. (Shanghai, China). The mice were randomly divided into four groups (control group, n = 5; FKB group, n = 5; CQ group, n = 5; and FKB+CQ group, n = 5). WRO cells (2 × 10⁶) in 100 μL serum‐free DMEM were inoculated s.c. into the right flanks of the mice. Mice were treated with PBS alone (control), FKB (50 mg/kg/day), CQ (25 mg/kg/day), and FKB (50 mg/kg/day) plus CQ (25 mg/kg/day) every other day starting on day 3. Tumor volume was measured every third day with calipers and calculated as (length × width2)/2. Mice were killed after 18 days. All animal procedures were approved by the Institutional Animal Care and Use Committee of Shandong University (Jinan, China).
2.11. Cell apoptosis assay and immunohistochemistry
The TUNEL assay was carried out using the In Situ Cell Death Detection Kit, TMR Green (Roche, Basel, Switzerland) following the manufacturer's recommendations. After labeling, the slides were counterstained with DAPI and visualized under a fluorescence microscopy. For immunohistochemistry, heat‐induced epitope retrieval was undertaken with a microwave in 10 mmol/L citric acid buffer. The samples were incubated at 4°C overnight with the primary antibody (rabbit anti‐Ki67, 1:200 dilution; Cell Signaling Technology). Next, the sections were incubated with HRP‐linked goat anti‐rabbit, followed by reaction with diaminobenzene and counterstaining with Mayer's hematoxylin.
2.12. Statistical analysis
Three independent experiments were carried out, and results are expressed as the mean ± SD. Data were compared using paired t‐tests in GraphPad Prism 5 software (San Diego, CA, USA), and P‐values determined from different comparisons are indicated as: *P < 0.05, **P < 0.01, ***P < 0.001.
3. RESULTS
3.1. Flavokawain B inhibits growth of TCa cells
To begin to determine whether FKB might be effective against TCa cells, FKB treatment was first evaluated in three human TCa cell lines, ARO, WRO, and TPC‐1 cells in vitro, using the CCK‐8 assay. We found that FKB effectively decreased the proliferation of the indicated cells in a dose‐ and time‐dependent manner (Fig. 1A).
Figure 1.
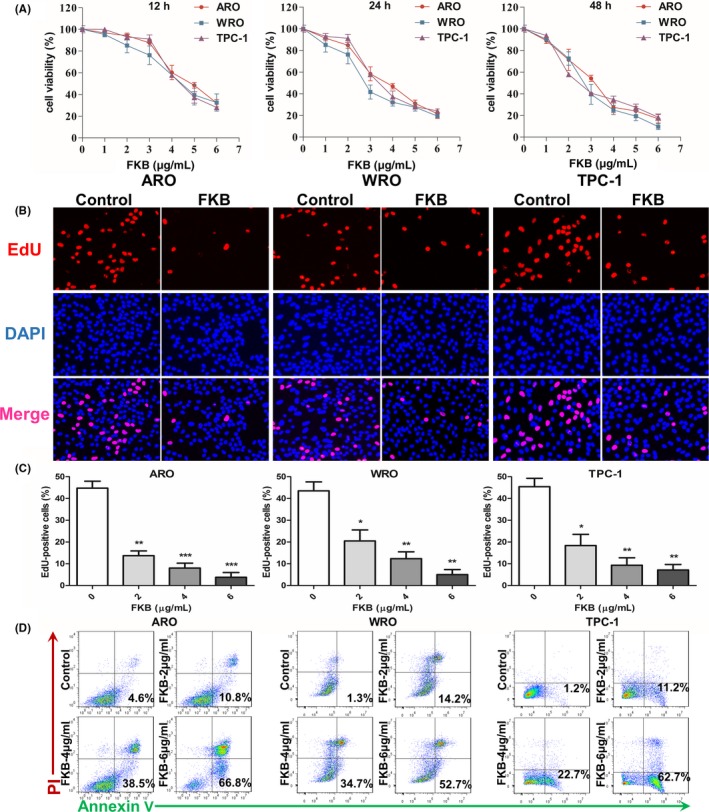
Flavokawain (FKB) inhibits the growth of thyroid cancer cells. (A) Viability as determined in CCK‐8 assays carried out on ARO, WRO, and TPC‐1 cells treated with different concentrations of FKB for 12, 24, and 48 h. Results are presented as a percentage (%) relative to untreated cells at that time point. (B) Fluorescent images of EdU incorporation in ARO, WRO, and TPC‐1 cells treated with FKB or DMSO for 24 h. Cells were stained with Apollo 567 (red) to detect EdU and DAPI (blue) to highlight nuclei, and images were superimposed. (C) Cell number and EdU content of ARO, WRO, and TPC‐1 cells treated with different concentrations of FKB for 24 h. Percentage of EdU+ cells (EdU+/DAPI+ ×100%) was determined in four random fields per sample. All data are expressed as the mean ± SD. *P < 0.05; **P < 0.01; ***P < 0.001. (D) Flow cytometric analysis of annexin V/propidium iodide (PI) staining for the determination of apoptosis in ARO, WRO, and TPC‐1 cells treated with different concentrations of FKB for 24 h
An EdU incorporation assay was used to further evaluate proliferation of TCa cell lines in the presence of FKB. As shown in Figure 1(B,C), there was a statistically significant decrease in proliferation for three cell lines at 24 h after exposure to FKB. Increasing FKB concentrations were more effective, with only partial EdU‐positive cells at 6 μg/mL after 24 h (~5%; P < 0.01).
Flavokawain B induces apoptosis in a variety of cancer cells.19, 20, 21 We therefore determined whether FKB also induces apoptosis of TCa cells. Increases in apoptosis were observed in three cell lines in early (annexin V+/propidium iodide [PI]−) and late (annexin V+/PI+) stages with FKB at 24 h (Fig. 1D). After treatment with indicated concentrations of FKB for 24 h (Fig. S1), cleaved PARP and cleaved caspase‐3 levels were increased in ARO, WRO, and TPC‐1 cells in a dose‐dependent manner.
3.2. Flavokawain B attenuates migration and invasion of TCa cells
To determine whether FKB inhibited migration and invasive properties of TCa cells, wound healing and Transwell assays were undertaken on TCa cells in the presence of 6 μg/mL FKB. Wound closure at 24 h in monolayer culture was inhibited by FKB for ARO, WRO, and TPC‐1 cells (Fig. 2A,B). Counts of cells that had migrated through the membrane at 24 h were decreased by ~80% after exposure to 6 μg/mL FKB for all three cell lines (Fig. 2C). The rearrangement of the cytoskeleton is an important characteristic of migrating and invading cancer cells.22 Untreated TCa cells were characterized by more organized F‐actin filaments compared to FKB‐treated cells (Fig. 2D).
Figure 2.
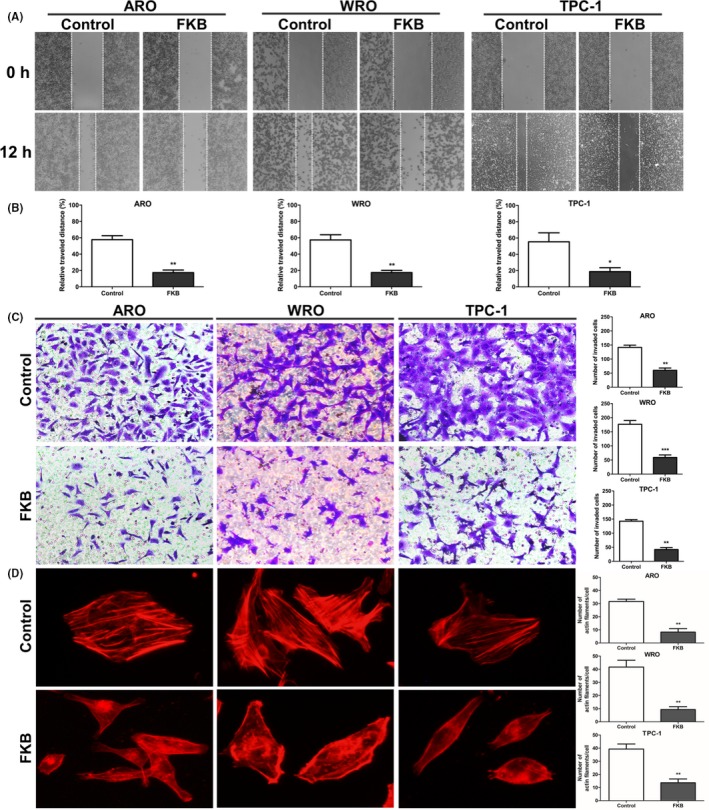
Flavokawain (FKB) attenuates migration and invasion of thyroid cancer cells. (A) Images of wound closure assays (24 h) for ARO, WRO, and TPC‐1 cells treated with 6 μg/mL FKB or DMSO for 24 h. (B) Statistical results for the wound closure area treated with 6 μg/mL FKB for 24 h. (C) Transwell membranes for ARO, WRO, and TPC‐1 cells treated with 6 μg/mL FKB for 24 h fixed and stained with crystal violet. (D) Statistical results of the invasive ratio for ARO, WRO, and TPC‐1 cells treated with 6 μg/mL FKB for 24 h in the Transwell assay. All data are expressed as the mean ± SD. *P < 0.05; **P < 0.01; ***P < 0.001
3.3. Flavokawain B induces mitochondrial dysfunction in TCa cells
Invasion is a high energy and nutrient‐consuming process in cancer cells.23 To begin to understand whether FKB might interfere with cancer cell metabolism, ATP synthesis levels were first examined in FKB‐treated TCa cells. In ARO, WRO, and TPC‐1 cells, ATP levels were moderately decreased after treatment with FKB at 4 and 6 μg/mL concentrations at 24 h (P < 0.05; Fig. 3A). The JC‐1 probe is an indicator of Δψm, which emits red fluorescence upon formation of J‐aggregates under high Δψm conditions and green fluorescence from J‐monomers under low Δψm conditions. Thus, the conversion between red and green fluorescence directly reflects changes in Δψm.24 In ARO, WRO, and TPC‐1 cells, green fluorescence increased under treatment with 6 μg/mL FKB (Fig. 3B), as indicated by the decrease in red/green fluorescence ratios (Fig. S2). The results showed that mitochondrial elements became significantly fragmented and unconnected after exposure to 6 μg/mL FKB for 24 h when compared with those in control cells (P < 0.01; Fig. 3C,D).
Figure 3.
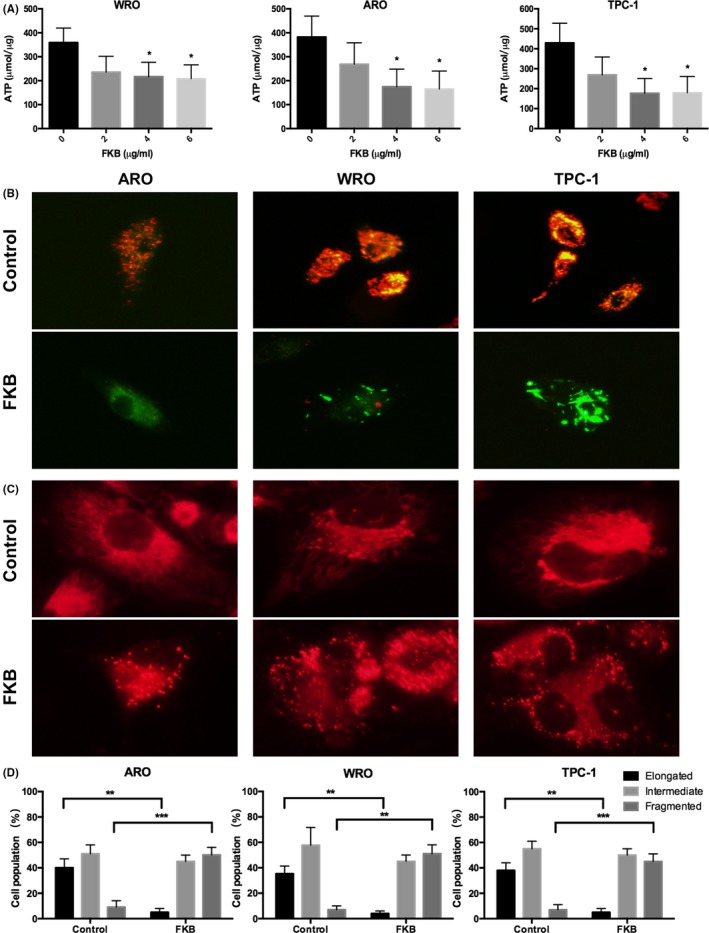
Flavokawain (FKB) induces mitochondrial dysfunction in thyroid cancer cells. (A) ATP synthesis levels in ARO, WRO, and TPC‐1 cells treated with different concentrations of FKB for 24 h. (B) Representative images of ARO, WRO, and TPC‐1 cells incubated with the JC‐1 probe to determine mitochondrial membrane potential and treated with 6 μg/mL FKB for 24 h. Images were acquired under different wavelengths and superimposed. (C) MitoTracker Red staining for mitochondria in ARO, WRO, and TPC‐1 cells treated with 6 μg/mL FKB or DMSO for 24 h. (D) Statistical results of the mitochondrial network in ARO, WRO, and TPC‐1 cells treated with 6 μg/mL FKB or DMSO for 24 h. All data are expressed as the mean ± SD. *P < 0.05; **P < 0.01; ***P < 0.001
3.4. Flavokawain B induces autophagy in TCa cells
Transmission electron microscopy analysis clearly indicated increased production of autophagosomes after 6 μg/mL FKB treatment for 24 h (Fig. 4A). The percentage of GFP‐LC3‐positive puncta increased after treatment with 6 μg/mL FKB for 24 h (Fig. 4B). We then examined the protein level of LC3B‐II and p62 in FKB‐treated TCa cells. After 6 μg/mL FKB treatment for the indicated time (Fig. 4C), or after treatment with the indicated concentration of FKB for 24 h (Fig. 4D), LC3B‐II levels were increased in ARO, WRO, and TPC‐1 cells both dose‐ and time‐dependently. Consistent with this, the p62 level decreased in similar manners.
Figure 4.
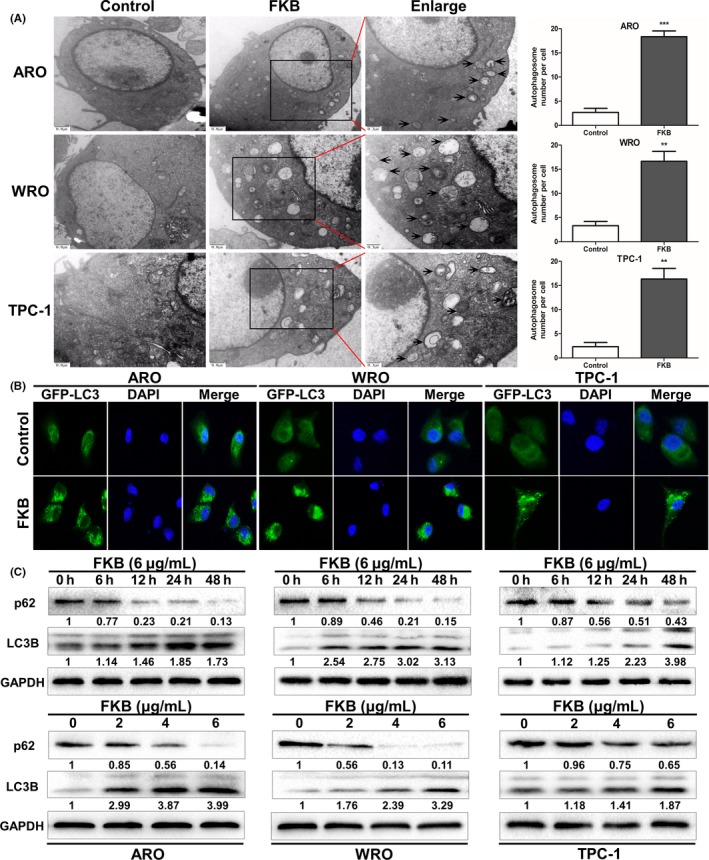
Flavokawain (FKB) induces autophagy in thyroid cancer cells. (A) Transmission electron microscopy shows the formation of autophagosomes in ARO, WRO, and TPC‐1 cells treated with 6 μg/mL FKB for 24 h. Representative autophagosomes are shown in the enlarged images (arrows). The number of autophagosomes per cell was quantified. (B) ARO, WRO, and TPC‐1 cells stably expressing GFP‐LC3B from lentiviruses were treated with 6 μg/mL FKB for 24 h. Percentages of cells with more than four GFP‐LC3B dots were quantified. (C) Levels of protein expression were analyzed by Western blot using antibodies against LC3B, p62, and GAPDH in ARO, WRO, and TPC‐1 cells treated with 6 μg/mL FKB for the indicated times. The number under each band represents the fold change of band intensity relative to control group. The fold change of LC3B only refers to LC3BII. (D) Levels of protein expression were analyzed by Western blot using antibodies against LC3B, p62, and GAPDH in ARO, WRO, and TPC‐1 cells treated with the indicated concentration of FKB for 24 h. All data are expressed as the mean ± SD. *P < 0.05; **P < 0.01; ***P < 0.001
As shown in Figure 5(A,B), knockdown of ATG5 or ATG7 by siRNA decreased FKB‐induced LC3B‐II formation in WRO cells. Furthermore, co‐incubation with FKB and 3‐methyladenine (3‐MA) (10 mmol/L), which blocks the upstream steps of autophagy, reduced FKB‐induced LC3B‐II formation in WRO cells (Fig. 5C). In contrast, co‐incubation with FKB and CQ (3 μmol/L), which blocks the downstream steps of autophagy, increased FKB‐induced LC3B accumulation (Fig. 5D). As shown in Figure 5(E,G), knockdown of ATG5 and ATG7 decreased FKB‐induced LC3B puncta formation (P < 0.01). 3‐Methyladenine reduced FKB‐induced LC3B puncta formation (P < 0.01), whereas CQ increased FKB‐induced LC3B accumulation (P < 0.05; Fig. 5F,G).
Figure 5.
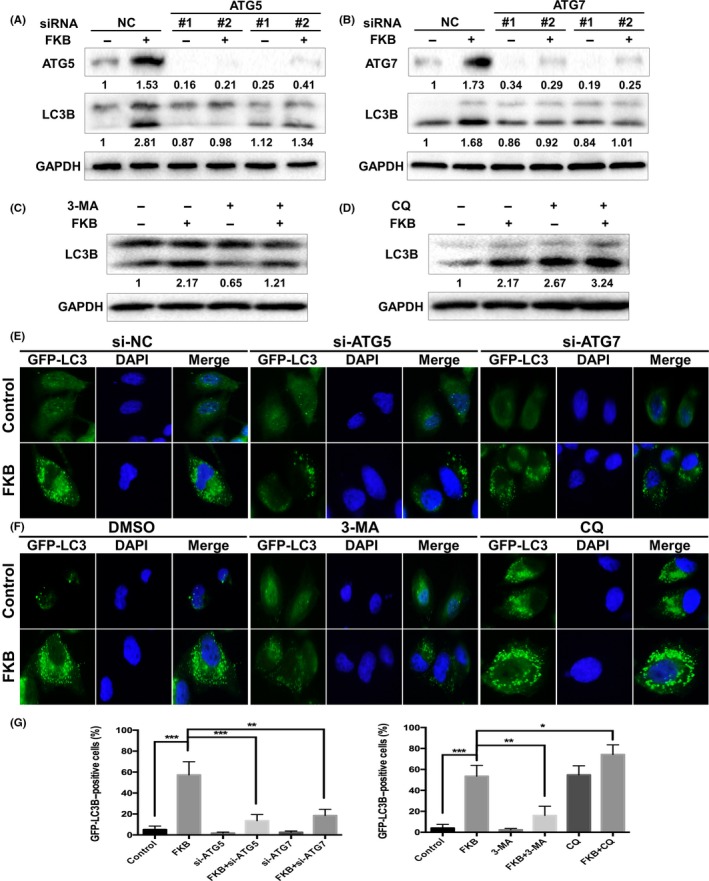
Flavokawain (FKB) induces autophagic flux in thyroid cancer cells. (A,B) ARO, WRO, and TPC‐1 cells were transfected with ATG5 or ATG7 siRNAs for 24 h, and treated with 6 μg/mL FKB or DMSO for another 24 h. The samples were subjected to Western blot analysis. Levels of protein expression were analyzed by Western blot using antibodies against ATG5, ATG7, LC3B, and GAPDH. (C,D) ARO, WRO, and TPC‐1 cells were pretreated with 3‐methyladenine (3‐MA) (10 mmol/L) or chloroquine (CQ) (3 μmol/L) for 1 h, and co‐incubated with 6 μg/mL FKB or DMSO for another 24 h. Levels of protein expression were analyzed by Western blot using antibodies against LC3B and GAPDH. (E) WRO cells stably transfected with GFP‐LC3B were further transfected with ATG5 or ATG7 siRNAs, then treated with 6 μg/mL FKB or DMSO for another 24 h. Cells were then subjected to a fluorescence microscopy. (F) WRO cells stably transfected with GFP‐LC3B were cotreated with autophagy inhibitors and FKB as mentioned above, then examined by a fluorescence microscopy. (G) Percentages of cells with more than four GFP‐LC3B dots were quantified. All data are expressed as the mean ± SD. *P < 0.05; **P < 0.01; ***P < 0.001
3.5. Flavokawain induces autophagy by inhibiting mTOR and activating Beclin‐1 in TCa cells
Mammalian target of rapamycin acts as a key negative regulator of autophagy.25 In our experiments, we observed that FKB dephosphorylated mTOR in a dose‐dependent manner in three TCa cell lines (Fig. 6A). Autophagy is strictly regulated by a series of ATGs, among which Beclin‐1 is essential for initiation of autophagy.26, 27 It has been reported that Beclin‐1 could be directly phosphorylated at Ser93 and Ser96 sites by AMPK in response to glucose starvation.28 In our experiments, we found that FKB treatment increased the level of p‐Beclin‐1 Ser93 in three TCa cells. Knockdown of Beclin‐1 reduced the FKB‐induced LC3B puncta formation (Fig. 6B,C) and enhancement of LC3B‐II levels (Fig. 6D).
Figure 6.
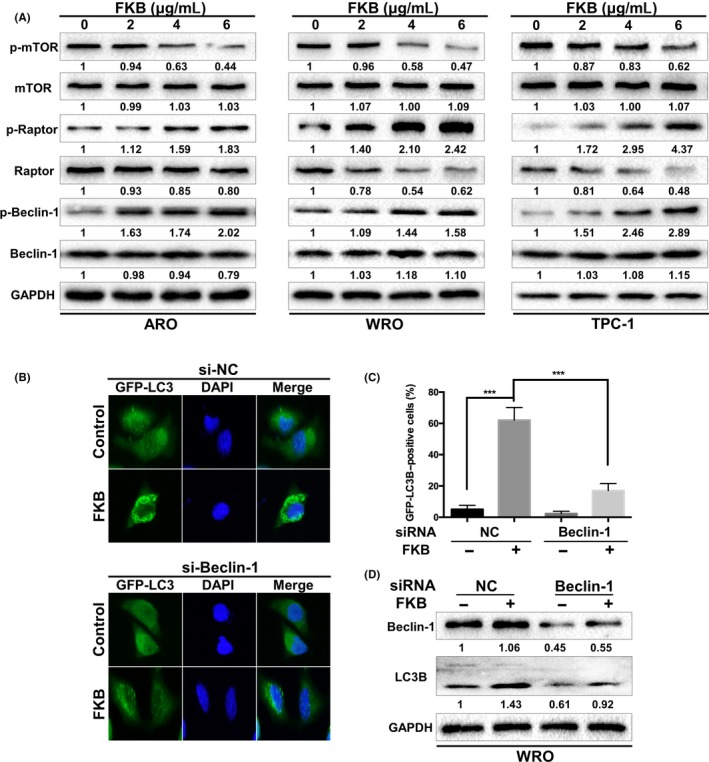
Flavokawain (FKB) induces autophagy by inhibiting mTOR and activating Beclin‐1 in thyroid cancer cells. (A) ARO, WRO, and TPC‐1 cells were incubated with the indicated concentrations of FKB for 24 h. Levels of protein expression were analyzed by Western blot using antibodies against the indicated autophagy‐related proteins and GAPDH. The number under each band represents the fold change of band intensity relative to control group. (B) WRO cells stably transfected with GFP‐LC3B were further transfected with Beclin‐1 siRNAs for 24 h, then treated with 6 μg/mL FKB for another 24 h. Cells were then examined by a fluorescence microscopy. Percentages of cells with more than four GFP‐LC3B dots were quantified. (C) WRO cells were transfected with Beclin‐1 siRNA or NC siRNA for 24 h, then treated with 6 μg/mL FKB for another 24 h. Levels of protein expression were analyzed by Western blot using antibodies against Beclin‐1, LC3B, and GAPDH. All data are expressed as the mean ± SD. *P < 0.05; **P < 0.01; ***P < 0.001
3.6. Flavokawain induces autophagy by activating AMPK in TCa cells
AMP‐activated protein kinase is activated by alterations in the cellular energy hemostasis.29 As shown in Figure 7(A), increasing concentrations of FKB increased phosphorylation of AMPK. To address whether FKB activation of autophagy was AMPK‐dependent, we incubated TCa cells with the AMPK siRNA or a widely used AMPK inhibitor, Compound C (Comp C). The results showed that both AMPK siRNA and Comp C (10 μmol/L) suppressed FKB‐induced enhancement of LC3B‐II levels (Fig. 7B,C) and LC3B puncta formation (Fig. 7D), and thus further established AMPK as a molecular target for FKB‐induced autophagy. We also found that inhibition of AMPK increased the levels of p‐mTOR Ser2448, followed by decreased levels of p‐Beclin‐1 Ser93 in the presence of FKB (Fig. 7B,C).
Figure 7.
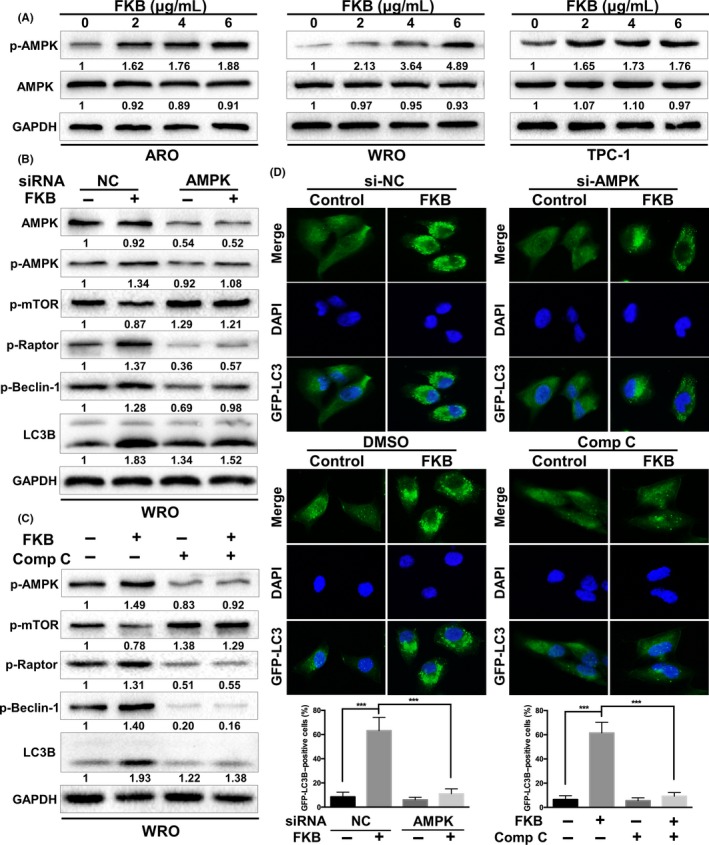
Flavokawain (FKB) induces autophagy by activating AMPK in thyroid cancer cells. (A) ARO, WRO, and TPC‐1 were treated with the indicated concentrations of FKB and incubated for 24 h. Levels of protein expression were analyzed by Western blot using antibodies against phosphorylated (p‐)AMPKαThr172, AMPKα, and GAPDH. (B) WRO cells were transfected with AMPKα siRNA or normal control (NC) siRNA for 24 h, then treated with 6 μg/mL FKB for another 24 h. Levels of protein expression were analyzed by Western blot using antibodies against the indicated autophagy‐related proteins and GAPDH. (C) WRO cells were pretreated with Compound C (Comp C, 10 μmol/L) for 1 h, and treated with 6 μg/mL FKB or DMSO for 24 h. Samples were subjected to Western blot analysis using antibodies against the indicated autophagy‐related proteins and GAPDH. (D) WRO cells stably transfected with GFP‐LC3B were treated with NC siRNA/AMPKα siRNAs or DMSO/Comp C and FKB as mentioned above. Cells were imaged using fluorescence microscopy, and the percentages of cells with more than four GFP‐LC3B dots were quantified. All data are expressed as the mean ± SD. *P < 0.05; **P < 0.01; ***P < 0.001
3.7. Flavokawain induces cytoprotective autophagy in TCa cells both in vitro and in vivo
Autophagy plays dual roles in cell survival and cell death.30 The results showed that inhibition of autophagy with 3‐MA (10 mmol/L) and CQ (3 μmol/L) or cotreatment with si‐Beclin‐1 and si‐ATG5 enhanced the antitumor effect of FKB in WRO cells (Figs. 8A,B,S3). We next tested the potential therapeutic efficiency of FKB and the effects of FKB‐induced autophagy in vivo. Our results showed that FKB monotherapy significantly reduced tumor growth (Fig. 8C–E). Although no statistically significant differences were found between the CQ and control group, treatment with FKB and CQ significantly reduced the tumor volume and tumor weight, compared to vehicle treatment and FKB treatment (Fig. 8C–E). There was no significant body weight loss in FKB or combination treatment groups compared to the control group (Fig. 8F). Finally, a pronounced increase in apoptosis (TUNEL) was noted in combined treatment xenografts (Figs. 8G,S4A). The marker for autophagy, LC3B, was increased in tumor cells (Fig. S4B,C), whereas Ki67, a marker for proliferation, was decreased (Figs. 8G,S4D) from animals treated with FKB + CQ.
Figure 8.
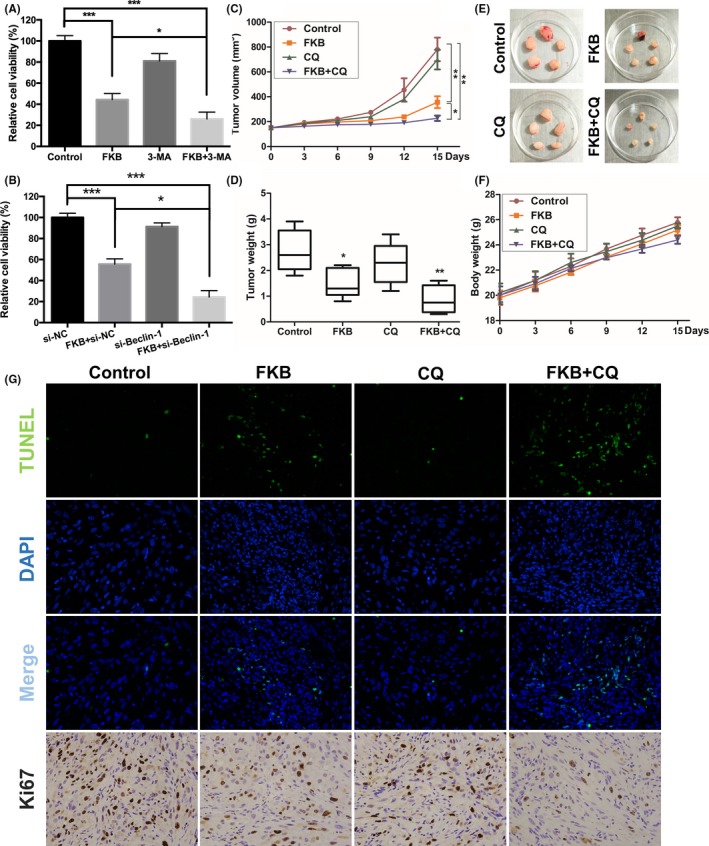
Flavokawain (FKB) induces cytoprotective autophagy in thyroid cancer cells both in vitro and in vivo. (A,B) WRO cells were pretreated with 3‐methyladenine (3‐MA) (10 mmol/L) or si‐Beclin‐1, then incubated with 6 μg/mL FKB or DMSO for another 24 h. Cell viability was detected using CCK‐8 assays. (C–F) Mice were killed 18 days after the indicated treatments, and tumor weight, tumor volume, and mouse body weight were measured. (G) TUNEL assay and immunohistochemical staining results of Ki67 on tumor sections. All data are expressed as the mean ± SD. *P < 0.05; **P < 0.01; ***P < 0.001
4. DISCUSSION
Multiple studies have provided compelling evidence that FKB, a novel chalcone isolated from kava root extracts, has anticancer effects in some aggressive malignancies.5, 9, 10, 31 Inducing cell cycle arrest and inducing apoptosis were found to be the major mechanisms by which FKB induces cell death. We, for the first time, showed that FKB induces autophagy in TCa cells.
Autophagy is one of the basic catabolic mechanisms to degrade and recycle damaged and dysfunctional organelles to mediate metabolic adaptation and maintain intracellular energy homeostasis, thus promoting the cellular survival response to nutrient starvation and stresses.17 In the present study, we showed that FKB reduced ATP levels and induced mitochondrial fission, thus leading to increased autophagy flux in TCa cells. Cells treated with FKB formed more fragmented mitochondria, whereas untreated cells formed tubular mitochondria, indicating alterations in the fusion‐to‐fission process in FKB‐treated cells. However, the role of mitochondrial fission appears to change according to cell type.32, 33, 34 It could be either FKB‐induced mitochondrial injury or cancer cell protective changes facing energy stress. Cell‐specific function of mitochondrial dynamics in different metabolic states therefore needs to be further explored. We found that FKB‐induced autophagy flux is disrupted by autophagy inhibitors 3‐MA and CQ, or by knocking down either the ATG5 or ATG7 gene, implying that FKB might induce autophagy in an ATG5‐ and ATG7‐dependent manner in TCa cells.
Autophagy is regulated by a complex signaling network, and compounds that trigger autophagy can be broadly classified into two groups: mTOR‐dependent and mTOR‐independent. Our results showed that FKB suppressed the level of p‐mTOR, indicating that FKB induced mTOR‐dependent autophagy in TCa cells. As a key upstream inhibitor of mTOR, AMPK acts as an important sensor of intracellular energy levels.29 We found that FKB upregulated the level of p‐AMPKαThr172, which in turn activated its substrates mTOR and Beclin‐1. Furthermore, using RNA interference against AMPK or Beclin‐1 and AMPK inhibitor Comp C in combination with FKB, we confirmed that the AMPK pathway is the crucial mediator of FKB‐induced autophagy.
Autophagy plays two opposite roles of protector or inhibitor in tumor growth, which highly depends on cell types and inducers. Some studies have shown that autophagy‐inducing compounds have antiproliferative effects,35, 36 whereas others induce protective autophagy, which antagonizes apoptotic cell death.37, 38, 39 In this study, we showed that inhibition of autophagy enhanced the cytotoxicity and antitumor effect of FKB both in vitro and in vivo, indicating that FKB induces protective autophagy in TCa cells. Recently, studies showed that cancer‐associated fibroblasts in the tumor microenvironment is an important promoter of tumor initiation and progression. Fibroblasts existing in the tumor microenvironment positively influenced the metabolism of colorectal cancer cells through neighboring tumor cells that induced autophagy.40 Further research therefore remains to be tested whether FKB could also induce autophagy in tumor stromal cells and elucidate the relationship between FKB and the tumor microenvironment. Flavokawain‐treated cells formed more fragmented mitochondria, whereas untreated cells formed tubular mitochondria, indicating alterations in the fusion‐to‐fission process in FKB‐treated cells. However, the specific roles of mitochondria fusion and fission states remain unclear. We therefore cannot clarify whether FKB‐induced mitochondria fission is a mitochondrial injury marker or a self‐protective mechanism of cancer cells facing energy stress. Further research remains to be undertaken to fully elucidate relationships between mitochondrial morphology and the fate of cancer cells. In summary, our data indicate that FKB inhibits malignant behavior of TCa cells and induces cytoprotective autophagy by targeting the AMPK pathway. Flavokawain warrants further investigation as a natural bioactive molecule with cancer‐killing potential, and we predict that combination treatment with FKB and pharmacological autophagy inhibitors will be an effective therapeutic strategy in TCa.
DISCLOSURE STATEMENT
The authors have no conflict of interest.
Supporting information
ACKNOWLEDGMENTS
This study was funded by the Fundamental Research Funds of Qilu Hospital of Shandong University, and the Medical and Health Science and Technology development plan of Shandong Province (2014WS0136).
He Q, Liu W, Sha S, et al. Adenosine 5'‐monophosphate‐activated protein kinase‐dependent mTOR pathway is involved in flavokawain B‐induced autophagy in thyroid cancer cells. Cancer Sci. 2018;109:2576–2589. 10.1111/cas.13699
REFERENCES
- 1. Siegel RL, Miller KD, Jemal A. Cancer statistics, 2015. CA Cancer J Clin. 2015;65:5‐29. [DOI] [PubMed] [Google Scholar]
- 2. Burns WR, Zeiger MA. Differentiated thyroid cancer. Semin Oncol. 2010;37:557‐566. [DOI] [PubMed] [Google Scholar]
- 3. Gordaliza M. Natural products as leads to anticancer drugs. Clin Transl Oncol. 2007;9:767‐776. [DOI] [PubMed] [Google Scholar]
- 4. Newman DJ, Cragg GM, Snader KM. The influence of natural products upon drug discovery. Nat Prod Rep. 2000;17:215‐234. [DOI] [PubMed] [Google Scholar]
- 5. Abu N, Akhtar MN, Yeap SK, et al. Flavokawain B induced cytotoxicity in two breast cancer cell lines, MCF‐7 and MDA‐MB231 and inhibited the metastatic potential of MDA‐MB231 via the regulation of several tyrosine kinases In vitro. BMC Complement Altern Med. 2016;16:86. [DOI] [PMC free article] [PubMed] [Google Scholar]
- 6. An J, Gao Y, Wang J, et al. Flavokawain B induces apoptosis of non‐small cell lung cancer H460 cells via Bax‐initiated mitochondrial and JNK pathway. Biotechnol Lett. 2012;34:1781‐1788. [DOI] [PubMed] [Google Scholar]
- 7. Li X, Liu Z, Xu X, et al. Kava components down‐regulate expression of AR and AR splice variants and reduce growth in patient‐derived prostate cancer xenografts in mice. PLoS ONE. 2012;7:e31213. [DOI] [PMC free article] [PubMed] [Google Scholar]
- 8. Zi X, Simoneau AR. Flavokawain A, a novel chalcone from kava extract, induces apoptosis in bladder cancer cells by involvement of Bax protein‐dependent and mitochondria‐dependent apoptotic pathway and suppresses tumor growth in mice. Cancer Res. 2005;65:3479‐3486. [DOI] [PubMed] [Google Scholar]
- 9. Ji T, Lin C, Krill LS, et al. Flavokawain B, a kava chalcone, inhibits growth of human osteosarcoma cells through G2/M cell cycle arrest and apoptosis. Mol Cancer. 2013;12:55. [DOI] [PMC free article] [PubMed] [Google Scholar]
- 10. Tang YL, Huang LB, Tian Y, et al. Flavokawain B inhibits the growth of acute lymphoblastic leukemia cells via p53 and caspase‐dependent mechanisms. Leuk Lymphoma. 2015;56:2398‐2407. [DOI] [PubMed] [Google Scholar]
- 11. Yang Z, Klionsky DJ. Eaten alive: a history of macroautophagy. Nat Cell Biol. 2010;12:814‐822. [DOI] [PMC free article] [PubMed] [Google Scholar]
- 12. Livesey KM, Tang D, Zeh HJ, Lotze MT. Autophagy inhibition in combination cancer treatment. Curr Opin Investig Drugs. 2009;10:1269‐1279. [PubMed] [Google Scholar]
- 13. Maycotte P, Thorburn A. Autophagy and cancer therapy. Cancer Biol Ther. 2011;11:127‐137. [DOI] [PMC free article] [PubMed] [Google Scholar]
- 14. Chen N, Karantza V. Autophagy as a therapeutic target in cancer. Cancer Biol Ther. 2011;11:157‐168. [DOI] [PMC free article] [PubMed] [Google Scholar]
- 15. Eskelinen EL. The dual role of autophagy in cancer. Curr Opin Pharmacol. 2011;11:294‐300. [DOI] [PubMed] [Google Scholar]
- 16. Yang SY, Winslet MC. Dual role of autophagy in colon cancer cell survival. Ann Surg Oncol. 2011;18:S239. [DOI] [PubMed] [Google Scholar]
- 17. Kroemer G, Marino G, Levine B. Autophagy and the integrated stress response. Mol Cell. 2010;40:280‐293. [DOI] [PMC free article] [PubMed] [Google Scholar]
- 18. Levine B. Cell biology: autophagy and cancer. Nature. 2007;446:745‐747. [DOI] [PubMed] [Google Scholar]
- 19. Huang HL, Chiang WL, Hsiao PC, et al. Timosaponin AIII mediates caspase activation and induces apoptosis through JNK1/2 pathway in human promyelocytic leukemia cells. Tumour Biol. 2015;36:3489‐3497. [DOI] [PubMed] [Google Scholar]
- 20. King FW, Fong S, Griffin C, et al. Timosaponin AIII is preferentially cytotoxic to tumor cells through inhibition of mTOR and induction of ER stress. PLoS ONE. 2009;4:e7283. [DOI] [PMC free article] [PubMed] [Google Scholar]
- 21. Wang N, Feng Y, Zhu M, Siu FM, Ng KM, Che CM. A novel mechanism of XIAP degradation induced by timosaponin AIII in hepatocellular carcinoma. Biochim Biophys Acta. 2013;1833:2890‐2899. [DOI] [PubMed] [Google Scholar]
- 22. Larsson C. Protein kinase C and the regulation of the actin cytoskeleton. Cell Signal. 2006;18:276‐284. [DOI] [PubMed] [Google Scholar]
- 23. Warburg O. On the origin of cancer cells. Science. 1956;123:309‐314. [DOI] [PubMed] [Google Scholar]
- 24. Gao Y, Su Y, Qu L, et al. Mitochondrial apoptosis contributes to the anti‐cancer effect of Smilax glabra Roxb. Toxicol Lett. 2011;207:112‐120. [DOI] [PubMed] [Google Scholar]
- 25. Jung CH, Ro SH, Cao J, Otto NM, Kim DH. mTOR regulation of autophagy. FEBS Lett. 2010;584:1287‐1295. [DOI] [PMC free article] [PubMed] [Google Scholar]
- 26. Ganley IG, du Lam H, Wang J, Ding X, Chen S, Jiang X. ULK1.ATG13.FIP200 complex mediates mTOR signaling and is essential for autophagy. J Biol Chem. 2009;284:12297‐12305. [DOI] [PMC free article] [PubMed] [Google Scholar]
- 27. He C, Levine B. The Beclin 1 interactome. Curr Opin Cell Biol. 2010;22:140‐149. [DOI] [PMC free article] [PubMed] [Google Scholar]
- 28. Kim J, Kim YC, Fang C, et al. Differential regulation of distinct Vps34 complexes by AMPK in nutrient stress and autophagy. Cell. 2013;152:290‐303. [DOI] [PMC free article] [PubMed] [Google Scholar]
- 29. Hardie DG, Alessi DR. LKB1 and AMPK and the cancer‐metabolism link – ten years after. BMC Biol. 2013;11:36. [DOI] [PMC free article] [PubMed] [Google Scholar]
- 30. Thorburn A. Apoptosis and autophagy: regulatory connections between two supposedly different processes. Apoptosis. 2008;13:1‐9. [DOI] [PMC free article] [PubMed] [Google Scholar]
- 31. Eskander RN, Randall LM, Sakai T, Guo Y, Hoang B, Zi X. Flavokawain B, a novel, naturally occurring chalcone, exhibits robust apoptotic effects and induces G2/M arrest of a uterine leiomyosarcoma cell line. J Obstet Gynaecol Res. 2012;38:1086‐1094. [DOI] [PMC free article] [PubMed] [Google Scholar]
- 32. Zhao J, Zhang J, Yu M, et al. Mitochondrial dynamics regulates migration and invasion of breast cancer cells. Oncogene. 1038;2013:4814‐4824. [DOI] [PMC free article] [PubMed] [Google Scholar]
- 33. Kong B, Tsuyoshi H, Orisaka M, Shieh D, Yoshida Y, Tsang B. Mitochondrial dynamics regulating chemoresistance in gynecological cancers. Ann N Y Acad Sci. 2015;1350:1‐16. [DOI] [PubMed] [Google Scholar]
- 34. Lima A, Santos L, Correia M, et al. Dynamin‐related protein 1 at the crossroads of cancer. Genes (Basel). 2018;9:115. [DOI] [PMC free article] [PubMed] [Google Scholar]
- 35. Benedetti E, Antonosante A, d'Angelo M, et al. Nucleolin antagonist triggers autophagic cell death in human glioblastoma primary cells and decreased in vivo tumor growth in orthotopic brain tumor model. Oncotarget. 2015;6:42091‐42104. [DOI] [PMC free article] [PubMed] [Google Scholar]
- 36. Khurana A, Roy D, Kalogera E, et al. Quinacrine promotes autophagic cell death and chemosensitivity in ovarian cancer and attenuates tumor growth. Oncotarget. 2015;6:36354‐36369. [DOI] [PMC free article] [PubMed] [Google Scholar]
- 37. Liu J, Zheng L, Zhong J, Wu N, Liu G, Lin X. Oleanolic acid induces protective autophagy in cancer cells through the JNK and mTOR pathways. Oncol Rep. 2014;32:567‐572. [DOI] [PubMed] [Google Scholar]
- 38. Zhao F, Huang W, Zhang Z, et al. Triptolide induces protective autophagy through activation of the CaMKKbeta‐AMPK signaling pathway in prostate cancer cells. Oncotarget. 2016;7:5366‐5382. [DOI] [PMC free article] [PubMed] [Google Scholar]
- 39. Zhao Z, Han F, Yang S, Wu J, Zhan W. Oxamate‐mediated inhibition of lactate dehydrogenase induces protective autophagy in gastric cancer cells: involvement of the Akt‐mTOR signaling pathway. Cancer Lett. 2015;358:17‐26. [DOI] [PubMed] [Google Scholar]
- 40. Zhou W, Xu G, Wang Y, et al. Oxidative stress induced autophagy in cancer associated fibroblast enhances proliferation and metabolism of colorectal cancer cells. Cell Cycle. 2017;16:73‐81. [DOI] [PMC free article] [PubMed] [Google Scholar]
Associated Data
This section collects any data citations, data availability statements, or supplementary materials included in this article.
Supplementary Materials


