

Abstract
Heterogeneous nuclear ribonucleoprotein L‐like (HNRNPLL), an RNA‐binding protein that regulates alternative splicing of pre‐mRNA, has been shown to regulate differentiation of lymphocytes, as well as metastasis of colorectal cancer cells. Here, we show that HNRNPLL promotes cell cycle progression and, hence, proliferation of colorectal cancer cells. Functional annotation analysis of those genes whose expression levels were changed threefold or more in RNA sequencing analysis between SW480 cells overexpressing HNRNPLL and those knocked down for HNRNPLL revealed enrichment of DNA replication‐related genes by HNRNPLL overexpression. Among 13 genes detected in the DNA replication pathway, PCNA,RFC3 and FEN1 showed reproducible upregulation by HNRNPLL overexpression both at mRNA and at protein levels in SW480 and HT29 cells. Importantly, knockdown of any of these genes alone suppressed the proliferation‐promoting effect induced by HNRNPLL overexpression. RNA‐immunoprecipitation assay presented a binding of FLAG‐tagged HNRNPLL to mRNA of these genes, and HNRNPLL overexpression significantly suppressed the downregulation of these genes during 12 h of actinomycin D treatment, suggesting a role of HNRNPLL in mRNA stability. Finally, analysis of a public RNA sequencing dataset of clinical samples suggested a link between overexpression of HNRNPLL and that of PCNA,RFC3 and FEN1. This link was further supported by immunohistochemistry of colorectal cancer clinical samples, whereas expression of CDKN1A, which is known to inhibit the cooperative function of PCNA, RFC3 and FEN1, was negatively associated with HNRNPLL expression. These results indicate that HNRNPLL stabilizes mRNA encoding regulators of DNA replication and promotes colorectal cancer cell proliferation.
Keywords: cell cycle, colorectal cancer, DNA replication, HNRNPLL, mRNA stability
1. INTRODUCTION
Colorectal cancer is one of the leading causes of death worldwide.1 Poor prognosis of patients with advanced colorectal cancer despite the recent advances in the treatment indicates the critical need for therapeutic targets. We recently reported that Heterogeneous nuclear ribonucleoprotein L‐like (HNRNPLL), an RNA‐binding protein of the hnRNP family previously known to modulate alternative pre‐mRNA splicing in lymphocytes2 and plasma cells,3 is a metastasis suppressor of colorectal cancer.4 HNRNPLL expression is downregulated at mRNA level during epithelial‐mesenchymal transition (EMT) and is restored during mesenchymal‐epithelial transition (MET) in colorectal cancer cells.4 Downregulation of HNRNPLL during EMT or that by knockdown of HNRNPLL by shRNA modulates the alternative splicing of CD44 to increase CD44 variable exon 6 (CD44v6), which enhances the invasion activity of colorectal cancer cells.4
Definition of metastasis suppressors requires that they do not inhibit tumor cell proliferation, because growth suppression could lead to apparent suppression of invasion/metastasis. HNRNPLL knockdown did not enhance colorectal cancer cell proliferation but suppressed their proliferation instead, suggesting the proliferation‐promoting effect of HNRNPLL.4 While our previous finding clearly demonstrated that HNRNPLL suppressed invasion/metastasis through regulation of pre‐mRNA splicing of CD44, the alternative splicing of CD44 may not explain the possible proliferation‐promoting effect of HNRNPLL.
hnRNP family proteins are involved in various steps of RNA metabolism, including transcription, nuclear export, mRNA stability, and mRNA translation, in addition to pre‐mRNA splicing.5 Dysregulation of HNRNP proteins is known to help cancer progression through their nonsplicing functions.6 For example, HNRNPK has been shown to promote proliferation of colorectal cancer cells by regulating not only pre‐mRNA splicing of MRPL33,7 but also transcription of CDKN2B 8 and MMP2,9 mRNA stability of CDK6,10 and mRNA translation of BTK.11
In this study, we address the role of HNRNPLL in proliferation of colorectal cancer cells and demonstrate that HNRNPLL stabilizes mRNA encoding regulators of DNA replication and enhances cell cycle progression.
2. MATERIALS AND METHODS
2.1. Cell culture
Human colon cancer cell lines SW480 and HT29 were obtained from ATCC (Manassas, VA, USA) and were maintained in DMEM (Nacalai Tesque, Kyoto, Japan) supplemented with 10% FBS (Thermo Fisher Scientific, Waltham, MA, USA). Actinomycin D (Sigma‐Aldrich, St. Louis, MO) was added into the culture medium at a final concentration of 1 μg/mL. The cell number was determined using a TC20 cell counter (Bio‐Rad, Hercules, CA, USA).
2.2. Lentiviral transduction
pLKO.1 lentiviral shRNA vectors for Luciferase (TRCN0000072259) and HNRNPLL (sh1, TRCN0000075098; sh2, TRCN0000075101) were obtained from Sigma‐Aldrich. Lentiviral cDNA expression vectors were constructed by subcloning the coding region sequence into pLEX‐MCS (GE Healthcare, Buckinghamshire, UK). Lentivirus was produced by transfecting these vectors into HEK293T cells with packaging plasmids using Lipofectamine 2000 (Thermo Fisher Scientific). The culture supernatants were used for infecting cells with 8 μg/mL of polybrene (Sigma‐Aldrich).
2.3. Western blot
Cells were lysed in RIPA buffer (Thermo Fisher Scientific) containing blends of protease inhibitors (Roche Life Science, Mannheim, Germany), and the lysate was subjected to SDS‐PAGE followed by transfer onto PVDF membranes (Bio‐Rad, Hercules, CA, USA). After incubation in Blocking One reagent (Nacalai Tesque), the membranes were blotted with primary antibodies and then with appropriate HRP‐conjugated secondary antibodies (Southern Biotech, Birmingham, AL, USA). The signals were visualized with Immobilon Western Chemiluminescent HRP Substrate (Merck Millipore, Billerica, MA, USA). The antibodies used in this study are listed in Supplementary Table S1.
2.4. RNA sequencing
Total RNA was extracted with ISOGEN (Nippon Gene, Tokyo, Japan). A sequencing library was prepared using the TruSeq stranded mRNA sample prep kit (Illumina, San Diego, CA). 100 bp pair‐end reads were obtained from Illumina HiSeq 2500. Sequence files were obtained in FASTQ format and the data aligned with TopHat2 were analyzed with Cufflinks 2.1.1 to obtain the relative abundances of transcripts as fragments per kilobase of exon per million mapped fragments (FPKM).
2.5. Cell cycle analysis
Cells were harvested and fixed in 70% ethanol overnight at −30°C. After centrifugation, the pellets were suspended in PBS(−) containing 50 μg/mL of propidium iodide (Dojindo, Kumamoto, Japan) and 50 μg/mL of RNase A (Nippon Gene) at 37°C for 60 min and were analyzed with a FACSCalibur (BD Biosciences, Franklin Lakes, NJ, USA).
2.6. Quantitative RT‐PCR
First‐strand cDNA was prepared with a High‐Capacity cDNA Reverse Transcription Kit using oligo(dT) primers (Thermo Fisher Scientific). The cDNA templates were mixed with FAM‐labeled TaqMan Gene Expression Assays and TaqMan Gene Expression Master Mix (Thermo Fisher Scientific), followed by amplification using a 7500 Fast Real‐Time PCR System (Thermo Fisher Scientific) according to the manufacturer's protocol. Assay IDs of the TaqMan Gene Expression Assays used in this study are listed in Supplementary Table S2. The results were obtained as relative transcript levels to GAPDH using the comparative CT method.
2.7. siRNA transfection
Negative control siRNA and Silencer Select siRNA for PCNA (IDs s10133 and s10134), RFC3 (IDs s11948 and s11949) and FEN1 (IDs s5104 and s5105) were obtained from Thermo Fisher Scientific. The siRNA were incubated with Lipofectamine RNAiMAX (Thermo Fisher Scientific) in Opti‐MEM medium (Thermo Fisher Scientific) for 5 min at room temperature and were added to the culture supernatant of the target cells.
2.8. MTT assay
MTT assay was performed using a CellQuanti‐MTT Cell Viability Assay Kit (BioAssay Systems, Hayward, CA, USA) according to the manufacturer's protocol. Briefly, 24 h after viral transduction, cells were seeded on a 96‐well plate at 1 × 10⁴ cells/well. siRNA was transfected 24 h after the seeding, and the MTT substrate was added to the culture medium 72 h after the transfection, followed by additional culturing for 4 h. The cells were treated with lysis buffer to solubilize the formazan dye, and the absorbance at 595 nm was determined with a Genios microplate reader (Tecan, Männedorf, Switzerland).
2.9. RNA‐immunoprecipitation
RNA‐immunoprecipitation was performed using a Magna RIP RNA‐Binding Protein Immunoprecipitation Kit (Merck Millipore). Collected RNA was subjected to reverse transcription using a High‐Capacity cDNA Reverse Transcription Kit (Thermo Fisher Scientific) with random or oligo(dT) primers and was analyzed by 35 cycles of conventional PCR using KOD‐Plus Neo (Toyobo, Osaka, Japan). Primers used for the PCR analysis are listed in Supplementary Table S3.
2.10. Immunostaining
For immunocytological staining, cells were fixed with 4% formaldehyde followed by permeabilization with methanol at −30°C for 10 min. Human colorectal cancer sections were prepared from surgical tissues collected at Aichi Cancer Center Hospital under informed consent. The paraffin sections were subjected to deparaffinization and antigen retrieval in heated citrate buffer for 30 min. The cells and sections were blocked with PBS(−) containing 5% normal goat serum and 0.3% Triton X‐100 for 60 min, incubated with primary antibodies overnight at 4°C, and then with Alexa‐conjugated secondary antibodies for 2 h at room temperature. TO‐PRO‐3 Iodide (Thermo Fisher Scientific) was used for nuclear staining. The stained sections were observed and photographed with an LSM800 confocal microscope (Carl Zeiss, Jena, Germany).
2.11. Statistical analyses
The statistical significance was assessed by unpaired Student's t test using the Microsoft Excel software (Microsoft, Redmond, WA).
3. RESULTS
3.1. HNRNPLL overexpression induces cell cycle progression
To address the possible role of HNRNPLL in proliferation of colorectal cancer cells, we performed flow cytometric cell cycle analysis of SW480 and HT29 cells that stably overexpress or underexpress HNRNPLL (Supplementary Figure S1A). As shown in Figure 1A‐D, overexpression of HNRNPLL decreased the percentages of the cells in G0/G1 phase and increased the percentages of the cells in S or G2/M phase, while knockdown of HNRNPLL showed the opposite effects. In contrast, no apparent changes were observed in the sub‐G1 populations. These data suggest that the suppressive effect of HNRNPLL knockdown on the growth curves of colorectal cancer cells4 was due to suppression of cell cycle progression, rather than induction of apoptosis. We further assessed the expression levels of the endogenous HNRNPLL in G1 and S/G2/M phases by immunostaining HT29 cells with antibodies for HNRNPLL, CDT1 and GMNN (Figure 1E). CDT1, also known as a DNA replication licensing factor, accumulates in G1 phase for prereplication complex assembly.12 This function of CDT1 is inhibited by GMNN (also known as Geminin) through a direct interaction,13 followed by destabilization of CDT1 after initiation of S phase,12 while GMNN, which accumulates during S, G2 and M phases, is degraded at the metaphase‐anaphase transition.14 CDT1 and GMNN are, thus, considered useful markers of G1 and S/G2/M phases, respectively.15 The immunocytochemical analysis of HT29 cells indicates that cells in G1 phases demarcated by the absence of nuclear GMNN expression and by high CDT1 expression exhibit higher HNRNPLL expression compared to those in S/G2/M phases demarcated by nuclear GMNN expression and low CDT1 expression. This result, together with the increased S/G2/M percentages observed in HNRNPLL overexpressing cells (Figure 1A‐D), suggests that the upregulation of HNRNPLL during G1 phase may contribute to the subsequent S‐phase entry and/or progression.
Figure 1.
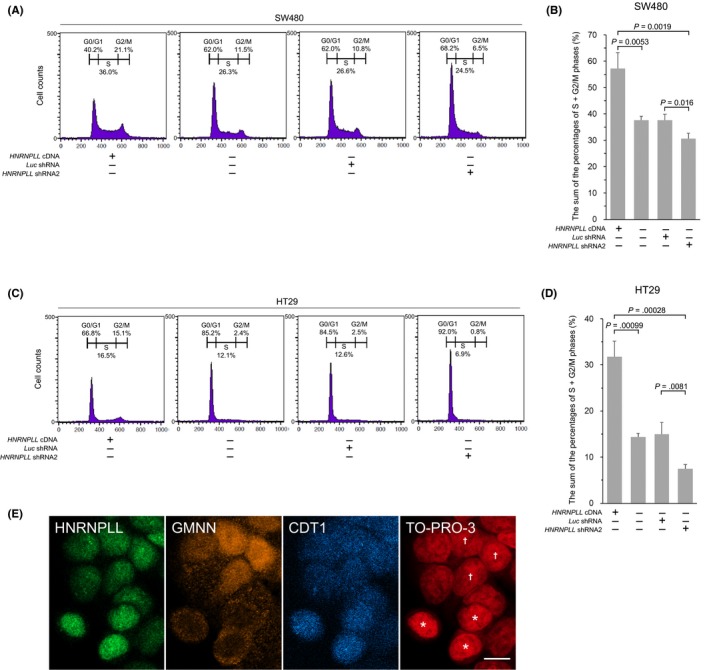
HNRNPLL promotes cell cycle progression in colon cancer cells. A‐D, Cell cycle analysis for SW480 (A) and HT29 (C) cells transduced with HNRNPLL cDNA, Luc shRNA or HNRNPLL shRNA2 was performed using a flow cytometer. The sum of the percentages of S and G2/M phases in SW480 (B) and HT29 (D) cells are shown in the bar graph. Error bars, SD. E, Immunostaining of HT29 cells using antibodies for HNRNPLL, GMNN and CDT1. Note that cells showing no nuclear GMNN expression and high CDT1 expression (*) exhibit higher HNRNPLL expression compared to cells showing nuclear GMNN expression and low CDT1 expression (†). Scale bar, 10 μm
3.2. HNRNPLL overexpression upregulates PCNA, RFC3 and FEN1 expression
To explore the mechanisms by which HNRNPLL affects cell cycle progression, we next performed RNA sequencing analysis for SW480 cells transduced with HNRNPLL cDNA and those transduced with HNRNPLL shRNA. The expression levels of the individual exons of all the genes were obtained by a Cufflinks analysis. Successful sequencing was confirmed by the expression levels of HNRNPLL exons (Supplementary Figure S1B) as well as by the increased expression levels of CD44 variable exons 3‐10 in HNRNPLL knocked down cells (Supplementary Figure S1C), which is consistent with our previous finding.4 Several genes were noted for altered exon usage, which suggests that the alternative splicing of these genes may be modulated by HNRNPLL, and the genes are currently under investigation in detail. Intriguingly, we also found a large number of genes showing altered gene expression levels. Namely, 1514 genes were upregulated in the HNRNPLL overexpressing cells by more than threefold as compared to the HNRNPLL knocked down cells, while 2190 genes were upregulated in the HNRNPLL knocked down cells by more than threefold as compared to the HNRNPLL overexpressing cells. We performed gene annotation analysis using the Database for Annotation, Visualization, and Integrated Discovery (DAVID; https://david.ncifcrf.gov/), in which enriched functionally‐related gene groups were discovered and mapped on the Kyoto Encyclopedia of Genes and Genomes (KEGG) pathways.16 Among the pathways identified for the genes upregulated in the HNRNPLL‐overexpressed cells, “DNA replication” showed the lowest P and FDR values (Table 1), and 13 genes, MCM2‐7, POLA2, POLD1, POLE, PCNA, RFC3, LIG1 and FEN1, were enriched in the pathway (Figure 2A). Quantitative RT‐PCR confirmed the significantly higher expression levels of MCM2, MCM3, MCM4, POLA2, POLE, PCNA, RFC3 and FEN1 in the HNRNPLL overexpressing cells as compared to the HNRNPLL knocked down cells in both SW480 and HT29 cells (Figure 2B). Furthermore, western blot analysis demonstrated that the protein expression levels of PCNA, RFC3 and FEN1 were higher in the HNRNPLL‐overexpressed cells as compared to the HNRNPLL knockdown cells (Figure 2C). These results prompted us to focus on the roles of PCNA, RFC3 and FEN1 in the following study.
Table 1.
Pathways identified by gene ontology analysis using DAVID
| Pathway | P‐value | FDR |
|---|---|---|
| Upregulated in HNRNPLL‐overexpressed SW480 cells | ||
| DNA replication | .00000000012 | 0.0000000015 |
| Cell cycle | .0000040 | 0.000049 |
| Mismatch repair | .0011 | 0.013 |
| Upregulated in HNRNPLL knocked down SW480 cells | ||
| Focal adhesion | .000024 | 0.00029 |
| Hematopoietic cell lineage | .000040 | 0.00049 |
| Complement and coagulation cascades | .00079 | 0.0096 |
| ECM‐receptor interaction | .0024 | 0.029 |
| Cell adhesion molecules | .0025 | 0.030 |
DAVID, Database for Annotation, Visualization, and Integrated Discovery
Figure 2.
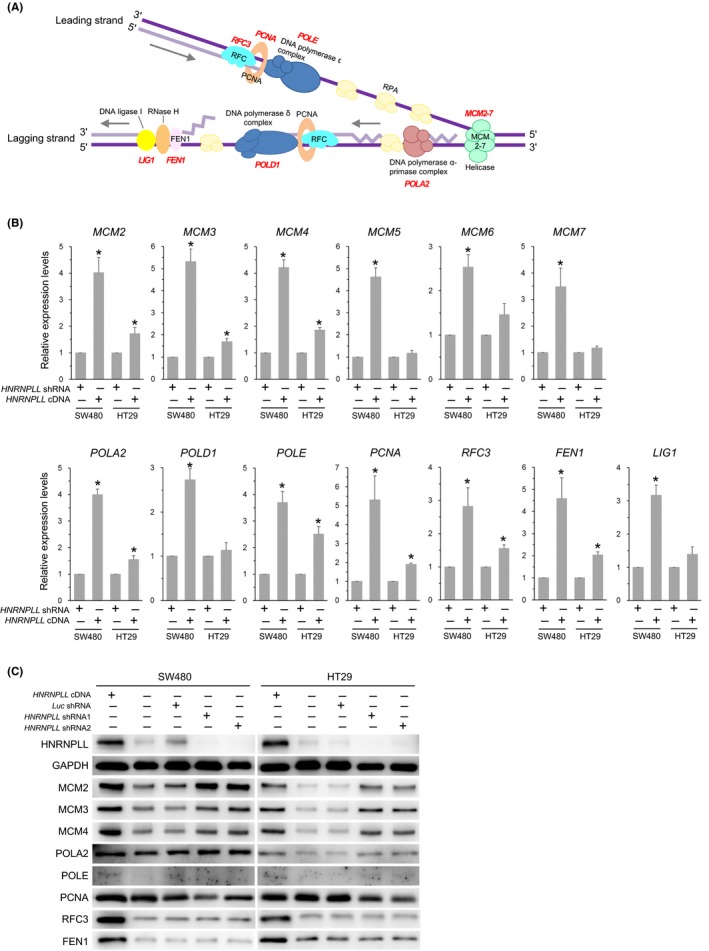
Identification of the DNA replication‐related genes whose mRNA levels are reproducibly upregulated by HNRNPLL overexpression in both SW480 and HT29 cells. A, Schematic representation of the DNA replication process modified from the KEGG pathway map (KEGG 03030). The DNA replication‐related genes whose expression levels were increased >3 times in the HNRNPLL overexpressing cells as compared to the HNRNPLL knocked down cells in the RNA sequencing analysis are indicated in red. B, Expression levels of the 13 DNA replication‐related genes identified by the RNAseq analysis were determined by quantitative RT‐PCR. Error bars, SD. *P < .05. C, western blot analysis for protein products of the genes upregulated by HNRNPLL overexpression in both SW480 and HT29 cells
3.3. Knockdown of PCNA, RFC3 or FEN1 suppresses cell proliferation induced by HNRNPLL
To determine the role of the upregulation of PCNA, RFC3 and FEN1 in the enhanced cell proliferation induced by HNRNPLL, we next knocked down these genes with siRNA (Figure 3A) and quantified their effects on cell proliferation by MTT assay (Figure 3B,C). In line with the results of cell cycle analysis (Figure 1A‐D), HNRNPLL overexpression significantly increased the MTT activity of SW480 cells (P = .036; Figure 3B) and HT29 cells (P = .026; Figure 3C). Transfection of siRNA targeting PCNA, RFC3 or FEN1 alone significantly suppressed the MTT activity of HNRNPLL overexpressing SW480 cells (P = .030, .038, and .027, respectively; Figure 3B), whereas none of these siRNA significantly suppressed the MTT activity of the mock‐transduced SW480 cells (P = .020, .032 and .012, respectively; Figure 3B). The MTT activity of the HNRNPLL overexpressing cells treated with siRNA for PCNA, RFC3 or FEN1 was comparable to that of the mock‐transduced cells treated with the same siRNA (P = .50, .78 and .21 for PCNA, RFC3 and FEN1 siRNA, respectively; Figure 3B). Similar results were obtained for HT29 cells (Figure 3C; see the figure legend for the individual P‐values). These results suggest that none of PCNA, RFC3 and FEN1 is dispensable for the enhancement of cell proliferation caused by HNRNPLL overexpression. We then tested whether simultaneous overexpression of PCNA, RFC3 and FEN1 cDNA enhances proliferation of SW480 or HT29 cells (Figure 3D). Intriguingly, the co‐overexpression of the 3 cDNA failed to enhance their MTT activity (Figure 3E), indicating that PCNA, RFC3 and FEN1 are necessary but not sufficient for the HNRNPLL‐induced enhancement of cell proliferation.
Figure 3.
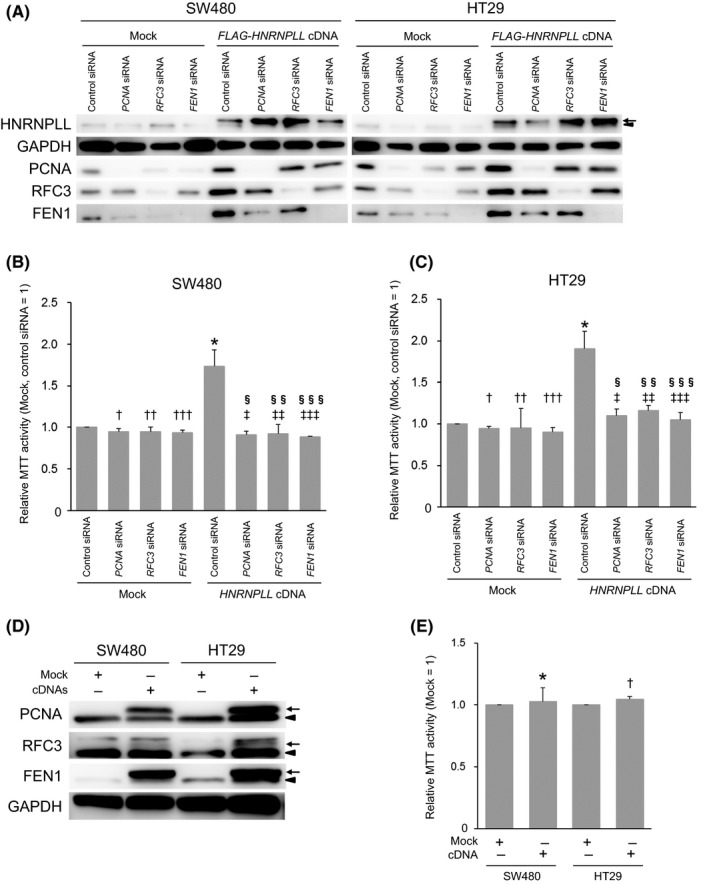
Knockdown of PCNA,RFC3 or FEN1 suppresses the increased cell proliferation caused by HNRNPLL overexpression. A, Western blot analysis to confirm the overexpression of HNRNPLL and knockdown of PCNA, RFC3 and FEN1. Arrows and arrowheads indicate FLAG‐tagged or endogenous HNRNPLL, respectively. B, MTT assay was performed for Mock‐ or HNRNPLL cDNA‐transduced SW480 cells 72 h after transfection of control siRNA or siRNA(s) targeting PCNA,RFC3, or FEN1. Error bars, SD. P = .036 (*), .20 (†), .32 (††), .12 (†††), .030 (‡), .038 (‡‡), .027 (‡‡‡), .50 (§), .78 (§§) and .21 (§§§). C, MTT assay was performed for Mock‐ or HNRNPLL cDNA‐transduced HT29 cells 72 h after transfection of control siRNA or siRNA(s) targeting PCNA,RFC3, or FEN1. Error bars, SD. P = .026 (*), .079 (†), .79 (††), .12 (†††), .036 (‡), .040 (‡‡), .033 (‡‡‡), .12 (§), .34 (§§) and .18 (§§§). D, Western blot analysis to confirm the overexpression of FLAG‐PCNA, FLAG‐RFC3 and FLAG‐FEN1 in SW480 and HT29 cells simultaneously transduced with their cDNAs. Arrows and arrowheads indicate FLAG‐tagged or endogenous proteins, respectively. E, MTT assay was performed for SW480 and HT29 cells transduced with mock vector or PCNA,RFC3 and FEN1 cDNA. Error bars, SD. P = .76 (*) and .090 (†)
3.4. HNRNPLL can bind to and stabilize PCNA, RFC3 and FEN1 mRNA
We next addressed the mechanism underlying the upregulation of PCNA, RFC3 and FEN1 mRNA by HNRNPLL overexpression. As HNRNPLL is an RNA‐binding protein, we tested whether HNRNPLL would bind to pre‐mRNA and/or matured mRNA of these genes by RNA‐immunoprecipitation assays. FLAG‐HNRNPLL was transduced into SW480 and HT29 cells and FLAG‐immunoprecipitated RNA was subjected to cDNA synthesis using random or oligo(dT) primers. PCR analysis using primer sets targeting introns and 3′‐UTR was then performed to detect pre‐mRNA and mRNA of PCNA, RFC3 and FEN1, respectively. The results indicate that HNRNPLL binds to both pre‐mRNA and mRNA of these genes (Figure 4A). Because many HNRNP proteins are known to bind to and thereby stabilize mRNA, we next assessed the role of HNRNPLL in regulating mRNA stability by treatment with the transcription inhibitor actinomycin D. As shown in Figure 4B, the mRNA levels of these genes following 12 h of actinomycin D treatment were significantly increased in the HNRNPLL overexpressing cells as compared to the HNRNPLL knocked down cells (Figure 4B; see the figure legend for the individual P‐values), indicating that HNRNPLL can suppress mRNA degradation of these genes.
Figure 4.
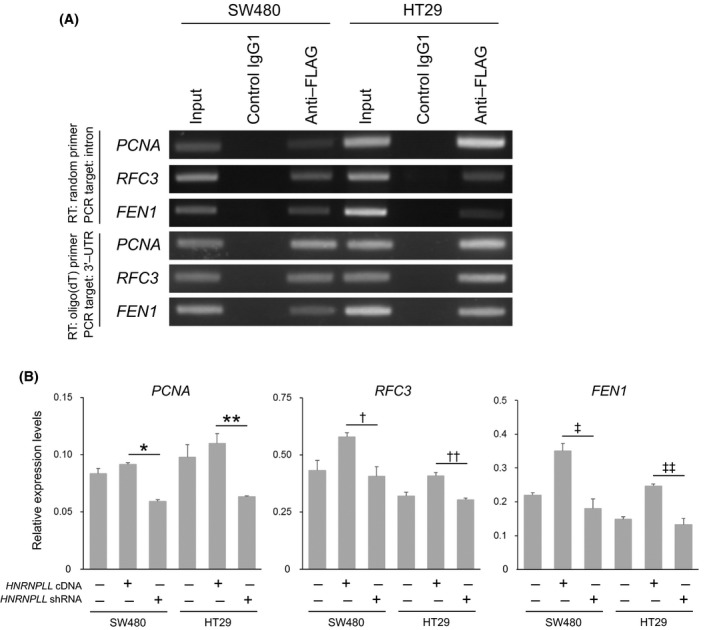
HNRNPLL binds to and stabilizes mRNA of PCNA,RFC3 and FEN1. A, RNA immunoprecipitated from total RNA of SW480 or HT29 cells overexpressing FLAG‐HNRNPLL was subjected to reverse transcription using random primers or oligo(dT) primers, followed by PCR analysis using primers targeting introns or 3′‐UTR of PCNA,RFC3 or FEN1. B, mRNA expression levels of PCNA,RFC3 and FEN1 in HNRNPLL overexpressing cells or HNRNPLL knocked down cells treated with actinomycin D for 12 h were determined by quantitative RT‐PCR. Error bars, SD. P = .0021 (*), .020 (**), .034 (†), .011 (††), .021 (‡) and .014 (‡‡)
3.5. Expression levels of PCNA, RFC3 and FEN1 are clinically relevant to the level of HNRNPLL in colorectal cancer
We next explored the clinical relevance of the regulation of PCNA, RFC3 and FEN1 by HNRNPLL. Using the Cancer Genome Atlas (TCGA) dataset of RNA sequencing for colorectal cancer samples, we assessed if the level of HNRNPLL expression is linked to that of PCNA, RFC3 and FEN1. In the dataset, 5.0% of the patients (19/379) showed a high level of HNRNPLL expression as defined by the Z‐score of >2. We found that PCNA, RFC3 and FEN1 were highly expressed in 31.6%, 47.4% and 5.3%, respectively, of the patients with a high level of HNRNPLL (n = 19), whereas they were highly expressed in 11.4%, 20.8% and 1.9%, respectively, of the patients with low or middle levels of HNRNPLL expression (n = 360) (Table 2). This result suggests a positive correlation between overexpression of HNRNPLL and that of PCNA, RFC3 and FEN1. We next tested their link at individual cell levels by immunohistochemical analysis of human colorectal cancer samples. The results indicated that KRT20+ cancer cells showing strong HNRNPLL staining exhibited higher expression levels of PCNA (Figure 5A), RFC3 (Figure 5B) and FEN1 (Figure 5C) as compared to those showing weak HNRNPLL staining, further indicating a correlation between the levels of these proteins and the HNRNPLL level. In clear contrast, the expression level of CDKN1A, a protein known to inhibit FEN1 recruitment by PCNA,17 was higher in cancer cells showing weak HNRNPLL staining (Figure 5D). These results strongly indicate that the HNRNPLL expression level is closely associated with the expression levels of PCNA, RFC3 and FEN1 in vivo.
Table 2.
Percentages of PCNA‐overexpressed, RFC3‐overexpressed or FEN1‐overexpressed patients are increased in HNRNPLL‐overexpressed patients
| HNRNPLL‐high (n = 19) | HNRNPLL‐medium (n = 357) | HNRNPLL‐low (n = 3) | HNRNPLL‐medium/low (n = 360) | ||||||||
|---|---|---|---|---|---|---|---|---|---|---|---|
| PCNA‐high | PCNA‐medium | PCNA‐low | PCNA‐high | PCNA‐medium | PCNA‐low | PCNA‐high | PCNA‐medium | PCNA‐low | PCNA‐high | PCNA‐medium | PCNA‐low |
| 6 (31.6%) | 13 (68.4%) | 0 (0.0%) | 41 (11.5%) | 313 (87.7%) | 3 (0.8%) | 0 (0.0%) | 3 (100.0%) | 0 (0.0%) | 41 (11.4%) | 316 (87.8%) | 3 (0.8%) |
| HNRNPLL‐high (n = 19) | HNRNPLL‐medium (n = 357) | HNRNPLL‐low (n = 3) | HNRNPLL‐medium/low (n = 360) | ||||||||
|---|---|---|---|---|---|---|---|---|---|---|---|
| RFC3‐high | RFC3‐medium | RFC3‐low | RFC3‐high | RFC3‐medium | RFC3‐low | RFC3‐high | RFC3‐medium | RFC3‐low | RFC3‐high | RFC3‐medium | RFC3‐low |
| 9 (47.4%) | 10 (52.6%) | 0 (0.0%) | 75 (21.0%) | 282 (79.0%) | 0 (0.0%) | 0 (0.0%) | 3 (100.0%) | 0 (0.0%) | 75 (20.8%) | 285 (79.2%) | 0 (0.0%) |
| HNRNPLL‐high (n = 19) | HNRNPLL‐medium (n = 357) | HNRNPLL‐low (n = 3) | HNRNPLL‐medium/low (n = 360) | ||||||||
|---|---|---|---|---|---|---|---|---|---|---|---|
| FEN1‐high | FEN1‐medium | FEN1‐low | FEN1‐high | FEN1‐medium | FEN1‐low | FEN1‐high | FEN1‐medium | FEN1‐low | FEN1‐high | FEN1‐medium | FEN1‐low |
| 1 (5.3%) | 18 (94.7%) | 0 (0.0%) | 7 (2.0%) | 349 (97.8%) | 1 (0.3%) | 0 (0.0%) | 3 (100.0%) | 0 (0.0%) | 7 (1.9%) | 352 (97.8%) | 1 (0.3%) |
High, medium and low indicate expression levels with Z‐scores of >2, 0.5 ≤ 2 and <0.5, respectively.
Figure 5.
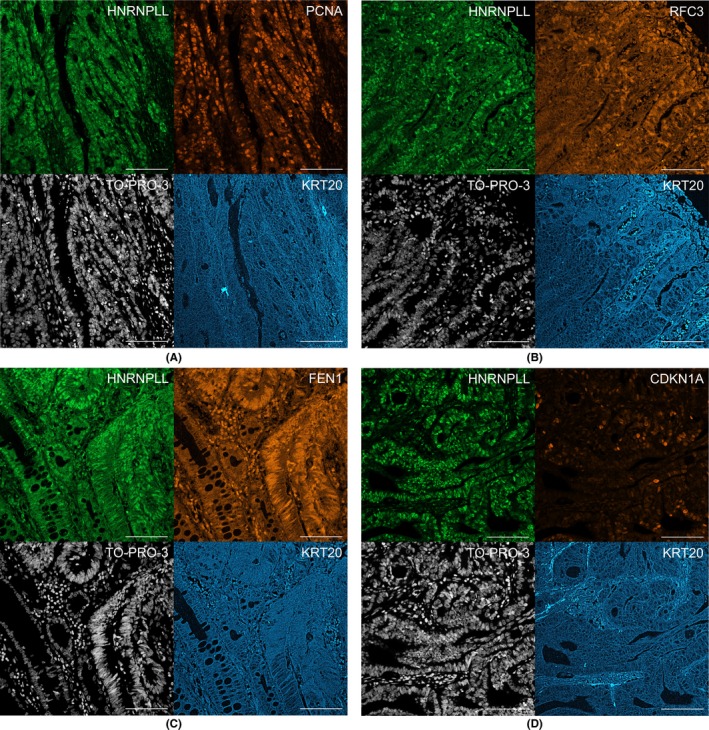
Immunohistochemical analysis for HNRNPLL, PCNA, RFC3 and FEN1 in clinical samples of colorectal cancer. A‐D, Sections from primary colorectal cancer was stained for HNRNPLL (green), PCNA (A, orange), RFC3 (B, orange), FEN1 (C, orange), CDKN1A (D, orange), TO‐PRO‐3 (white) and KRT20 (blue). Scale bars, 100 μm
4. DISCUSSION
In this study, we demonstrated that HNRNPLL stabilizes mRNA encoding DNA replication regulators, namely PCNA, RFC3 and FEN1. DNA replication is a complex process that is regulated by a large number of molecules.18 PCNA is a ring‐shaped protein encircling DNA to enhance the processivity of DNA polymerases δ and ε, which are required for the synthesis of the lagging and leading strands, respectively.19 PCNA is, thus, categorized as a DNA clamp. RFC3 is 1 of the 5 subunits of replication factor C (RFC), which is classified as a clamp loader because it loads PCNA around DNA.20 FEN1 is an endonuclease known for its essential roles in the maturation of Okazaki fragment and long‐patch base excision repair.21 As expected from the pivotal functions of PCNA, RFC3and FEN1 in DNA replication, dysregulated expression of these proteins has been linked to cancer. Specifically, PCNA is a well‐established proliferation marker in some types of cancer.22, 23, 24 RFC3 is associated with proliferation activity of breast cancer cells25 or poor prognosis in ovarian cancer patients.26 Overexpression of FEN1 has been associated with enhanced cancer cell proliferation or poor clinical outcome in gastric,27 breast,28 ovarian28 and non‐small‐cell lung cancer.29 FEN1 is known to be activated by PCNA30 and RFC,31 indicating a coordinated function of PCNA, RFC3 and FEN1 in lagging strand synthesis. Our data indicate that none of PCNA, RFC3 or FEN1 is dispensable for the proliferation‐enhancing activity of HNRNPLL in colorectal cancer cells (Figure 3B,C). It is plausible that HNRNPLL may drive this coordinated machinery for lagging strand synthesis by upregulating these components.
We demonstrated that simultaneous overexpression of PCNA, RFC3 and FEN1 did not increase MTT activity of SW480 and HT29 cells (Figure 3E), whereas HNRNPLL overexpression promoted it (Figure 3B,C). We speculate that HNRNPLL induces other genes or splice variants that also contribute to the proliferation‐promoting effect of HNRNPLL. Shedding light on those genes that are not listed in the DNA replication pathway but are involved in cell cycle progression may provide a clue to this issue. In contrast, knockdown of PCNA, RFC3 or FEN1 did not attenuate the MTT activity of SW480 and HT29 cells that do not overexpress HNRNPLL (Figure 3B,C). Although the precise reason for the differential effect of knocking down these factors on cell proliferation according to HNRNPLL expression levels remains unclear, Lockwood et al32 report a similar finding. Namely, they show that RFC3 was overexpressed by gene amplification in approximately 25% of esophageal adenocarcinoma patients and that knockdown of RFC3 in cancer cells with increased copy numbers inhibited their proliferation, whereas its knockdown had little effect on cancer cells without copy number increase. To the best of our knowledge, there is no clear evidence for RFC3 gene amplification in colorectal cancer.
Our recent work suggested that HNRNPLL suppresses invasion and metastasis of colorectal cancer during EMT by regulating alternative splicing of CD44 pre‐mRNA. This study instead demonstrates the role of HNRNPLL in colorectal cancer cell proliferation through stabilization of certain mRNA. High expression of RNA‐binding proteins with pre‐mRNA splicing activity has been shown to promote various steps of cancer progression via mechanisms distinct from pre‐mRNA splicing. Fagoonee et al analyzed the TCGA data and found that expression of ESRP1 is elevated in 16% of colorectal cancer samples. They demonstrated that ESRP1 promotes colorectal cancer progression through 2 distinct mechanisms. ESRP1 binds to the SNAIL mRNA and promotes its SNAIL, while ESRP1 increases FGF7 expression and enhances the AKT signaling pathway downstream of the FGFR2 receptor in an autocrine fashion, resulting in increased SNAIL transcription and SNAIL protein stabilization.33 HNRNPK is often overexpressed in colorectal cancer cells, and, as mentioned in the Introduction, HNRNPK promotes their proliferation through stabilization of CDK6 mRNA,10 enhanced translation of mRNA encoding BTK,11 transcriptional control of CDKN2B,8 as well as through pre‐mRNA splicing of MRPL33.7
Our finding that HNRNPLL promotes colorectal cancer cell proliferation suggests a potential use of HNRNPLL as a therapeutic target. This strategy may be difficult because knockdown of HNRNPLL in colorectal cancer cells significantly enhanced invasion activity in vitro and increased lung metastasis in vivo.4 Nevertheless, inhibition of excessive HNRNPLL expression can be a potential strategy for tumor volume reduction. To identify the molecules regulating HNRNPLL overexpression, it will be important to elucidate the mechanism of the transcriptional regulation of HNRNPLL, which is currently under investigation.
CONFLICT OF INTEREST
The authors have no conflict of interest to declare.
Supporting information
ACKNOWLEDGMENTS
This work was supported in part by a Grant‐in‐Aid for Scientific Research (C) (25430129 and 16K07138) and a Grant‐in‐Aid for Scientific Research (B) (26290045) from the Japan Society for the Promotion of Science, and by grants from the Takeda Science Foundation and Daiwa Securities Health Foundation, Japan.
Sakuma K, Sasaki E, Kimura K, et al. HNRNPLL stabilizes mRNA for DNA replication proteins and promotes cell cycle progression in colorectal cancer cells. Cancer Sci. 2018;109:2458–2468. 10.1111/cas.13660
REFERENCES
- 1. Jemal A, Bray F, Center MM, Ferlay J, Ward E, Forman D. Global cancer statistics. CA Cancer J Clin. 2011;61:69‐90. [DOI] [PubMed] [Google Scholar]
- 2. Oberdoerffer S, Moita LF, Neems D, Freitas RP, Hacohen N, Rao A. Regulation of CD45 alternative splicing by heterogeneous ribonucleoprotein, hnRNPLL. Science. 2008;321:686‐691. [DOI] [PMC free article] [PubMed] [Google Scholar]
- 3. Benson MJ, Aijo T, Chang X, et al. Heterogeneous nuclear ribonucleoprotein L‐like (hnRNPLL) and elongation factor, RNA polymerase II, 2 (ELL2) are regulators of mRNA processing in plasma cells. Proc Natl Acad Sci USA. 2012;109:16252‐16257. [DOI] [PMC free article] [PubMed] [Google Scholar]
- 4. Sakuma K, Sasaki E, Kimura K, et al. HNRNPLL, a newly identified colorectal cancer metastasis suppressor, modulates alternative splicing of CD44 during epithelial‐mesenchymal transition. Gut. 2017;5:91. [DOI] [PubMed] [Google Scholar]
- 5. Han SP, Tang YH, Smith R. Functional diversity of the hnRNPs: past, present and perspectives. Biochem J. 2010;430:379‐392. [DOI] [PubMed] [Google Scholar]
- 6. Geuens T, Bouhy D, Timmerman V. The hnRNP family: insights into their role in health and disease. Hum Genet. 2016;135:851‐867. [DOI] [PMC free article] [PubMed] [Google Scholar]
- 7. Liu L, Luo C, Luo Y, et al. MRPL33 and its splicing regulator hnRNPK are required for mitochondria function and implicated in tumor progression. Oncogene. 2017;37:86‐94. [DOI] [PubMed] [Google Scholar]
- 8. Kim T, Jeon YJ, Cui R, et al. Role of MYC‐regulated long noncoding RNAs in cell cycle regulation and tumorigenesis. J Natl Cancer Inst. 2015;107:dju505. [DOI] [PMC free article] [PubMed] [Google Scholar]
- 9. Zhu XH, Wang JM, Yang SS, et al. Down‐regulation of DAB2IP promotes colorectal cancer invasion and metastasis by translocating hnRNPK into nucleus to enhance the transcription of MMP2. Int J Cancer. 2017;141:172‐183. [DOI] [PubMed] [Google Scholar]
- 10. Kawasaki Y, Komiya M, Matsumura K, et al. MYU, a target lncRNA for Wnt/c‐Myc signaling, mediates induction of CDK6 to promote cell cycle progression. Cell Rep. 2016;16:2554‐2564. [DOI] [PubMed] [Google Scholar]
- 11. Grassilli E, Pisano F, Cialdella A, et al. A novel oncogenic BTK isoform is overexpressed in colon cancers and required for RAS‐mediated transformation. Oncogene. 2016;35:4368‐4378. [DOI] [PMC free article] [PubMed] [Google Scholar]
- 12. Nishitani H, Taraviras S, Lygerou Z, Nishimoto T. The human licensing factor for DNA replication Cdt1 accumulates in G1 and is destabilized after initiation of S‐phase. J Biol Chem. 2001;276:44905‐44911. [DOI] [PubMed] [Google Scholar]
- 13. Wohlschlegel JA, Dwyer BT, Dhar SK, Cvetic C, Walter JC, Dutta A. Inhibition of eukaryotic DNA replication by geminin binding to Cdt1. Science. 2000;290:2309‐2312. [DOI] [PubMed] [Google Scholar]
- 14. McGarry TJ, Kirschner MW. Geminin, an inhibitor of DNA replication, is degraded during mitosis. Cell. 1998;93:1043‐1053. [DOI] [PubMed] [Google Scholar]
- 15. Sakaue‐Sawano A, Kurokawa H, Morimura T, et al. Visualizing spatiotemporal dynamics of multicellular cell‐cycle progression. Cell. 2008;132:487‐498. [DOI] [PubMed] [Google Scholar]
- 16. Kanehisa M, Goto S. KEGG: kyoto encyclopedia of genes and genomes. Nucleic Acids Res. 2000;28:27‐30. [DOI] [PMC free article] [PubMed] [Google Scholar]
- 17. Chen U, Chen S, Saha P, Dutta A. p21Cip1/Waf1 disrupts the recruitment of human Fen1 by proliferating‐cell nuclear antigen into the DNA replication complex. Proc Natl Acad Sci USA. 1996;93:11597‐11602. [DOI] [PMC free article] [PubMed] [Google Scholar]
- 18. Leman AR, Noguchi E. The replication fork: understanding the eukaryotic replication machinery and the challenges to genome duplication. Genes (Basel). 2013;4:1‐32. [DOI] [PMC free article] [PubMed] [Google Scholar]
- 19. Moldovan GL, Pfander B, Jentsch S. PCNA, the maestro of the replication fork. Cell. 2007;129:665‐679. [DOI] [PubMed] [Google Scholar]
- 20. Yao NY, O'Donnell M. The RFC clamp loader: structure and function. Subcell Biochem. 2012;62:259‐279. [DOI] [PMC free article] [PubMed] [Google Scholar]
- 21. Balakrishnan L, Bambara RA. Flap endonuclease 1. Annu Rev Biochem. 2013;82:119‐138. [DOI] [PMC free article] [PubMed] [Google Scholar]
- 22. Guzinska‐Ustymowicz K, Pryczynicz A, Kemona A, Czyzewska J. Correlation between proliferation markers: PCNA, Ki‐67, MCM‐2 and antiapoptotic protein Bcl‐2 in colorectal cancer. Anticancer Res. 2009;29:3049‐3052. [PubMed] [Google Scholar]
- 23. Bologna‐Molina R, Mosqueda‐Taylor A, Molina‐Frechero N, Mori‐Estevez AD, Sanchez‐Acuna G. Comparison of the value of PCNA and Ki‐67 as markers of cell proliferation in ameloblastic tumors. Med Oral Patol Oral Cir Bucal. 2013;18:e174‐e179. [DOI] [PMC free article] [PubMed] [Google Scholar]
- 24. Jurikova M, Danihel L, Polak S, Varga I. Ki67, PCNA, and MCM proteins: markers of proliferation in the diagnosis of breast cancer. Acta Histochem. 2016;118:544‐552. [DOI] [PubMed] [Google Scholar]
- 25. He ZY, Wu SG, Peng F, et al. Up‐regulation of RFC3 promotes triple negative breast cancer metastasis and is associated with poor prognosis via EMT. Transl Oncol. 2017;10:1‐9. [DOI] [PMC free article] [PubMed] [Google Scholar]
- 26. Shen H, Cai M, Zhao S, et al. Overexpression of RFC3 is correlated with ovarian tumor development and poor prognosis. Tumour Biol. 2014;35:10259‐10266. [DOI] [PubMed] [Google Scholar]
- 27. Wang K, Xie C, Chen D. Flap endonuclease 1 is a promising candidate biomarker in gastric cancer and is involved in cell proliferation and apoptosis. Int J Mol Med. 2014;33:1268‐1274. [DOI] [PubMed] [Google Scholar]
- 28. Abdel‐Fatah TM, Russell R, Albarakati N, et al. Genomic and protein expression analysis reveals flap endonuclease 1 (FEN1) as a key biomarker in breast and ovarian cancer. Mol Oncol. 2014;8:1326‐1338. [DOI] [PMC free article] [PubMed] [Google Scholar]
- 29. Zhang K, Keymeulen S, Nelson R, et al. Overexpression of flap Endonuclease 1 correlates with enhanced proliferation and poor prognosis of non‐small‐cell lung cancer. Am J Pathol. 2017;188:242‐251. [DOI] [PMC free article] [PubMed] [Google Scholar]
- 30. Li X, Li J, Harrington J, Lieber MR, Burgers PM. Lagging strand DNA synthesis at the eukaryotic replication fork involves binding and stimulation of FEN‐1 by proliferating cell nuclear antigen. J Biol Chem. 1995;270:22109‐22112. [DOI] [PubMed] [Google Scholar]
- 31. Cho IT, Kim DH, Kang YH, et al. Human replication factor C stimulates flap endonuclease 1. J Biol Chem. 2009;284:10387‐10399. [DOI] [PMC free article] [PubMed] [Google Scholar]
- 32. Lockwood WW, Thu KL, Lin L, et al. Integrative genomics identified RFC3 as an amplified candidate oncogene in esophageal adenocarcinoma. Clin Cancer Res. 2012;18:1936‐1946. [DOI] [PMC free article] [PubMed] [Google Scholar]
- 33. Fagoonee S, Picco G, Orso F, et al. The RNA‐binding protein ESRP1 promotes human colorectal cancer progression. Oncotarget. 2017;8:10007‐10024. [DOI] [PMC free article] [PubMed] [Google Scholar]
Associated Data
This section collects any data citations, data availability statements, or supplementary materials included in this article.
Supplementary Materials