
FIG 4 .
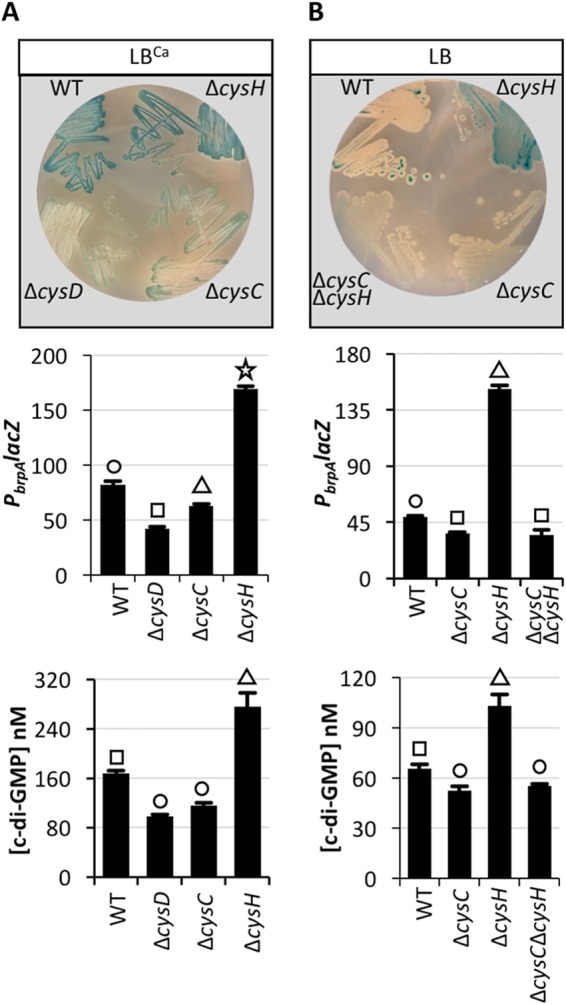
PbrpA expression is reduced in a ΔcysD or ΔcysC mutant and induced in a cysH mutant. The indicated strains were grown on LBCa (A) or LB (B) agar plates containing X-Gal (top), and the same strains were grown in LB ± 10 mM CaCl2 for quantification of PbrpA lacZ expression (middle) and the intracellular c-di-GMP concentration (bottom) in the WT and cys mutants. Statistically significant differences among the samples (P < 0.001 as determined by one-way ANOVA followed by pairwise comparisons with a Bonferroni adjustment) are indicated by different symbols above each bar.