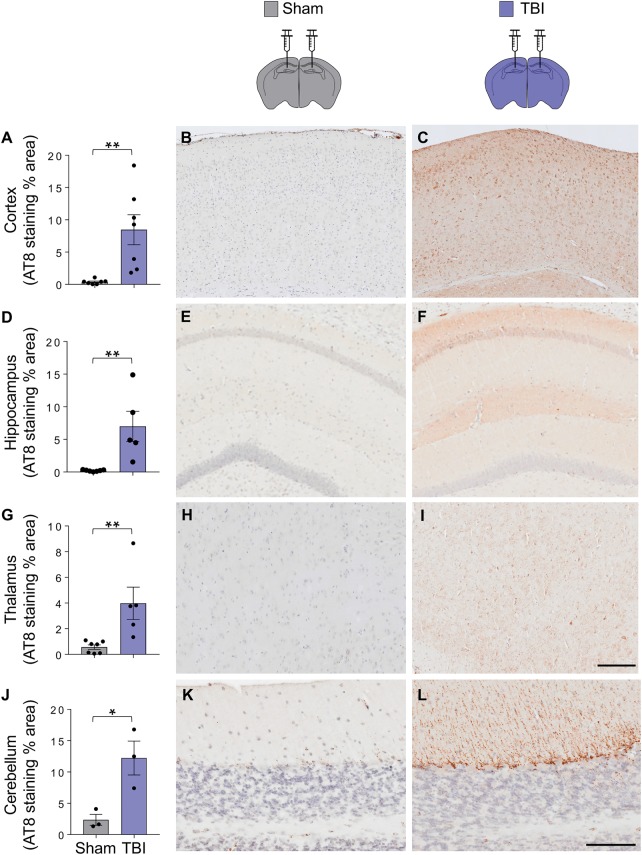
Figure 7.
Evidence of tau pathology in mice inoculated with TBI homogenates. Quantification of the per cent area covered by AT8 staining in the cortex (A–C), hippocampus (D–F), thalamus (G–I), and cerebellum (J–L). Data are mean ± SEM; n = 3–6; *P < 0.05; **P < 0.01 by unpaired t-test. Scale bars = 100 µm (B–I) and 200 µm (K and L).

