Abstract
A method was developed and validated to quantify abiraterone in human plasma. During assay development several analytical challenges were encountered: limited stability in patient samples, adsorption to glass, co-elution with metabolites, and carry-over issues. Limited stability (2h) was found for abiraterone in fresh plasma as well as whole blood at ambient temperature. When kept at 2–8°C, abiraterone in plasma was stable for 24h and in whole blood for 8h.
Adsorption of abiraterone to glass materials was addressed by using polypropylene throughout the method. Carry-over was reduced to acceptable limits by incorporating a third mobile phase into the gradient. The chromatographic separation of abiraterone with its multiple metabolites was addressed by using a longer analytical column and adjusting the gradient. Abiraterone was extracted by protein precipitation, separated on a C18-column with gradient elution and analyzed with tandem quadrupole mass spectrometry in positive ion mode. A stable deuterated isotope was used as the internal standard. The assay ranges from 1–500 ng/mL. Within–and between day precisions and accuracies were below 13.4% and within 95–102%. This bioanalytical-method was successfully validated and applied to determine plasma concentrations of abiraterone in clinical studies and in regular patient care for patients with metastatic castration resistant prostate cancer.
Keywords: LC-MS/MS, abiraterone, abiraterone acetate, stability, validation
1. Introduction
Abiraterone acetate is a novel oral, androgen receptor- targeted drug for the treatment of metastatic castration resistant prostate cancer (mCRPC)(Ryan et al., 2010). Abiraterone is a selective and irreversible blocker of cytochrome P450 C17 enzyme (CYP17), which is a crucial enzyme in testosterone and estrogen synthesis. Treatment with abiraterone acetate results in virtually undetectable serum and intratumoral androgen levels and hereby prolongs survival(de Bono et al., 2011; O’Donnell et al., 2004; Ryan et al., 2013; Ryan et al., 2010). In vivo, abiraterone acetate is rapidly hydrolysed to abiraterone(Acharya et al., 2013). Abiraterone acetate is undetectable in human plasma(Ryan et al., 2010).
Pharmacokinetic characteristics of abiraterone show interesting features which makes it potentially interesting for therapeutic drug monitoring(TDM). First of all, food may improve the uptake of abiraterone by 10-fold(Chi et al., 2015). Abiraterone shows large between patient variability (40.7–140.0%)(EMA, 2016). Finally, a relation between drug exposure(Ctrough) and PSA decrease and a relation between PSA decrease and survival was shown for abiraterone which indirectly points out the relevance of adequate exposure levels for optimal treatment outcome(Xu et al., 2016). A better understanding of abiraterone pharmacokinetics will help to optimize the dose of the individual patient. To support ongoing clinical trials and to optimize individual patient care, an assay for the quantification of abiraterone was developed.
Several analytical techniques have been published to quantify abiraterone in human plasma, including HPLC(Belleville et al., 2015) and LC-MS/MS(Alyamani et al., 2016; Gurav et al., 2012; Martins,Asad,Wilsher, & Raynaud, 2006). In our opinion, these assays have some important limitations. For instance, sample preparation is labor-intensive, and the use of internal standards was variable and suboptimal(Alyamani et al., 2016; Belleville et al., 2015; Gurav et al., 2012; Martins et al., 2006). The aim of the present study was to develop and validate a more convenient, robust, sensitive and specific LC-MS/MS method for abiraterone. This validated assay has been used for pharmacokinetic studies and regular patient care.
2. Experimental
2.1. Chemicals and reagents
Abiraterone, and the deuterated stable isotope-labeled D4-Abiraterone were obtained from Alsachim (Illkirch-Graffenstaden, France). Dimethyl-sulfoxide (DMSO, Seccosolv), and Acetonitrile(ACN) (Lichrosolv) were provided by Merck (Darmstadt, Germany). Formic acid was obtained from Sigma-Aldrich (Zwijndrecht, The Netherlands). High purity Milli-Q water was produced in the laboratory using a MilliQ Gradient water purification system (Millipore, Amsterdam, The Netherlands).
Cellstar Tubes (5 and 50 ml) were provided by Greiner Bio-one (Alphen a/d Rijn, The Netherlands). Polypropylene Screw Vials and Safe Lock Tubes were supplied by Agilent (Amstelveen, The Netherlands) and Eppendorf (Nijmegen, The Netherlands) respectively. EDTA plasma was prepared from EDTA whole blood provided by Sanquin (Amsterdam, The Netherlands).
2.2. Preparation of stock solutions, calibration standards, quality control samples and internal standard solution
Two independent abiraterone stocks were used: one for the preparation of calibration standards (CS) and one for quality control samples (QC). Throughout the procedure of preparing stock, CS and QC solutions, only polypropylene vials and tubes were used. Stock solutions were prepared in DMSO at a nominal concentration of 1 mg/mL abiraterone and D4-abiraterone. A substock was prepared by adding 100µL to 250mL ACN. Before each run a calibration curve was freshly prepared by adding stock solution to EDTA plasma to obtain 1, 5, 25, 100, 250, 375 and 500 ng/mL abiraterone in plasma. The QC stock solution was diluted in human EDTA plasma to yield QC concentration levels of 5, 300, and 400 ng/mL abiraterone in plasma. The precipitation solution was enriched with IS stock solution by adding 250 µL IS stock solution to 250 mL ACN.
2.3. Sample preparation
Protein precipitation as a sample pre-treatment was performed by adding 800µL precipitation solution to 200µL plasma sample. The mixture was immediately vortex-mixed for 5 min. and centrifuged for 5 min. at 14000 RPM. 250 µL supernatant was transferred to a polypropylene autosampler vial.
2.4. Chromatographic conditions
The LC-MS system consisted of an Acquity H-Class UPLC system, coupled to a Xevo TQ-S Micro Tandem Mass Spectrometer (Waters, Wilford, MA, USA). Chromatographic separation was performed by injecting 2 µL onto a Acquity BEH C18 Column (2.1*100 mm, 1.7 µm particle size, Waters).
Mobile phase A consisted of 0.1% formic acid in water (Milli-Q), mobile phase B consisted of 0.1% formic acid in ACN and mobile phase C consisted of 1% of formic acid in ACN. The following linear gradient was used at a flow rate of 0.5 ml/min: time scale (min – min) mobile phase A (%)/mobile phase B (%)/ mobile phase C (%)]: (0–0.5) 90/10/0 →(0.5–7.5) 10/90/0 →(7.6–8.6) 10/0/90 →(8.7–10) 90/10/0. The column temperature was kept at 40°C and the autosampler temperature at 4° C. The LC eluate was directed into a tandem quadrupole, atmospheric pressure ionization (API) mass spectrometer (TQ-S detector, Acquity, Waters, Wilford, MA, USA) equipped with an electrospray ionization (ESI) source.
2.5. Mass spectrometric conditions
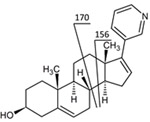
The mass spectrometer was operating in the positive ion mode and configured in multiple reaction monitoring (MRM) mode for quantification of abiraterone and its internal standard (m/z 350 → 156 and 354 → 160) (Table 1). A qualifier with mass transition 350 →170 was used to discriminate multiple metabolites from abiraterone. To screen for metabolites of abiraterone, the Mass Spectrometer was operated in Precursor Ion Mode (m/z 100–600 →156) and Product Ion Mode. For both abiraterone as D4-abiraterone the following optimized settings on the mass spectrometer were used capillary voltage was 3.76 kV, cone voltage was 47 V, desolvation temperature was 550° C desolvation gas flow was 1000L/h. Colision energy was 46 V, dwell time was 0,07 ms and typical retention time for abiraterone was 4.69min and for D4-abiraterone 4.64min.
Table 1:
Analytes with their selected mass transitions and proposed fragmentation pathways
| Compound | Transition | Proposed fragmentation |
|---|---|---|
| Abiraterone |
350→156 |
 |
| D4-Abiraterone | 354→160 | 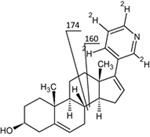 |
The data were acquired and processed using Masslynx™ Sofware (version 4.1, Waters, Etten-Leur, The Netherlands).
2.6. Quantification
Abiraterone was quantified in plasma by plotting the response ratio of abiraterone and D4-abiraterone against the concentrations of abiraterone. Quadratic curve fitting was used and weighted (1/x). Both calibration standards and quality control samples were analyzed in duplicate. The calibration line was chosen to cover the clinically relevant range of concentrations that are expected in patients treated with the registered dose. The LLOQ and HLOQ were selected at the outer range of the concentration levels measured in patients treated with abiraterone 1000 mg OD. Patient samples were analyzed singular, but, depending on sample volume, repeated throughout the validation procedure.
2.7. Validation procedures
The validation of the assay was performed according to the European Medicines Agency (EMA) for validation of bioanalytical assays including selectivity, carry-over, calibration curve, accuracy, precision, dilution integrity, matrix effect, recovery and stability(EMA, 2009).
3. Results and discussion
3.1. Assay development
During development of this method several challenges were met.
In glass autosampler vials the areas of the IS and abiraterone decreased over time. The additional poor reproducibility suggested that abiraterone strongly adsorbs onto glass containers. This hypothesis was tested by measuring abiraterone in glass and polypropylene autosampler vials, which clearly showed the adsorption effect in glass vials. Consequently, throughout the method polypropylene vials and utilities were used.
To gain insight in the short term stability of patient samples, the following experiment was performed: From three patients undergoing abiraterone treatment, fresh samples were collected by venipuncture. The same stability experiment was also performed in purchased EDTA whole blood. All samples were kept on ice, divided into aliquots of 500 µL and thereafter kept under three different circumstances (ambient temperature, 2–8 °C, and −40 °C) until sample preparation. One aliquot was processed immediately and stored at −40 °C. The concentration of this aliquot was considered to be 100%. At known time intervals (T=20, 60, 90, 120, 150, 180, 210, 240, 270, 300 min) aliquots were processed and stored at −40 °C until analysis.
Carry-over issues were encountered when only mobile phase A and B were used; after injecting a blank sample after the highest calibration standard three out of five blank injections showed an abiraterone peak area >20% of the area of the LLOQ. Carry-over was reduced to acceptable limits (all below 20% of the area of the LLOQ) by incorporating a third mobile phase C into the gradient consisting of 1% formic acid in ACN.
When the assay was first used to quantify abiraterone in patients treated which this drug, co-elution with phase I metabolites was observed. To address this problem, the linear gradient of the mobile phase was optimized and the column length was extended from 50 to 100 mm, enabling the chromatographic separation of abiraterone and its metabolites. With the screening for metabolites in precursor ion mode, precursors indicative for metabolites co eluting with abiraterone were not found. In both product ion mode and precursor ion mode several non-co eluting metabolites were detected. In depth structural identification was not performed.
3.2. Assay Validation
3.2.1. Calibration Curve
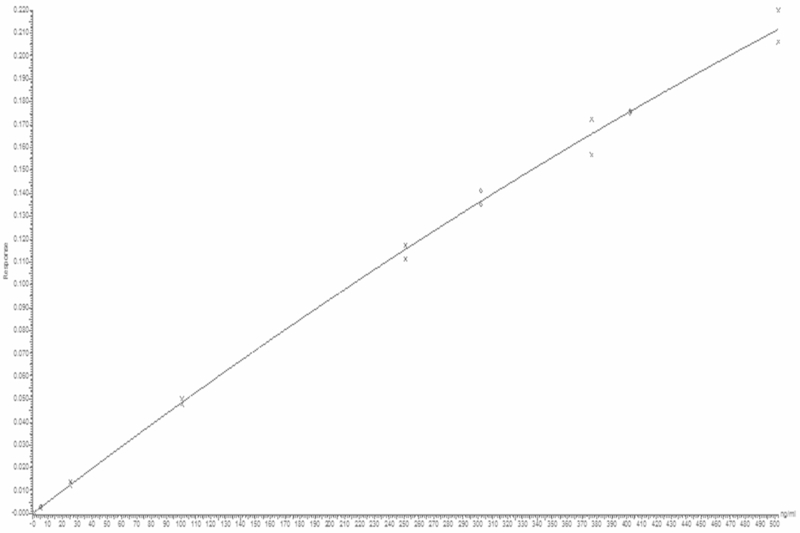
The calibration curve was prepared and analyzed by measuring 7 non-zero calibration standards (CS) in three independent analytical runs. A quadratic curve with 1/x as weighing factor proved to be the most optimal description of the relationship between the concentration and area ratio. The calibration curve covers the range from 1–500 ng/mL. To describe the calibration curve standards were used at the following concentration levels: 1, 5, 25, 100, 250, 375 and 500 ng/mL of abiraterone. At all concentration levels the deviations of the back-calculated concentrations were within ± 15% of the nominal concentrations (Figure 1). This is in accordance to EMA guidelines.
FIGURE 1.
Typical calibration curve of abiraterone (range 1–500 ng/mL).
3.2.2. Carry-over
Carry-over was tested by injecting a blank sample after the highest calibration standard, this was repeated 5 times. For abiraterone, no eluting peaks with areas of >20% of the LLOQ were observed. Peak height for the internal standard was <5% of the normal response of D4-abiraterone. Carry-over was therefore considered to be acceptable.
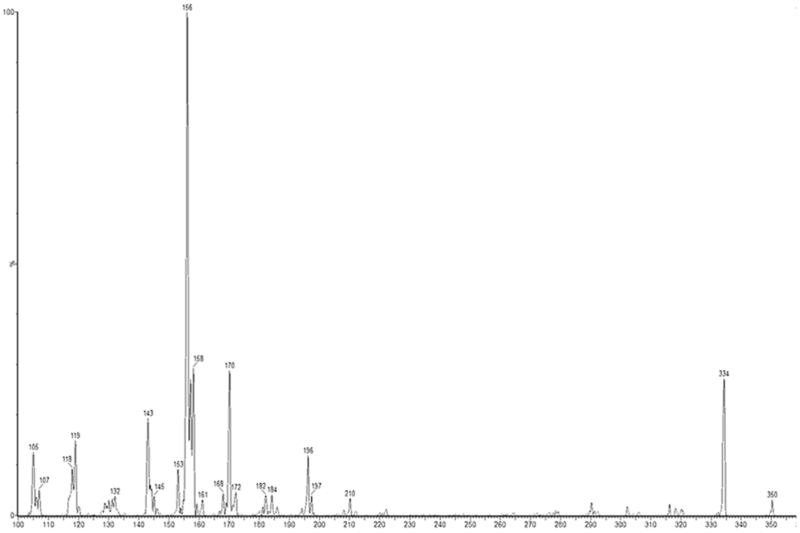
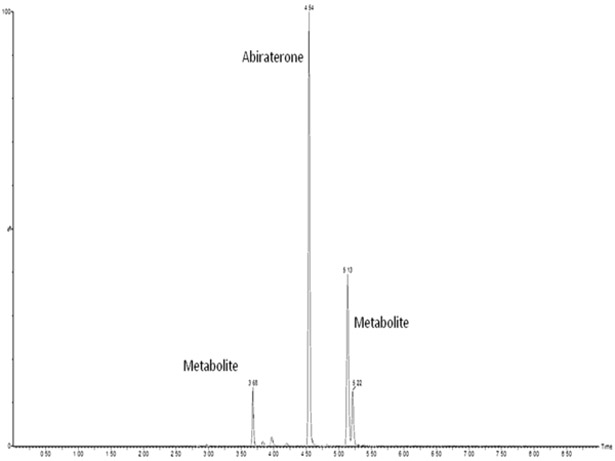
Figure 2 shows the fragmentation pattern of abiraterone. Figure 3 shows a representative chromatogram of a plasma sample from a treated patient.
FIGURE 2.
(+)ESI MS/MS spectrum and proposed fragmentation of abiraterone, transitions monitored for quantification are 350→156 for abiraterone and 354→160 for D4‐abiraterone.
FIGURE 3.
Representative chromatogram (multiple reaction monitoring 350.2→156.1) of a typical patient sample.
3.2.3. Precision, accuracy
To test the within-run precision, 5 replicates of the QC samples; QC LLOQ, QC low, QC medium, QC high and QC HLOQ were analyzed in one analytical run. To test the between-run precision, the same QC samples were analyzed in three analytical runs on three different days. Precision, expressed as CV values and accuracy, expressed as deviations from the nominal concentrations were below 13.4% and within 95–102%, respectively. Therefore, the precision and accuracy were within the acceptance criteria of the EMA guidelines.
3.2.4. Selectivity and specificity
The selectivity of the assay was tested in six different batches of blank control plasma. The blank controls showed no peaks co-eluting with abiraterone and D4-abiraterone. The maximum peak area was <5% of the signal of LLOQ abiraterone and the IS(D4-abiraterone). Based on these results we concluded that the selectivity was sufficient and that the assay was suitable for the detection of the analytes in plasma.
3.2.5. Dilution Integrity
To demonstrate dilution integrity, five replicate plasma samples of abiraterone at 1.5*HLOQ level (750 ng/mL) were diluted two- and four-fold with blank plasma. The accuracy after two- and four-fold dilution were 98.1% and 97.6% respectively. The precision after two- and four-fold dilution were 4.9% and 3.4% respectively.
3.2.6. Matrix factor
The matrix factor (MF) was determined in six plasma batches at QC low and QC high concentration levels. The matrix factor in plasma ranged from 1.0 to 1.1. The maximum coefficients of variation (CV) of the IS-normalized MF calculated from the six plasma batches for the low and the high concentration were respectively 2.4% and 1.4% and fulfilled the acceptance criteria of < 15%(EMA, 2009).
3.2.7. Recovery
The total recovery, covering sample preparation, stability and matrix effect, was determined at three concentration levels (5, 300, 400 ng/mL) in duplo, for abiraterone and for the internal standard D4-abiraterone. In plasma the mean total recovery of abiraterone was 76% with a CV of 1% and for the internal standard the mean recovery was 72% with CV% of 1%. A summary of the assay performance data is given in Table 2.
Table 2:
Assay performance data of abiraterone in human plasma at validated quality control concentration levels
| Nominal conc. (ng/mL) |
Within-run precision (%CV) |
Within-run accuracy (% dev.) |
Mean between run precision (%CV) |
Between- run Accuracy (% dev.) |
|---|---|---|---|---|
| 1 | 4.1 | 96.7 | 2.9 | 100.5 |
| 5 | 13.4 | 103.2 | <13.4 | 101.2 |
| 300 | 2.2 | 95.2 | 2.0 | 97.6 |
| 400 | 2.9 | 96.5 | 1.4 | 98.2 |
| 500 | 4.5 | 95.4 | 2.8 | 98.9 |
3.2.8. Stability
Abiraterone and D4-abiraterone were for at least stable for 6 months in stock solution. The autosampler stability (2–8° C) for abiraterone was demonstrated to deviate no more than ±2.2% after 192 hours, and was therefore considered stable for at least 8 days. Freeze/thaw stability experiments resulted in no degradation of abiraterone over three freeze/thaw cycles. Long term stability tested in QC samples was at least 6 months at −40 °C. months at −40° C. The stability results are shown in Table 3.
Table 3:
Stability data of abiraterone
| Nominal conc. (ng/mL) |
Determined mean (ng/mL) (n=3) |
Mean accuracy % (n=3) |
|---|---|---|
| Stock solution 1 mg/mL (− 40°C, 7 months) | 1.03 | 103 |
| Quality control stability (− 40°C, 6 months) | ||
| 5.00 | 4.7 |
93.2 |
| 300 | 308.3 | 103.0 |
| 400 | 410.0 | 102.7 |
| Plasma 3 freeze-thaw (F/T) cycles | ||
| 5.00 | 5.0 | 100.4 |
|
300 |
299.1 | 99.7 |
| 400 | 395.9 | 98.9 |
| Plasma, (2-8°C), 8 days | ||
| 5.00 | 5.4 | 107.0 |
| 300 | 298.4 | 99.5 |
| 400 | 388.0 | 97.0 |
| Plasma, ambient temp, 8 days | ||
| 5.00 | 5.2 | 103.5 |
| 300 | 298.5 | 99.5 |
| 400 | 396.2 | 99.1 |
| Extract, autosampler (2-8°C), 8 days | ||
| 5.00 | 5.1 |
102.5 |
| 300 | 299.0 | 99.7 |
| 400 | 405.8 | 101.5 |
| Patient samples short term stability (2-8ºC) (% of baseline measurement) | ||
|
Plasma 24hr Whole blood 24hr |
95.5 99.0 |
|
| Patient samples short term stability (ambient temperature) (% of baseline measurement) | ||
|
Whole blood 2hr Whole blood 4 hr Plasma 2hr Plasma 3hr Plasma 4hr |
83.0 76.0 86.0 81.5 75.0 |
|
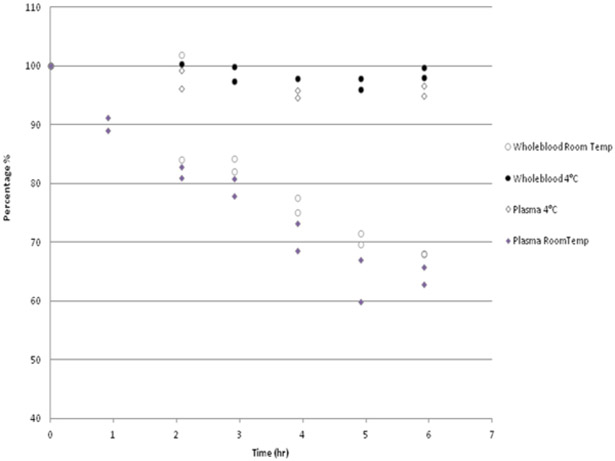
In the experimental study for short term stability, it was observed that abiraterone, when kept at 2–8°C, was stable for 24h in EDTA plasma and for 8h in EDTA whole blood. Surprisingly, purchased EDTA whole blood and plasma spiked with abiraterone and stored at 2–8°C and at ambient temperature was stable for at least 8 days in both conditions.
However, in fresh patient EDTA plasma, only 87% abiraterone was recovered after 2 hours at ambient temperature and further decreasing to 31 % after 24 h. EDTA whole blood kept at ambient temperature also showed equal decrease below 85% of the initial concentration within three hours and further decreasing to 36% after 24 h (Table 3 and Figure 4). In conclusion, at ambient temperature abiraterone concentration rapidly decreased in fresh EDTA whole blood as well as in fresh EDTA plasma, and therefore samples should be treated on ice immediately after collection.
FIGURE 4.
Short‐term stability experiment in treated patients on 1000 mg once daily abiraterone acetate.
3.2.9. External validation
For the external validation duplicate sets of blinded QCs at the three concentration levels were exchanged with the University of Pittsburgh Department of Pharmaceutical Sciences where an abiraterone assay is in use. The results were within 7.5% of nominal abiraterone concentrations of 5, 300 and 400 ng/mL. Vice versa Pittsburgh exchanged one blinded set of QCs with our laboratory at three concentration levels which we analyzed. One QC was outside the range of detection. The other two QCs deviated 17.1% and 3.5% from the nominal concentrations of 2 and 50 ng/mL.
4. Clinical applicability
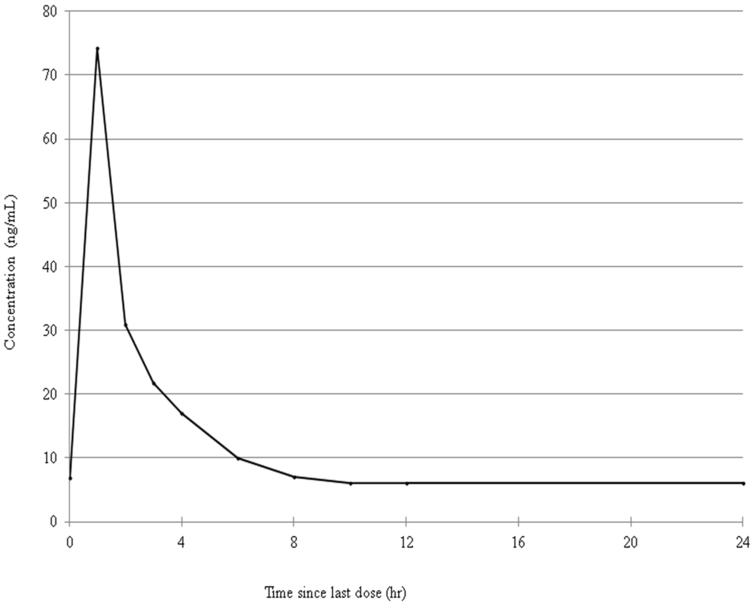
This assay was developed to support clinical studies as well as individual patient care in the real world clinical setting. To test the applicability of this assay, abiraterone concentrations were quantified in samples collected in a patient that was treated pre-chemotherapy with 1000 mg abiraterone QD and had reached steady-state pharmacokinetics. The results are shown in Figure 5.
FIGURE 5.
Pharmacokinetic curve of a patient treated with abiraterone 1000 mg once daily, in steady state.
5. Discussion
We have developed a new method to quantify abiraterone in human plasma, using more convenient protein precipitation as sample preparation, and applying a deuterated isotope as the internal standard.
Several bioanalytical methods in human plasma were published using different methods(Alyamani et al., 2016; Gurav et al., 2012; Martins et al., 2006). The earlier described HPLC method uses both protein precipitation and solid phase extraction, which is not common practice in most laboratories(Belleville et al., 2015). The most recent published assay of Alyamani et a.l use liquid-liquid extraction as sample preparation method with D4-abiraterone as an internal standard(Alyamani et al., 2016). Liquid-liquid extraction is more laborious than the protein precipitation used in our assay. Gurav et al. use protein precipitation as sample preparation(Gurav et al., 2012). The method of Martins et al. uses solid phase extraction without incorporating an internal standard which demands very reproducible recovery of abiraterone on solid phase extraction which might be challenging due to stability issues of abiraterone(Martins et al., 2006). Gurav et al. use phenacetin as internal standard which may behave very differently during sample preparation. Moreover, the authors describe a runtime of 3.5 minute on HPLC which is unlikely sufficient to separate abiraterone from its phase I metabolites encountered in humans treated with this drug(Gurav et al., 2012). In the bioanalytical assay that we developed we used D4-abiraterone as an internal standard. Protein precipitation only was used as sample preparation which make the assay rugged. Moreover, the methods published thus far do not describe the stability and adsorption issues which makes implementation of the described methods on other locations challenging. Finally, our assay was tested and separates the phase I and II metabolites well from abiraterone in patients treated with this drug and proved to perform well in a real-world clinical setting The metabolites that were seen on the same mass transition as the parent drug are assumed to be either n-oxide, n-glucuronide, n-sulphate, o-sulphate, n-oxide-o-glucuronide or n-oxide-o-sulphate. These metabolites may decompose to the parent compound abiraterone by collisional or thermal in-source fragmentation processes, and can therefore be detected in the mass transition m/z 350>156. Our aim was to identify and quantify abiraterone which requires separation of abiraterone from its potential metabolites. We therefore did not purchase metabolites references that might have enabled us to identify which metabolites were observed in our method.
While developing this method, several hurdles were encountered: Adsorption to glass vials, stability issues in patient samples, adequate chromatographic separation of abiraterone from its multiple phase I metabolites, and carry-over issues that were not described in previous published methods. Stability issues of abiraterone in citrate plasma were described in the market authorization information, indicating that the quantification of abiraterone might be challenging(FDA, 2010). These stability issues were not reported by the previous authors describing bioanalytical method validation for abiraterone. This could be explained by the fact that short term patient sample stability is not tested at every laboratory and therefore stability issues were not noticed(Alyamani et al., 2016; Belleville et al., 2015; Gurav et al., 2012; Martins et al., 2006). In this paper, we extensively describe the stability issues in freshly collected whole blood and plasma which could be relevant to the design of logistics in routine patient care and studies. The underlying mechanism of degradation of abiraterone in fresh plasma versus no degradation in purchased plasma is not yet understood but is potentially caused by esterases which are active in fresh matrices and might be inactivated in purchased plasma. The used purchased plasma was stored for 2–4 days at the manufacturer before shipment to our laboratory took place. During sample collection, the blood should be kept on ice and should be directly processed and frozen to avoid degradation of abiraterone. Samples should be collected and handled in polypropylene material throughout the analysis to avoid adsorption of abiraterone to glass. This information is highly relevant for the design of clinical studies as well as for sample handling in the daily clinical practice.
6. Conclusion
After several challenges were adequately addressed, the bioanalytical method was successfully validated and applied to determine plasma concentrations of abiraterone in clinical studies and in regular patient care in patients with metastatic castration resistant prostate cancer. The applicability of this method was demonstrated by quantitative analysis of samples from prostate cancer patients treated with abiraterone acetate.
Acknowledgement:
Funding: Janssen Cilag BV educational grant.
References
- Acharya M Gonzalez M Mannens G De Vries R Lopez C Griffin T Tran N (2013). A phase I, open-label, single-dose, mass balance study of 14C-labeled abiraterone acetate in healthy male subjects. Xenobiotica, 43(4), 379–389. [DOI] [PubMed] [Google Scholar]
- Alyamani M Li Z Upadhyay SK Anderson DJ Auchus RJ Sharifi N (2016). Development and validation of a novel LC-MS/MS method for simultaneous determination of abiraterone and its seven steroidal metabolites in human serum: Innovation in separation of diastereoisomers without use of a chiral column. J Steroid Biochem Mol Biol [DOI] [PMC free article] [PubMed] [Google Scholar]
- Belleville T Noe G Huillard O Thomas-Schoemann A Vidal M Goldwasser F Alexandre J Blanchet B (2015). A HPLC-fluorescence method for the quantification of abiraterone in plasma from patients with metastatic castration-resistant prostate cancer. J Chromatogr B Analyt Technol Biomed Life Sci, 989, 86–90. [DOI] [PubMed] [Google Scholar]
- Chi KN Spratlin J Kollmannsberger C North S Pankras C Gonzalez M Bernard A Stieltjes H Peng L Jiao J Acharya M Kheoh T Griffin TW Yu MK Chien C Tran NP (2015). Food effects on abiraterone pharmacokinetics in healthy subjects and patients with metastatic castration-resistant prostate cancer. J Clin Pharmacol [DOI] [PubMed] [Google Scholar]
- de Bono JS Logothetis CJ Molina A Fizazi K North S Chu L Chi KN Jones RJ Goodman OB Jr. Saad F Staffurth JN Mainwaring P Harland S Flaig TW Hutson TE Cheng T Patterson H Hainsworth JD Ryan CJ Sternberg CN Ellard SL Flechon A Saleh M Scholz M Efstathiou E Zivi A Bianchini D Loriot Y Chieffo N Kheoh T Haqq CM Scher HI Investigators C.-A.−. (2011). Abiraterone and increased survival in metastatic prostate cancer. N Engl J Med, 364(21), 1995–2005. [DOI] [PMC free article] [PubMed] [Google Scholar]
- EMA. (2009). Guideline on bioanalytical method validation. Retrieved December, 2014, from http://www.ema.europa.eu/docs/en_GB/document_library/Scientific_guideline/2011/08/WC500109686.pdf
- EMA. (2016, 29/January/2016). European Public Assessment Report (EPAR) Zytiga (abiraterone acetate). Retrieved 22th february, 2016, from http://www.ema.europa.eu/docs/en_GB/document_library/EPAR_-_Product_Information/human/002321/WC500112858.pdf
- FDA. (2010). US Food and Drug Administration. Clinical pharmacology and biopharmaceutics review Zytiga (Abiraterone Acetate). 1–86. [Google Scholar]
- Gurav S Punde R Farooqui J Zainuddin M Rajagopal S Mullangi R (2012). Development and validation of a highly sensitive method for the determination of abiraterone in rat and human plasma by LC-MS/MS-ESI: application to a pharmacokinetic study. Biomed Chromatogr, 26(6), 761–768. [DOI] [PubMed] [Google Scholar]
- Martins V Asad Y Wilsher N Raynaud F (2006). A validated liquid chromatographic-tandem mass spectroscopy method for the quantification of abiraterone acetate and abiraterone in human plasma. J Chromatogr B Analyt Technol Biomed Life Sci, 843(2), 262–267. [DOI] [PubMed] [Google Scholar]
- O’Donnell A Judson I Dowsett M Raynaud F Dearnaley D Mason M Harland S Robbins A Halbert G Nutley B Jarman M (2004). Hormonal impact of the 17alpha-hydroxylase/C(17,20)-lyase inhibitor abiraterone acetate (CB7630) in patients with prostate cancer. Br J Cancer, 90(12), 2317–2325. [DOI] [PMC free article] [PubMed] [Google Scholar]
- Ryan CJ Smith MR de Bono JS Molina A Logothetis CJ de Souza P Fizazi K Mainwaring P Piulats JM Ng S Carles J Mulders PF Basch E Small EJ Saad F Schrijvers D Van Poppel H Mukherjee SD Suttmann H Gerritsen WR Flaig TW George DJ Yu EY Efstathiou E Pantuck A Winquist E Higano CS Taplin ME Park Y Kheoh T Griffin T Scher HI Rathkopf DE Investigators C.-A.−. (2013). Abiraterone in metastatic prostate cancer without previous chemotherapy. N Engl J Med, 368(2), 138–148. [DOI] [PMC free article] [PubMed] [Google Scholar]
- Ryan CJ Smith MR Fong L Rosenberg JE Kantoff P Raynaud F Martins V Lee G Kheoh T Kim J Molina A Small EJ (2010). Phase I clinical trial of the CYP17 inhibitor abiraterone acetate demonstrating clinical activity in patients with castration-resistant prostate cancer who received prior ketoconazole therapy. J Clin Oncol, 28(9), 1481–1488. [DOI] [PMC free article] [PubMed] [Google Scholar]
- Xu XS Ryan CJ Stuyckens K Smith MR Saad F Griffin TW Park YC Yu MK De Porre P Vermeulen A Poggesi I Nandy P (2016). Modeling the Relationship Between Exposure to Abiraterone and Prostate-Specific Antigen Dynamics in Patients with Metastatic Castration-Resistant Prostate Cancer. Clin Pharmacokinet [DOI] [PubMed] [Google Scholar]


