

SUMMARY
EGFR activates phosphatidylinositide 3-kinase (PI3K), but the mechanism underlying this activation is not completely understood. We demonstrated here that EGFR activation resulted in lysine acetyltransferase 5 (KAT5)-mediated K395 acetylation of the platelet isoform of phosphofructokinase 1 (PFKP) and subsequent translocation of PFKP to the plasma membrane, where the PFKP was phosphorylated at Y64 by EGFR. Phosphorylated PFKP binds to the N-terminal SH2 domain of p85α, which is distinct from binding of Gab1 to the C-terminal SH2 domain of p85α, and recruited p85α to the plasma membrane resulting in PI3K activation. PI3K-dependent AKT activation results in enhanced phosphofructokinase 2 (PFK2) phosphorylation and production of fructose-2,6-bisphosphate, which in turn promotes PFK1 activation. PFKP Y64 phosphorylation–enhanced PI3K/AKT-dependent PFK1 activation and GLUT1 expression promoted the Warburg effect, tumor cell proliferation, and brain tumorigenesis. These findings underscore the instrumental role of PFKP in PI3K activation and enhanced glycolysis through PI3K/AKT-dependent positive-feedback regulation.
Keywords: EGFR, PFKP, PI3K, phosphorylation, the Warburg effect
In Brief
Lee et al. demonstrate that KAT5-mediated PFKP acetylation and subsequent EGFR-phosphorylated PFKP binds to the N-terminal SH2 domain of p85α to activate PI3K, leading to enhanced AKT-dependent PFK2 activation, F-2,6-BP production–dependent PFK1 activation, and GLUT1 expression. Non-metabolic function of PFKP promotes the Warburg effect through PI3K/AKT-dependent positive-feedback regulation.
INTRODUCTION
Most cancer cells demonstrate altered metabolism and exhibit elevated glucose uptake and lactate production regardless of oxygen levels, which is termed the Warburg effect (Vander Heiden et al., 2009; Warburg, 1956). This alteration is required to meet the high energy and biosynthetic demands of tumor cells and to facilitate their growth (Cairns et al., 2011; Hsu and Sabatini, 2008). In the glycolytic pathway, phosphofructokinase 1 (PFK1) catalyzes the conversion of fructose 6-phosphate and ATP to fructose-1,6-bisphosphate and ADP, which is one of the key regulatory and rate-limiting steps of glycolysis (Mor et al., 2011). PFK1 exists in multiple tetrameric isozymic forms consisting of three types of subunits: muscle (PFKM), liver (PFKL), and platelet (PFKP), and the composition of the PFK1 tetramer varies depending on the tissue and cell type (Mor et al., 2011; Moreno-Sanchez et al., 2007). PFKL is most abundant in liver and kidney, whereas PFKM and PFKP are the only forms present in adult muscle and platelets, respectively. In contrast, all three isoforms are present in brain and other tissues (Dunaway and Kasten, 1987; Dunaway et al., 1988; Kahn et al., 1979). PFK1 is allosterically inhibited by phosphoenolpyruvate, citrate, and ATP and activated by a high concentration of AMP, ADP, and fructose-2,6-bisphosphate (F-2,6-BP), among which F-2,6-BP is the most potent activator of PFK1 (Stine and Dang, 2013). Of note, PFKP is the prominent PFK1 isoform in breast carcinoma, ascites tumor, and B- and T-cell leukemias, in which total PFK1 expression or activity is upregulated (Moon et al., 2011; Sanchez-Martinez and Aragon, 1997; Vora et al., 1985a; Wang et al., 2013). In addition, AKT-mediated phosphorylation of PFKP inhibits the binding of the TRIM21 E3 ligase to PFKP and subsequent TRIM21-mediated polyubiquitylation and degradation of PFKP, which results in increased PFKP expression and promotion of aerobic glycolysis (Lee et al., 2017). Glycolytic enzymes, such as PKM2 and PGK1, possess non-metabolic functions (Li et al., 2016; Qian et al., 2017a; Yang et al., 2012a; Yang et al., 2011; Yang et al., 2012b). However, whether PFKP has any critical non-canonical functions in tumor development remains unknown.
Phosphofructokinase 2 (PFK2) (also called fructose bisphosphatase 2), an enzyme that has both a kinase and phosphatase domain, produces F-2,6-BP by phosphorylation of fructose 6-phosphate (Stine and Dang, 2013). Amino acids stimulate F-2,6-BP synthesis by AKT-dependent PFK2 S483 phosphorylation and activation of PFK2 (Novellasdemunt et al., 2013). AKT is a downstream effector of phosphatidylinositide 3-kinase (PI3K), which is classified according to sequence homology and substrate preferences into three different types: class I, class II, and class III (Bader et al., 2005; Engelman et al., 2006). Class I PI3Ks are heterodimeric enzymes composed of a p85 regulatory subunit (p85α, p85β, p55α, p55γ, and p50α) and a p110 catalytic subunit (p110α, p110β, and p110δ), which phosphorylates phosphatidylinositol-4,5-bisphosphate (PI-4,5-P2) to produce phosphatidylinositol-3,4,5-trisphosphate (PI-3,4,5-P3 or PIP3). p85α is the most abundantly expressed regulatory isoform of PI3K, and it is constitutively associated with one of the three catalytic subunits in the cytoplasm in an inactive PI3K complex (Salamon and Backer, 2013). The p85α regulatory subunit contains N-terminal and C-terminal SH2 domains that bind with high affinity to phosphotyrosines within YxxM sequences found in a variety of proteins. The SH2-dependent binding to p-YxxM motifs within docking proteins relieves the inhibitory activity of p85α on p110, resulting in increased catalytic activity of the associated p110 (Engelman et al., 2006; Fruman, 2010). Thus, binding of p85α to p-YxxM motifs is critical for triggering downstream signaling. Activation of the epidermal growth factor receptor (EGFR), which occurs in many types of human cancer, including more than 50% of glioblastoma (GBM) tumors (Yang et al., 2011), results in binding of Tyr-phosphorylated Grb2-associated binder-1 (Gab1) to p85 and subsequent PI3K activation (Holgado-Madruga et al., 1996). However, whether other proteins are also involved in EGFR-mediated regulation of p85 in a Tyr-phosphorylation–dependent manner is not known.
In this study, we demonstrated that activated EGFR induced KAT5-mediated PFKP K395 acetylation and subsequent PFKP plasma translocation and phosphorylation at Y64 by EGFR. Phosphorylated PFKP Y64 bound to the N-terminal SH2 domain of p85α and promoted activation of PI3K and AKT, leading to enhanced AKT-dependent PFK2 activation, F-2,6-BP production–dependent PFK1 activation, and glucose transporter type 1 (GLUT1) expression. The feedback regulation of glycolytic enzymes by PFKP Y64 phosphorylation promoted the Warburg effect, cell proliferation, and tumorigenesis.
RESULTS
KAT5-Mediated PFKP K395 Acetylation Promotes the Binding of PFKP to EGFR
EGFR activation promotes the Warburg effect and regulates glycolytic enzymes in a subcellular compartment–dependent manner (Yang et al., 2012a; Yang et al., 2012b). To determine whether EGFR activation regulates the function of PFKP, we stimulated U251 (Figure 1A) and U87/EGFR glioblastoma cells (data not shown) with EGF. Immunofluorescence analyses with anti-PFKP antibody showed that EGF treatment induced translocation of a small fraction of PFKP to the plasma membrane and co-localization of PFKP with EGFR. The plasma membrane translocation of PFKP induced by EGF was further confirmed by fractionation analyses of U251 and U87/EGFR cells (Figure 1B). Coimmunoprecipitation analysis showed that endogenous PFKP bound to endogenous EGFR, which was enhanced by EGF stimulation (Figure 1C).
Figure 1. KAT5-Mediated PFKP K395 Acetylation Promotes Binding of PFKP to EGFR.

Immunoblotting analyses were performed with the indicated antibodies (B–J).
(A) Serum-starved U251 cells were stimulated with or without EGF (100 ng/ml) for 15 min and immunostained with an anti-PFKP and an anti-EGFR antibodies (left panel). Scale bar, 5 μm. Quantification of immunofluorescence intensity of PFKP in the cytosol and plasma membrane was performed. Two-sided t-tests statistical analysis for 50 individual cells (n=50) were conducted. *p < 0.01 (right panel).
(B) Serum-starved U251 cells were treated with or without EGF (100 ng/ml) for the indicated time periods and were harvested for the isolation of membrane and cytosolic fractions.
(C) Serum-starved U251 cells were stimulated with or without EGF (100 ng/ml) for 15 min. Immunoprecipitation analysis with an anti-EGFR antibody was performed.
(D) U251 cells were treated with or without EGF (100 ng/ml) for 5 min. Endogenous PFKP was immunoprecipitated.
(E) U251 cells with or without PFKP depletion and reconstituted expression of WT Flag-rPFKP or Flag-rPFKP K395R mutant (left panel) were treated with or without EGF (100 ng/ml) for 15 min. Immunoprecipitation analysis was performed (right panel).
(F) WT SFB-PFKP or SFB-PFKP K395R-expressing U251 cells with or without KAT5 depletion and reconstituted expression of Flag-rKAT5 were cultured in the presence or absence of EGF (100 ng/ml) for 15 min. A streptavidin pull-down assay was performed.
(G) Purified His-PFKP proteins immobilized on Ni-NTA agarose beads were incubated with or without Flag-KAT5 and Ac-CoA, followed by incubation with purified GST or GST-EGFR. A His beads pull-down assay was performed.
(H) U251 cells with or without KAT5 depletion and reconstituted expression of Flag-rKAT5 were cultured in the presence or absence of EGF (100 ng/ml) for 15 min. Immunoprecipitation analysis was performed.
(I, J) PFKP-depleted U251 cells with reconstituted expression of WT Flag-rPFKP or Flag-rPFKP K395R mutant were treated with or without EGF (100 ng/ml) for 5 min. Cell fractionation (I) and immunoprecipitation analysis of total cell lysates (J) were performed.
See also supplementary Table S1.
To understand the mechanism underlying the plasma translocation of PFKP and its interaction with EGFR, we immunoprecipitated PFKP and performed liquid chromatography-tandem mass spectrometry/mass spectrometry (LC-MS/MS) analyses, which revealed that K (lysine) acetyltransferase 5 (KAT5) as well as EGFR were PFKP-interacting proteins (Supplementary Table S1). In addition, EGF stimulation enhanced the association of endogenous PFKP with endogenous KAT5 (Figure 1D). A glutathione S-transferase (GST) pull-down assay using purified GST-KAT5 and purified recombinant His-PFKP showed that KAT5 bound to PFKP directly (Figure S1A). LC-MS/MS analyses of His-PFKP after GST-KAT5-mediated in vitro acetylation assay showed that PFKP was acetylated at K395 (Figure S1B). The PFKP K395R mutation that prevents lysine acetylation largely reduced KAT5-mediated in vitro (Figure S1C) and EGF-induced PFKP acetylation in U251 cells (Figure 1E), as detected by an anti-acetylated lysine antibody. In line with these findings, KAT5 depletion largely reduced EGF-induced PFKP acetylation, which was rescued by expression of RNAi-resistant (r) Flag-KAT5 with wild-type (WT) SFB-PFKP but not SFB-PFKP K395R mutant (Figure 1F). c-Abl, which is activated by EGFR signaling, phosphorylates KAT5 to enhance KAT5 activity (Kaidi and Jackson, 2013; Plattner et al., 1999). We found that EGFR activation increased KAT5 tyrosine phosphorylation and PFKP acetylation, with this increase being largely blocked by pretreating U251 cells with the c-Abl inhibitor nilotinib (Figure S1D). These results strongly suggest that EGFR activation results in c-Abl-mediated phosphorylation of KAT5, which acetylates PFKP at K395.
To determine the effect of PFKP K395 acetylation on its interaction with EGFR, we performed an in vitro pull-down assay showing that purified GST-EGFR enhanced its binding to WT His-PFKP, but not to His-PFKP K395R, only in the presence of purified KAT5 (Figure 1G). In addition, KAT5 depletion largely reduced EGF-induced interaction between EGFR and PFKP, which was rescued by expression of rKAT5 (Figure 1H). Consistent with these findings, PFKP K395R in contrast to its WT counterpart in endogenous PFKP-depleted U251 (Figure 1I) and U87/EGFR cells (Figure S1E) failed to translocate to plasma membrane and interact with EGFR in response to EGF stimulation (Figure 1J). These results indicate that KAT5-mediated PFKP K395 acetylation promotes the binding of PFKP to EGFR.
EGFR Phosphorylates PFKP at Y64
We found that PFKP binds to EGFR. EGF treatment increased tyrosine phosphorylation of PFKP in U251 cells (Figure 2A), and this phosphorylation was abrogated by pretreatment with the EGFR inhibitor AG1478 prior to EGF stimulation (Figure 2B), indicating that EGFR activation results in phosphorylation of PFKP. To examine whether PFKP is a direct substrate of EGFR, we performed an in vitro kinase assay with [γ-32P]ATP and showed that purified GST-EGFR phosphorylated purified His-tagged PFKP (Figure 2C) at Y64, as identified by LC-MS/MS analyses (Figure 2D). Mutation of Y64 to phenylalanine (F) largely reduced EGFR-mediated PFKP phosphorylation in vitro, as detected by an anti-phospho-PFKP Y64 antibody (Figure 2E, Figure S2A). The specificity of the PFKP pY64 antibody was validated by using a specific phosphorylation-blocking peptide, which blocked the detection of PFKP Y64 phosphorylation (Figure S2B). Immunoblotting analyses showed that EGFR activation by EGF stimulation or expression of constitutively activated EGFRvIII mutant, which lacks 267 amino acids from its extracellular domain and is found frequently in GBM, greatly induced PFKP membrane translocation and Y64 phosphorylation in U87 cells (Figure S2C). In addition, EGF stimulation of U251 cells resulted in enhanced phosphorylation of Flag-tagged WT PFKP but not of the PFKP Y64F mutant (Figure 2F, left and middle panel) and induced a stronger phosphorylation of endogenous PFKP than that observed in normal human astrocytes (Figure S2D). In line with the finding that PFKP K395 acetylation promotes the binding of PFKP to EGFR, reconstituted expression of PFKP K395R largely reduced EGF-induced PFKP Y64 phosphorylation (Figure 2F, right panel). Of note, EGF treatment induced translocation of a similar amount of PFKP Y64F and WT PFKP to the membrane (Figure 2F, middle panel), suggesting that KAT5-dependent PFKP acetylation results in the translocation of PFKP to the plasma membrane, where EGFR phosphorylates PFKP.
Figure 2. EGFR Phosphorylates PFKP at Y64.

Immunoblotting analyses were performed with the indicated antibodies (A–C, E–G).
(A) Serum-starved U251 cells were treated with or without EGF (100 ng/ml) for the indicated periods of time. Endogenous PFKP was immunoprecipitated.
(B) Serum-starved U251 cells were treated with or without AG1478 (1 μM) for 60 min before stimulation with or without EGF (100 ng/ml) for 15 min. Endogenous PFKP was immunoprecipitated.
(C, D) In vitro kinase assays were performed with purified bacterially expressed His-PFKP with or without GST-EGFR in the presence of Flag-KAT5 and Ac-CoA (C). Mass spectrometry analyses of a tryptic fragment of PFKP at a mass-to-charge ratio (m/z) of 747.28 (mass error, −0.05 ppm) matched the +2 charged peptide 63-YQGMVDGGSNIA-76, suggesting that Y64 was phosphorylated. The Mascot score was 204.18 (D).
(E) In vitro kinase assays were performed with purified bacterially expressed WT His-PFKP or His-PFKP Y64F mutant with or without GST-EGFR in the presence of Flag-KAT5 and Ac-CoA.
(F) U251 cells with or without PFKP depletion and reconstituted expression of WT Flag-rPFKP, Flag-rPFKP Y64F (left panel and middle panel), or Flag-rPFKP K395R (right panel) were treated with or without EGF (100 ng/ml) for 15 min. Cell fractionation and immunoprecipitation analyses were performed.
(G) Parental and the U251 cells with knock-in of PFKP K395R were treated with or without EGF (100 ng/ml) for the indicated time periods. MG132 (10 μM) was added to the cells 6 h before harvesting to eliminate the potential effect of proteasomal degradation of PFKP. Endogenous PFKP was immunoprecipitated.
See also supplementary Table S2.
We next used CRISPR/Cas9 genome editing knock-in technology to replace endogenous PFKP with PFKP K395R or PFKP Y64F in U251 and U87/EGFRvIII cells (Supplementary Table S2, Figure S2E and S2F). EGFR activation substantially increased the acetylation of endogenous WT PFKP but not of PFKP K395R (Figure 2G), and PFKP K395R and PFKP Y64F were resistant to phosphorylation induced by EGF stimulation (Figure 2G) and EGFRvIII expression (Figure S2G). These results indicate that EGFR phosphorylates PFKP at Y64 in a PFKP K395 acetylation-dependent manner.
PFKP Binds to N-Terminal SH2 Domain and Gab1 Binds to C-Terminal SH2 Domain of p85α
EGFR activation results in tyrosine phosphorylation-dependent binding of Gab1 to p85 SH2 domains and subsequent PI3K activation (Holgado-Madruga et al., 1996). Intriguingly, phosphorylated 64-YQGM-67 of PFKP is a potential binding site for SH2 domains of p85α, which binds to the phosphorylated Y-X-X-M motif (Songyang et al., 1993). Coimmunoprecipitation analysis showed that EGF treatment or EGFRvIII expression enhanced the binding of p85α to PFKP (Figures 3A and S3A). In addition, the interaction between p85α and PFKP was inhibited by pretreatment with the EGFR inhibitor AG1478 (Figure 3A) or abrogated by treatment of the PFKP immunoprecipitate with calf intestinal alkaline phosphatase (CIP), which dephosphorylated Tyr-phosphorylated PFKP (Figure 3B). These results indicate that EGFR activation results in the binding of p85α to PFKP in a manner dependent on PFKP Tyr-phosphorylation. To test the potential role of PFKP Y64 phosphorylation in the interaction between PFKP and p85α, we mixed purified WT His-PFKP or His-PFKP Y64F with GST-p85α in the presence or absence of GST-EGFR. A His pull-down assay showed that WT His-PFKP, but not His-PFKP Y64F, bound to GST-p85α only in the presence of EGFR (Figure 3C). This in vitro result was further validated by a coimmunoprecipitation assay showing that rPFKP Y64F, which was expressed in endogenous PFKP-depleted U251 cells, lost its binding to p85α compared with its WT counterpart in the presence of EGF (Figure 3D). In addition, expression of PFKP mutants with mutation of the Y64-adjacent Y58 or other Tyr residues did not affect EGF-induced binding of p85α to PFKP (Figure S3B). Notably, PFKP K395R, which was expressed in endogenous PFKP-depleted U251 cells and was resistant to phosphorylation by EGFR (Figure 2G), was unable to bind to p85α upon EGFR activation (Figure S3C). These results indicate that EGFR-phosphorylated PFKP Y64 is required for the interaction between PFKP and p85α. Of note, PFKP Y64F, which was still able to interact with its WT counterpart (Figure S3D), failed to bind to p85α in the presence of endogenous expression of WT PFKP (Figure S3E), suggesting that PFKP binds to p85α as a monomer.
Figure 3. PFKP Binds to N-Terminal SH2 Domain and Gab1 Binds to C-Terminal SH2 Domain of p85α.

Immunoblotting analyses were performed with the indicated antibodies (A–G).
(A) Serum-starved U251 cells were treated with or without EGFR inhibitor AG1478 (1 μM) for 60 min before stimulation with or without EGF (100 ng/ml) for 15 min. Immunoprecipitation analysis was performed.
(B) PFKP was immunoprecipitated from serum-starved U251 cells with or without 15 min of EGF (100 ng/ml) treatment and incubated with or without CIP (10 units) at 37°C for 30 min followed by PBS washing five times.
(C) In vitro kinase assays were performed by mixing purified bacterially expressed His-tagged WT PFKP or PFKP Y64F mutant with or without active GST-EGFR in the presence of Flag-KAT5 and Ac-CoA, which was followed by incubation with purified GST-p85α for a His beads pull-down assay.
(D) PFKP shRNA was expressed in U251 cells, which was followed by reconstituted expression of WT Flag-rPFKP or Flag-rPFKP Y64F mutant. The indicated cells were treated with or without EGF (100 ng/ml) for 15 min. Immunoprecipitation analysis was performed.
(E) The indicated Flag-tagged PFK1 isoforms were expressed in PFKP-depleted U251 cells, which were treated with or without EGF (100 ng/ml) for 15 min. Immunoprecipitation analysis was performed.
(F) Schematic structure of the p85α with the indicated mutations (top panel). U251 cells expressing the indicated Flag-tagged p85α proteins were treated with or without EGF (100 ng/ml) for 15 min. Immunoprecipitation analysis was performed (bottom panel).
(G) Serum-starved U251 cells were treated with or without EGF (100 ng/ml) for the indicated periods of time. Endogenous PFKP was immunoprecipitated.
The 64-YQGM-67 sequence of PFKP is conserved in many mammalian species (Figure S3F), but comparison of amino acid sequences of human PFKP, PFKL, and PFKM isoforms revealed that only PFKP contains the Y-X-X-M motif, although Y64 is reserved among the three isoforms (Figure S3G). In line with this finding, neither PFKL nor PFKM associated with p85α (Figure 3E), suggesting an unique cellular activity of PFKP by binding to p85α.
p85α contains N-terminal (nSH2) and C-terminal (cSH2) SH2 domains (Figure 3F, top panel) that bind to Tyr-phosphorylated proteins. Mutation of the arginine (R) in the FLVRES motif of the SH2 domain prevents binding of the SH2 domain to phospho-Tyr–containing proteins (Koch et al., 1991; Mayer et al., 1992). Expression of Flag-tagged WT p85α, p85α nSH2 (R358L) mutant, or p85α cSH2 (R649L) mutant in U251 cells showed that nSH2 (R358L), but not cSH2 (R649L), lost its binding to PFKP, but not to Gab1, in response to EGF stimulation (Figure 3F, bottom panel). In contrast, cSH2 (R649L), but not nSH2 (R358L), failed to bind to Gab1, but not to PFKP, upon EGFR activation (Figure 3F, bottom panel). Similar results were also observed in U87/EGFRvIII cells (Figure S3H). These results suggest that PFKP and Gab1 bind to the nSH2 and cSH2 domains of p85α, respectively. This finding was further supported by evidence showing that depletion of Gab1 did not affect EGF-induced p85α binding to PFKP (Figure S3I), and the binding of Gab1 to p85α was not altered by PFKP depletion (Figure S3J).
To examine whether PFKP and Gab1 bind to the same p85α molecule, we performed coimmunoprecipitation analyses, which showed that PFKP did not associate with Gab1 (Figure 3G), suggesting that PFKP and Gab1 bind to different p85α molecules.
Phosphorylation of PFKP at Y64 Enhances EGF-Induced Activation of PI3K and AKT
Binding of p85α to p110 suppresses the catalytic activity of p110 that can be relieved through interaction of the p85α SH2 domains with tyrosine-phosphorylated proteins and recruitment of PI3K to the plasma membrane for production of PIP3 (Engelman et al., 2006; Fruman, 2010). PFKP depletion largely impaired EGF-induced membrane recruitment of p85α and p110, and this impairment was rescued by expression of WT rPFKP, but not by expression of rPFKP Y64F (Figure 4A). In line with this finding, EGF-enhanced PI3K activity (Figure S4A) and plasma membrane lipid PIP3 levels (Figure 4B) were significantly inhibited by PFKP depletion, and this inhibition was rescued by expression of WT rPFKP, but not by expression of rPFKP Y64F. Consistent with this result, knockout of PFKP (Figure S2F) and knock-in of PFKP Y64F significantly reduced EGFRvIII-induced PI3K activity (Figure 4C). Of note, an enhanced effect on inhibition of EGF-induced PI3K activity was observed in U251 cells with depletion of both PFKP and Gab1 in contrast to depletion of PFKP or Gab1 alone (Figure S4B), supporting a concept that both phosphorylated PFKP Y64 and Gab1 bind to different p85α molecules and thus maximize PI3K activity (Figure S4B).
Figure 4. Phosphorylation of PFKP at Y64 Enhances EGF-Induced Activation of PI3K and AKT.

Immunoblotting analyses were performed with the indicated antibodies (A, C–F).
(A, B) Serum-starved U251 cells with or without expressing PFKP shRNA and with or without reconstituted expression of WT Flag-rPFKP or Flag-rPFKP Y64F mutant were treated with or without EGF (100 ng/ml) for 15 min. The membrane and cytosolic fractions of these cells were prepared (A). The intracellular PIP3 levels were determined. Data represent the means ± SD of three independent experiments. *p < 0.01, based on the Student’s t test (B).
(C) PI3K activities of the p85α immunoprecipitates were determined in U87/EGFRvIII cells with or without knockout of PFKP or knock-in of PFKP Y64F mutant. MG132 (10 μM) was added to the cells 6 h before harvesting to eliminate the potential effect of proteasomal degradation of PFKP. Data represent the means ± SD of three independent experiments. *p < 0.001, based on the Student’s t test.
(D) Serum-starved U251 cells with or without expressing PFKP shRNA were treated with EGF (100 ng/ml) for the indicated time periods.
(E) Serum-starved U251 cells with or without expressing PFKP shRNA and with or without reconstituted expression of WT Flag-rPFKP or Flag-rPFKP Y64F mutant were treated with or without EGF (100 ng/ml) for 15 min.
(F) Serum-starved U251 cells with or without expressing PFKP shRNA, Gab1 shRNA, or combined PFKP shRNA and Gab1 shRNA were treated with or without EGF (100 ng/ml) for 15 min.
AKT is activated by binding to PIP3 through its pleckstrin-homology (PH) domain as well as through phosphorylation at threonine 308 (T308) and serine 473 (S473) (Alessi et al., 1997; Manning and Cantley, 2007; Stokoe et al., 1997; Vivanco and Sawyers, 2002). As expected, PFKP depletion markedly inhibited EGF-induced AKT phosphorylation, but not ERK1/2 phosphorylation, in U251 (Figure 4D), U87/EGFRvIII, LN229, MDA-MB231, and DU145 cells (Figure S4C), and this inhibition was alleviated by expression of WT rPFKP, but not by expression of rPFKP Y64F (Figure 4E). Reduced AKT activity was also observed following knockout of PFKP and knock-in of PFKP Y64F in U87/EGFRvIII cells (Figure S4D). In line with the finding that PFKL and PFKM did not bind to p85α (Figure 3E), depletion of PFKL and PFKM did not affect EGF-induced AKT phosphorylation (Figure S4E). In addition, Gab1 depletion largely reduced AKT phosphorylation, and greater inhibition was observed by combination with PFKP depletion (Figure 4F). These results indicate that EGFR activation results in PI3K and AKT activation through combined phosphorylation of PFKP and Gab1 and subsequent recruitment to p85α and release of p85-mediated inhibition of p110.
To determine whether glycolytic activity of PFKP is required for EGF-induced PI3K/AKT activation, we mutated H307, which is in the fructose 6-phosphate binding pocket of PFKP and is potentially important for substrate binding (Kloos et al., 2015; Webb et al., 2015), into alanine. As expected, purified recombinant PFKP H307A had markedly reduced activity compared with its WT counterpart (Figure S4F). However, expression of Flag-rPFKP H307A in endogenous PFKP-depleted cells did not obviously alter EGF-induced PFKP binding to p85α or AKT phosphorylation compared with expression of WT Flag-rPFKP (Figure S4G), suggesting that the glycolytic activity of PFKP is dispensable for EGF-induced PFKP binding to p85α and subsequent PI3K activation.
PFKP Y64 Phosphorylation Enhances PFK1 Activity, GLUT1 Expression, and the Warburg Effect via AKT Activation
AKT phosphorylates PFK2 S483, resulting in enhanced PFK2 activity and synthesis of F-2,6-BP, a potent allosteric activator of PFK1 (Deprez et al., 1997; Mor et al., 2011; Mouton et al., 2010; Novellasdemunt et al., 2013). To examine whether PFK1 exerts its autoregulatory effect through EGF-induced and PFKP-dependent PI3K and AKT activation, we treated GBM cells with EGF and observed that EGFR activation enhanced PFK2 S483 phosphorylation in U251 (Figure 5A) and LN229 cells (Figure S5A, left panel). Notably, PFKP depletion greatly inhibited EGF-induced (Figure 5A and S5A, left panel) or EGFRvIII-induced PFK2 phosphorylation (Figure S5A, right panel) and F-2,6-BP production (Figure 5B); the inhibition mediated by PFKP depletion were abrogated by expression of WT rPFKP, but not by expression of rPFKP Y64F (Figure 5C and 5D). In agreement with these findings, knockout of PFKP or knock-in of PFKP Y64F inhibited EGFRvIII-induced PFK2 phosphorylation (Figure S5B). Of note, the defect in PFK2 S483 phosphorylation (Figure 5C) and F-2,6-BP production (Figure 5D) in U251 cells expressing rPFKP Y64F was restored by expression of an active AKT1 mutant, indicating an essential role of PFKP-regulated PI3K and AKT activation in PFK2 function. As expected, depletion of PFKP, similar to treatment of U87/EGFRvIII cells with 3PO, a selective inhibitor of the PFK2 isoform PFKFB3, inhibited F-2,6-BP production (Figure S5C).
Figure 5. PFKP Y64 Phosphorylation Enhances PFK1 Activity and GLUT1 Expression via AKT Activation.

Immunoblotting analyses were performed with the indicated antibodies (A, C, G, I). Data represent the means ± SD of three independent experiments (B, D–F, H, J–L).
(A) Serum-starved U251 cells with or without expressing PFKP shRNA were treated with or without EGF (100 ng/ml) for the indicated time periods.
(B) Serum-starved U251 cells with or without expressing PFKP shRNA were treated with or without EGF (100 ng/ml) for 2 h. Fructose-2,6-bisphosphate concentration was measured. *p < 0.01, based on the Student’s t test.
(C, D, E) Serum-starved U251 cells with or without expressing PFKP shRNA and with or without reconstituted expression of WT Flag-rPFKP or Flag-rPFKP Y64F in the presence or absence of HA-tagged myr-AKT expression were treated with or without EGF (100 ng/ml) for 15 min (C) or 2 h (D, E). Immunoblotting analyses (C), fructose-2,6-bisphosphate concentration (D), and PFK1 enzymatic activity (E) were checked. *p < 0.01, based on the one-way ANOVA.
(F, G) Serum-starved U251 cells with or without expressing PFKP shRNA were treated with or without EGF (100 ng/ml) for the indicated time periods. Real-time PCR analysis (F) and immunoblotting analyses (G) were performed. *p < 0.01, based on the Student’s t test.
(H, I) Serum-starved U251 cells with or without expressing PFKP shRNA and with or without reconstituted expression of WT Flag-rPFKP or Flag-rPFKP Y64F in the presence or absence of HA-tagged myr-AKT expression were treated with or without EGF (100 ng/ml) for 12 h. Real-time PCR (H) and immunoblotting analyses (I) were performed. *p < 0.01, based on the one-way ANOVA.
(J, K) U87/EGFRvIII cells with or without knockout of PFKP or knock-in of PFKP Y64F mutant were cultured in no-serum DMEM for 24 h. The media were collected for analysis of glucose consumption (J) or lactate production (K). All results were normalized to the final cell number. *p < 0.001, based on the Student’s t test.
(L) U87/EGFRvIII cells with or without expressing PFKP shRNA were labeled with 13C6-glucose (10 mM) for 30 min. The indicated 13C6-labeled metabolite intermediates were measured by LC-MS/MS. All results were normalized to the final cell number. *p < 0.001, based on the Student’s t test.
Consistent with these findings, the total PFK1 activity in U251 cells (Figure 5E) and U87/EGFRvIII cells (Figure S5D) expressing rPFKP Y64F was reduced compared with the cells expressing its WT counterpart, and this reduction was abrogated by expression of an active AKT1 mutant (Figures 5E and S5D). Given that PFKP Y64F had comparable activity to WT PFKP in vitro (Figure S5E), these results strongly suggest that the reduced activity of PFK1 in PFKP Y64F-expressed U251 cells is due to the defect in PFKP Y64 phosphorylation and subsequent PI3K-, AKT-, and PFK2-dependent production of F-2,6-BP.
AKT regulates glucose uptake by enhancing transcription and membrane translocation of GLUT1 (Barthel et al., 1999; Wieman et al., 2007). As expected, PFKP depletion greatly reduced EGF-induced GLUT1 transcription (Figure 5F) and protein expression (Figure 5G) in U251 cells. Compared with reconstituted WT rPFKP expression, rPFKP Y64F reduced EGF-induced transcription (Figure 5H) and protein expression (Figure 5I) of GLUT1, and this reduction was restored by expression of an active AKT1 mutant (Figure 5H and 5I). These results indicate that PFKP-dependent PI3K/AKT activation in response to EGF stimulation regulates not only the activity of PFK1 but also GLUT1 expression.
In line with the results of PFKP-dependent PFK1 activity and GLUT1 expression, PFKP-depletion reduced both basal and EGF-enhanced glucose consumption (Figure S5F) and lactate production (Figure S5G), which was rescued by expression of WT rPFKP, but not by expression of rPFKP Y64F, in U251 cells. Similar results of glucose consumption and lactate production were also observed following knockout of PFKP or knock-in of PFKP Y64F in U87/EGFRvIII cells (Figure 5J and 5K), further supporting the role of PFKP Y64 phosphorylation-mediated PI3K/AKT activation in the regulation of glycolysis. In addition, metabolic flux analysis with 13C6-glucose showed that PFKP depletion in U87/EGFRvIII cells significantly decreased the intracellular amount of 13C-labeled glucose, glucose 6-phosphate, fructose 6-phosphate, fructose-1,6-bisphosphate, pyruvate, and lactate (Figure 5L). These results indicate that EGFR activation results in PFKP Y64 phosphorylation–dependent upregulation of the Warburg effect.
PFKP Y64 Phosphorylation Promotes Tumor Cell Proliferation and Brain Tumorigenesis
PFKP Y64 phosphorylation–promoted PI3K and AKT activation and subsequent cellular activities, including glycolysis upregulation, likely regulate cell growth. As we expected, knockout of PFKP or knock-in of PFKP Y64F potently inhibited EGFR activation–induced proliferation of U87/EGFRvIII cells (Figure 6A). In parallel with these results, PFKP depletion markedly inhibited EGFR activation–induced proliferation of U251 cells (Figure S6). Reconstituted expression of WT rPFKP, but not expression of rPFKP Y64F mutant, restored the cell proliferation (Figure S6). These results indicate that EGFR-dependent PFKP Y64 phosphorylation promotes cell proliferation.
Figure 6. PFKP Y64 Phosphorylation Promotes Tumor Cell Proliferation and Brain Tumorigenesis.

(A) U87/EGFRvIII cells with or without knockout of PFKP or knock-in of PFKP Y64F mutant were cultured in 1% serum medium for the indicated time periods and were harvested for cell counting. Data represent the mean ± SD of three independent experiments. *p < 0.001, based on the Student’s t test.
(B, C) A total of 5 × 10⁵ U87/EGFRvIII cells with or without knockout of PFKP or knock-in of PFKP Y64F mutant were intracranially injected into athymic nude mice. After 2 weeks, the mice were euthanized and examined for tumor growth. Hematoxylin and eosin–stained coronal brain sections show representative tumor xenografts. Scale bar, 2 mm. (B). Tumor volumes were measured by using length (a) and width (b) and calculated by using the equation: V = ab2/2. Data represent the means ± SD of 7 mice. *p < 0.001, based on the Student’s t test (C).
(D) IHC staining of the mouse tumor tissues was performed with the indicated antibodies. Representative images are shown. Scale bar, 100 μm.
(E) A total of 5 × 10⁵ U87/EGFRvIII cells with or without knockout of PFKP or knock-in of PFKP Y64F mutant were intracranially injected into athymic nude mice. Mouse survival times were recorded and visualized using Kaplan-Meier survival curves. Data represent the means ± SD of 9 mice. Tables show median survival time of mice, and the p values were calculated by using the Log-rank test and Gehan-Breslow-Wilcoxon test, respectively.
(F) IHC analyses of the tumor tissues were performed with an anti-Ki-67 antibody. Representative staining (left panel) and quantification of the staining (right panel) are shown. Scale bar, 100 μm. *p < 0.001, based on the Student’s t test.
To determine the role of PFKP Y64 phosphorylation in brain tumorigenesis, we intracranially injected U87/EGFRvIII cells with or without knockout of PFKP or knock-in of PFKP Y64F into athymic nude mice. PFKP deficiency or PFKP Y64F expression significantly reduced the growth of brain tumors (Figure 6B and 6C), decreased phosphorylation of AKT S473 and PFK2 S483 and GLUT1 expression in the tumor tissue (Figure 6D), and prolonged survival time of the mice (Figure 6E). Ki-67 staining analyses revealed rapid cell proliferation in the tumor tissues expressing WT PFKP, in contrast to slow cell proliferation in the tumor tissues with PFKP deficiency or PFKP Y64F expression (Figure 6F). These results indicate that EGFR-dependent PFKP Y64 phosphorylation promotes brain tumor development.
PFKP Y64 Phosphorylation Is Positively Correlated with EGFR Y1068 Phosphorylation and PFK2 S483 Phosphorylation in Human GBM Specimens and with Poor Patient Prognosis
To determine the clinical significance of EGFR-mediated PFKP phosphorylation, we analyzed 57 human primary GBM specimens with specificity-validated anti-PFKP pY64 antibody (Figure S7) and antibodies against EGFR pY1068 and PFK2 pS483. The phosphorylation levels of EGFR pY1068, PFKP pY64, and PFK2 pS483 were positively correlated (Figure 7A). Quantification of staining showed that these correlations were significant (Figure 7B). We next compared survival duration of the 57 patients, all of whom had undergone standard adjuvant radiotherapy after surgical resection of GBM, followed by treatment with an alkylating agent (temozolomide in most cases). The median survival durations were 153.36, 138.57, and 168.14 weeks for patients whose tumors had low levels of EGFR pY1068, PFKP pY64, and PFK2 pS483, respectively, and 37.57, 40.71, and 42.71 weeks for those whose tumors had high levels of EGFR pY1068, PFKP pY64, and PFK2 pS483, respectively (Figure 7C). These results indicate that EGFR-phosphorylated PFKP plays an important role in the clinical behavior of human GBM and reveal a significant correlation between phosphorylation of PFKP Y64 and PFK2 S483 and the clinical aggressiveness of GBM.
Figure 7. PFKP Y64 Phosphorylation Is Positively Correlated with EGFR Y1068 Phosphorylation and PFK2 S483 Phosphorylation and with Poor Patient Prognosis in Human GBM Specimens.

(A) IHC staining of 57 human GBM specimens was performed with the indicated antibodies. Representative images from the staining of 5 different specimens are shown. High-magnification images correspond to the areas marked by yellow dotted lines. Scale bar, 100 μm.
(B) IHC stains were scored, and the correlation analyses were performed. Pearson correlation test was used. Note that the scores of some samples overlap.
(C) Kaplan-Meier plots of the overall survival rates in human GBM specimens (n = 57) in the groups with high (staining score, 4–8) and low (staining score, 0–3) expression of EGFR pY1068, PFKP pY64, and PFK2 pS483. p values were calculated by using the log-rank test.
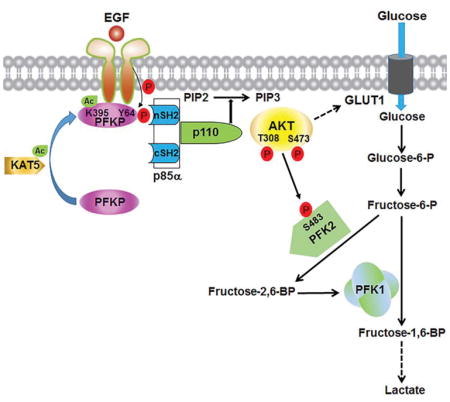
(D) Mechanism of EGF-induced and PFKP phosphorylation-dependent PI3K activation. EGFR activation results in KAT5-mediated PFKP K395 acetylation and subsequent translocation of PFKP to the plasma membrane, where EGFR phosphorylates PFKP at Y64. PFKP pY64 binds to the N-terminal SH2 domain of p85α for PI3K and subsequent AKT activation. AKT phosphorylates PFK2 for enhanced fructose-2,6-BP production and PFK1 activation. PFKP Y64 phosphorylation–enhanced PI3K/AKT-dependent PFK1 activation and GLUT1 expression promote the Warburg effect.
DISCUSSION
EGFR activation resulting from mutation or overexpression of EGFR occurs in many types of human cancer. However, the mechanisms underlying EGFR activation–induced PI3K activation are not fully elucidated. We found that EGFR activation induced c-Abl-mediated KAT5 phosphorylation and subsequent KAT5-mediated PFKP K395 acetylation. This acetylation, which may result in conformational change of PFKP, promoted the translocation of PFKP to the plasma membrane, where EGFR associated with and phosphorylated PFKP at Y64. Y64 of PFKP is in a SH2 domain binding motif, which is not conserved in PFKL and PFKM. Phosphorylated PFKP at Y64 bound to the N-terminal SH2 domain of p85α, which recruited p85α and p110 to the plasma membrane leading to activation of PI3K. PI3K-dependent activated AKT phosphorylated and activated PFK2, leading to increased production of F-2,6-BP and subsequent activation of PFK1. Thus, PFKP positively autoregulates PFK1 activity by a feedback mechanism involving PFKP phosphorylation-dependent activation of PI3K, AKT, and PFK2. The enhanced rate-limiting enzymatic activity of PFK1 and other AKT-dependent cellular activities including GLUT1 expression increased glucose uptake and lactate production (Figure 7D). The requirement of PFKP Y64 phosphorylation for EGFR-induced PI3K activation and -enhanced tumor cell proliferation and brain tumorigenesis highlights the crucial role of EGFR-phosphorylated PFKP in brain tumor development.
EGFR activation in normal human astrocytes resulted in relatively weak PFKP acetylation and phosphorylation, suggesting that the observed regulation also applies to normal cells to a moderate degree. EGFR activity in normal cells is relatively low, and EGFR-induced signaling is often transient. However, tumor cells with an amplified EGFR copy number or oncogenic EGFR mutations have amplified and sustained EGFR activation that constitutively actives downstream signaling molecules, including PFKP, PI3K, and AKT, and promotes tumor development.
Gab1 was previously shown to recognize both SH2 domains of p85α in vitro (Holgado-Madruga et al., 1996). However, how Gab1 binds to p85α in vivo is not clear. We found that mutation of the C-terminal SH2 domain, but not of the N-terminal SH2 domain, of p85α abrogated EGF-induced binding of Gab1 to p85α, strongly suggesting that Gab1 only bound to p85α at the C-terminal SH2 domain upon EGFR activation. In contrast, mutation of the N-terminal SH2 domain, but not of the C-terminal SH2 domain, of p85α inhibited EGF-induced binding of PFKP to p85α. The dramatic inhibition of PI3K activity by combined depletion of PFKP and Gab1, which was more than that induced by depletion of either protein alone, strongly suggests that PFKP and Gab1 bind to p85α and maximize the activation of PI3K.
The PFKP has been reported to be the PFK1 isoform most sensitive to activation by F-2,6-BP (Vora et al., 1985b); furthermore, PFK1 from glioma, with higher PFKP mRNA expression levels than those of PFKL and PFKM in human GBM (Lee et al., 2017), was more sensitive to activation by F-2,6-BP than was PFK1 from normal brain (Staal et al., 1987). It was noted that PFKP mRNA expression was correlated with total PFK1 activity in GBM cells (Lee et al., 2017). Of importance, overexpressed PFKP is able to promote F-2,6-BP production via enhanced AKT-dependent PFK2 activation. In addition, activated AKT phosphorylates PFKP at S386 and inhibits the binding of the TRIM21 E3 ligase to PFKP and the subsequent TRIM21-mediated polyubiquitylation and degradation of PFKP (Lee et al., 2017). Depletion of PFKP or expression of PFKP Y64F blocked activation of PI3K and AKT and the Warburg effect. Thus, GBM cells use a feedback mechanism to enhance the activity of the rate-limiting PFKP in the glycolysis pathway in a PFKP phosphorylation–dependent manner. Compared with the intensively studied regulation of glycolytic function of PFKP in aerobic glycolysis (Lee et al., 2017), the identified essential and previously unknown non-glycolytic function of PFKP in directly activation of PI3K and subsequent non-direct regulation of glycolytic enzymes for the Warburg effect underscore the potential of PFKP as a molecular target for therapeutic intervention in human cancer.
STAR★METHODS
CONTACT FOR REAGENT AND RESOURCE SHARING
Further information and requests for reagents may be directed to, and will be fulfilled by, the lead contact, Dr. Zhimin Lu (zhiminlu@mdanderson.org).
EXPERIMENTAL MODEL AND SUBJECT DETAILS
Intracranial Implantation of GBM Cells in Mice
We injected 5 × 10⁵ U87/EGFRvIII GBM cells (in 5 μl of DMEM per mouse), with or without modulation of PFKP expression, intracranially into 4-week-old male athymic nude mice, as described previously (Yang et al., 2011). We divided the mice into two groups. One group, which consisted of 7 mice for each of the subgroups, was used for histochemical analyses. The mice were euthanized 2 weeks after the GBM cells were injected. The brain of each mouse was harvested, fixed in 4% formaldehyde, and embedded in paraffin. Tumor formation and phenotype were determined by histological analysis of hematoxylin and eosin–stained sections. The other group with 9 mice in each subgroup was monitored for survival. The duration of mouse survival was analyzed by STATISTICA software and was represented by Kaplan–Meier plots. Humane end points included weight loss of 20%–25%, weakness preventing them from obtaining food or water, loss of appetite (anorexia for 24 h), moribund state, and an inability to participate in normal activities due to tumor growth. All mice were euthanized under anesthesia after two or more of these humane end points had been observed.
All of the mice were housed in the MD Anderson Cancer Center (Houston, Texas) animal facility, and all experiments were performed in accordance with relevant institutional and national guidelines and regulations approved by the Institutional Animal Care and Use Committee at MD Anderson Cancer Center.
Histologic Evaluation and Immunohistochemical Staining
Paraffin-embedded sections of mouse tumor tissues were prepared as described previously (Yang et al., 2011). The sections were stained with Mayer’s hematoxylin and subsequently with eosin (H&E) (Biogenex Laboratories, San Ramon, CA). Afterward, the slides were mounted with Universal Mount (Research Genetics Huntsville, AL).
An IHC analysis of Ki-67 was conducted with use of paraffin-embedded tissue sections. Ki-67 was detected with a VECTASTAIN Elite ABC kit (Vector Laboratories); tissue sections were then incubated with 3,3′-diaminobenzidine (Vector Laboratories), and the nuclei were stained with hematoxylin. Ki-67 staining was quantified by the percentage of positively stained nuclei per 400× field. Six randomly chosen fields per slide were analyzed and averaged.
The human GBM samples and clinical information were from the Chinese Glioma Genome Atlas (CGGA, http://www.cgga.org.cn) and listed in Supplementary Table S3. This study was approved by the Ethics Committee of Capital Medical University (China), and written informed consent was obtained from all patients. The tissue sections from 57 paraffin-embedded human GBM specimens were stained with antibodies against EGFR pY1068, PFKP pY64, PFK2 pS483, or non-specific immunoglobulin as a negative control. We quantitatively scored the tissue sections according to the percentage of positive cells and staining intensity, as previously defined (Yang et al., 2011). We assigned the following proportion scores: 0 if 0% of the tumour cells showed positive staining, 0.1–1.0 if 0.1% to 1% of cells were stained, 1.1–2.0 if 1.1% to 10% stained, 2.1–3.0 if 11% to 30% stained, 3.1–4.0 if 31% to 70% stained, and 4.1–5.0 if 71% to 100% stained. We rated the intensity of staining on a scale of 0 to 3: 0, negative; 1, weak; 2, moderate; and 3, strong. We then combined the proportion and intensity scores to obtain a total score (range, 0–8). Scores were compared with overall survival duration, defined as the time from the date of diagnosis to death or last known date of follow-up. The use of human glioblastoma samples and the clinical parameters was approved by the Institutional Review Board at Capital Medical University in Beijing, China.
Cell Culture and Transfection
NHA, U87, U251, LN229, MDA-MB231, DU145, and EGFRvIII-overexpressing U87 (U87/EGFRvIII) cells were maintained in Dulbecco’s modified Eagle’s medium (DMEM) supplemented with 10% bovine calf serum (HyClone, Logan, UT). U87 and U251 cells were authenticated by using short tandem repeat profiling at The University of Texas MD Anderson Cancer Center Characterized Cell Line Core Facility. Cells were plated at a density of 4 × 10⁵ per 60-mm dish or 1 × 10⁵ per well of a 6-well plate 18 h before transfection. The transfection procedure was performed as previously described (Jiang et al., 2014).
METHOD DETAILS
Materials
Rabbit polyclonal antibodies recognizing EGFR pY869 (11229, 1:1,000 for immunoblotting), PFK2 pS483 (12319, 1:1,000 for immunoblotting, 1:300 for immunohistochemistry), Gab1 (21283, 1:1,000 for immunoblotting), and PI3 Kinase p110 (41337, 1:1,000 for immunoblotting) were obtained from Signalway Antibody (College Park, MD). In addition, rabbit polyclonal antibody that recognizes PFKP pY64 was customized from the Signalway Antibody. A peptide containing PFKP pY64 was injected into rabbits. The rabbit serum was collected and purified using an affinity column conjugated with non-phosphorylated PFKP Y64 peptide to exclude the antibodies recognizing non-phosphorylated PFKP, followed by an affinity column conjugated with phosphorylated PFKP pY64 peptide to bind to and purify the PFKP pY64 antibody. The PFKP pY64 antibody was then eluted and concentrated. A working concentration of 1 μg/ml and 5 μg/ml was used for immunoblotting and immunohistochemical staining, respectively.
Anti-phosphorylated tyrosine antibody (PY99, sc-7020, 1:200 for immunoblotting), normal rabbit immunoglobulin (sc-2027), normal mouse immunoglobulin (sc-2025), monoclonal antibodies for PFKM (sc-67028, 1:1,000 for immunoblotting), GST (sc-138, clone B-14, 1:1,000 for immunoblotting), PFK2 pS483 (sc-32967, 1:200 for immunoblotting), and PFK2 (sc-377416, 1:200 for immunoblotting) were purchased from Santa Cruz Biotechnology (Santa Cruz, CA).
Rabbit polyclonal antibodies recognizing PFKP (12746, 1:1,000 for immunoblotting, 1:500 for immunoprecipitation), PFKL (8175, 1:1,000 for immunoblotting), PI3 Kinase p85α (4257, 1:1,000 for immunoblotting, 1:500 for immunoprecipitation), EGFR pY1068 (2234, 1:300 for immunohistochemistry), AKT pT308 (4056, 1:1,000 for immunoblotting), AKT pS473 (4060, 1:1,000 for immunoblotting), AKT (9272, 1:1,000 for immunoblotting), EKR1/2 pT202/pY204 (9101, 1:1,000 for immunoblotting), EKR1/2 (9102, 1:1,000 for immunoblotting), acetylated-lysine (9441, 1:1,000 for immunoblotting), c-Abl pY245 (2861, 1:1,000 for immunoblotting), and c-Abl (2862, 1:1,000 for immunoblotting) were purchased from Cell Signaling Technology (Danvers, MA).
Nilotinib (CDS023093) and mouse monoclonal antibodies for Flag (F3165, clone M2, 1:5,000 for immunoblotting, 1:1,000 for immunoprecipitation), HA (H6908, 1:5,000 for immunoblotting, 1:1,000 for immunoprecipitation), and tubulin (T6074, clone B-5-1-2, 1:5,000 for immunoblotting) were purchased from Sigma (St. Louis, MO). Mouse monoclonal antibodies for EGFR (610016, 1:1,000 for immunoblotting, 1:200 for immunofluorescence) and N-Cadherin (610920, 1:1,000 for immunoblotting) were purchased from BD Biosciences (San Jose, CA). Mouse monoclonal antibodies for GLUT1 (ab652, 1:1,000 for immunoblotting) and KAT5 (ab151432, 1:1,000 for immunoblotting) were obtained from Abcam (Cambridge, MA).
Human recombinant EGF (01-407) and an anti-Ki67 antibody (AB9260, 1:300 for immunohistochemistry) were obtained from EMD Millipore (Billerica, MA). The EGFR inhibitor AG1478 (658552) and the PFKFB3 inhibitor 3PO (525330) were from Calbiochem (San Diego, CA). Hygromycin (400053), puromycin (540222), and G418 (345810) were purchased from EMD Biosciences (San Diego, CA). Calf intestinal alkaline phosphatase (M0290) was obtained from New England Biolabs (Ipswich, MA). Active GST-EGFR (695-end, E10-11G) was obtained from Signalchem (Richmond, BC, Canada). HyFect transfection reagents (E2650) were obtained from Denville Scientific (Metuchen, NJ). DAPI; Alexa Fluor 488, 594, and 633 goat anti-rabbit antibodies; and Alexa Fluor 488, 594, and 633 goat anti-mouse antibodies were from Molecular Probes (Eugene, OR).
DNA Constructs and Mutagenesis
Polymerase chain reaction (PCR)-amplified human PFKP, PFKL, PFKM, p85α, and KAT5 were cloned into pcDNA3.1/hygro(+)-Flag, pET32a, and pGEX-4T1 vector. pECE-Myr-HA-Akt1 (delta4-129) was purchased from Addgene (Cambridge, MA). pcDNA3.1/hygro(+)-Flag PFKP K395R, PFKP Y58F, PFKP Y64F, PFKP Y512F, PFKP Y645F, PFKP H307A, p85α R358L, p85α R649L, and pET32a PFKP Y64F were made with use of the QuikChange site-directed mutagenesis kit (Agilent Technologies). shRNA-resistant (r) PFKP contained a448c, g450c, c453t, and c456g mutations. shRNA-resistant (r) KAT5 contained a654g, g660a, and g669c mutations.
The following pGIPZ shRNAs were used: control shRNA oligonucleotide, GCTTCTAACACCGGAGGTCTT; PFKP shRNA oligonucleotide, AGGAACGGCCAGATCGATA; PFKL shRNA oligonucleotide, AGTCTCTGAGATCTTACCT; PFKM shRNA oligonucleotide, TGATTTTCCCAGACATCCA; KAT5 shRNA oligonucleotide, TTCCATCAGAGCTGTCCTG; Gab1 shRNA oligonucleotide, TTGTTAAATGTCAATCCAG.
Quantitative Real-Time PCR Analysis
Total RNA isolation, reverse transcription (RT), and real-time PCR were conducted as described previously (Yang et al., 2012a). The following primer pairs were used for quantitative real-time PCR: GLUT1, 5′-TGACCATCGCGCTAGCACTGC -3′ (forward) and 5′-AACGGCAATGGCAGCTGGACG -3′ (reverse); β-actin, 5′-ATGGATGACGATATCGCTGCGC-3′ (forward) and 5′-GCAGCACAGGGTGCTCCTCA-3′ (reverse).
Purification of Recombinant Proteins
His-PFKP WT, His-PFKP Y64F, His-PFKP K395R, GST-KAT5, and GST-p85α were expressed in bacteria and purified, as described previously (Ji et al., 2009).
In Vitro Kinase Assay
The kinase reactions were performed as described previously (Ji et al., 2009). In brief, after the in vitro acetylation reaction, the acetylated PFKP (100 ng) was washed and incubated with EGFR (100 ng) in 25 μL of kinase buffer (50 mM Tris-HCl [pH 7.5], 100 mM KCl, 50 mM MgCl2, 1mM Na3VO4, 1mM DTT, 5% glycerol, 0.5mM ATP, and 10 μCi [γ-32P]ATP) at 25°C for 1 hr. The reaction was terminated by adding SDS-PAGE loading buffer and heated at 100°C for 5min. The reaction mixture was then subjected to an SDS-PAGE analysis.
In Vitro Acetylation Assay
Purified recombinant PFKP and KAT5 were incubated in 30 μl of reaction buffer (20 mM Tris-HCl [pH 8.0], 20% glycerol, 100 mM KCl, 1 mM DTT, 0.2 mM EDTA, 10 μM TSA, 10 mM nicotinamide, and 100 μM acetyl-CoA) at 30°C for 1 h. The reaction was terminated by adding SDS-PAGE loading buffer. The samples were then subjected to immunoblotting analyses.
Pull-Down Assay
Pull-down assays were performed as described previously (Ji et al., 2012).
Immunoprecipitation and Immunoblotting Analysis
Extraction of proteins from cultured cells using a modified buffer was followed by immunoprecipitation and immunoblotting with corresponding antibodies, as described previously (Lu et al., 1998). Each experiment was repeated at least three times.
Immunofluorescence Analysis
Cells were fixed and incubated with primary antibodies at a dilution of 1:100, fluorescence dye-conjugated secondary antibodies, and DAPI, according to standard protocols. Cells were examined using a deconvolutional microscope (Zeiss, Thornwood, NY) with a 40 × oil immersion objective. Axio Vision 4 software from Zeiss was used to deconvolve Z series images. AxioVision 4 module co-localization (Zeiss, Thornwood, NY) was used for the co-localization analysis of deconvoluted images (Fang et al., 2007).
CRISPR/Cas9-mediated Genome Editing
Genomic mutations were introduced into cells with use of the CRISPR/Cas9 system, as described previously (Li et al., 2016; Qian et al., 2017b). Briefly, single-guided RNAs (sgRNAs) were designed to target the genomic area adjacent to the PFKP mutation sites using the CRISPR design tool (http://crispr.mit.edu/). The annealed guide RNA oligonucleotides were inserted into PX458 vector (Addgene, Cambridge, MA) digested with the BbsI restriction enzyme. Cells were seeded at 60% confluence, followed by co-transfection of sgRNAs (0.5 μg) and single-stranded donor oligonucleotide (10 pmol) as a template to introduce mutations. Twenty-four hours after transfection, cells were trypsinized and diluted for single cells and seeded into 96-well plates. Genomic DNA was extracted from GFP-positive cells, followed by sequencing of the PCR products spanning the mutation sites. The oligonucleotide and primers used for sgRNA cloning and genomic DNA sequencing are listed in Supplementary Table S2.
Mass Spectrometry Analysis
An in vitro KAT5-acetylated purified PFKP was digested in-gel in 50 mM ammonium bicarbonate buffer containing Rapigest (Waters Corp., Milford, MA) overnight at 37°C with 200 ng of sequencing-grade modified trypsin (Promega, Madison, WI). The digest was analyzed by LC-MS/MS on an Orbitrap-Elite mass spectrometer (Thermo Fisher Scientific, Waltham, MA).
Immunoprecipitated PFKP protein from EGF-treated U251 cells was digested and analyzed by LC-MS/MS on an Orbitrap-Ellite mass spectrometer (Thermo Fisher Scientific, Waltham, MA). Proteins were identified by searching of the fragment spectra against the SwissProt protein database (EBI) using Mascot Server v.2.3 (Matrix Science, London, UK) and SEQUEST v.1.27 (University of Washington, Seattle, WA) via Proteome Discoverer software v.1.4 (Thermo Fisher Scientific). Phosphopeptide matches were analyzed by using the PhosphoRS algorithm implemented in Proteome Discoverer and manually curated (Taus et al., 2011).
Analysis of Intermediate Metabolites by LC-MS/MS
To determine the incorporation of glucose carbon (13C6-glucose) into intracellular lactate, extracts were prepared and analyzed by high-resolution mass spectrometry (HRMS). Approximately 80% confluent cells were seeded in 10-cm dishes in triplicate. For glucose labeling, cells were washed with glucose-free DMEM medium and incubated in fresh medium containing 13C6-glucose (10 mM) for 30 min. Samples were centrifuged at 17,000 g for 5 min at 4°C and supernatants were transferred to clean tubes, followed by evaporation to dryness using nitrogen. Samples were reconstituted in 0.2% ammonium hydroxide in ammonium acetate (10 mM), then 10 μl was injected into a Thermo Scientific Vanquish liquid chromatography (LC) system containing a Thermo Hypercarb 100 × 3 mm column with 3-μm particle size heated to 35°C. Mobile phase A (MPA) consisted of 0.2% ammonium hydroxide in ammonium acetate (10 mM), and mobile phase B (MPB) consisted of 0.2% ammonium hydroxide in acetonitrile. Using a flowrate of 0.3 ml/min, the gradient elution program was: 0 min (0% MPB) – 2.0 min (0% MPB) – 15.0 min (30% MPB) – 15.1 min (95% MPB) – 20.0 min (95% MPB) – 20.1 min (0% MPB) – 25.0 min (STOP). Data were acquired with use of a Thermo Orbitrap Fusion Tribrid Mass Spectrometer via Selected Ion Mode (SIM) electrospray positive mode.
Metabolites were extracted by adding 500 μl of 75/25 (v/v) ethanol/10 mM HEPES buffer to the dish of cells, scraping, transferring the cells and extraction solvent to a microfuge tube, and vortexing for 2 min. Data acquisition was performed via SIM electrospray negative mode. Peak integration and area calculation were performed by using Thermo TraceFinder software.
Subcellular Fractionation
Membrane and cytoplasmic fractions, used for the assessment of PFKP, p85α, and p110 recruitment to the membrane, were extracted by hypotonic lysis and differential centrifugation. In brief, cells were centrifuged at 300 × g and washed with ice-cold PBS. The washed cell pellet was resuspended in hypotonic cell lysis buffer (10 mM HEPES [pH 7.5], 1.5 mM MgCl2, 10 mM KCl, 0.5 mM DTT, and protease inhibitors) in an ice-cold Dounce Homogenizer and incubated in this solution for 10 min on ice. The swollen cells were homogenized on ice 50 times or until all cells were visibly lysed. The homogenate was transferred to a 1.5-ml microcentrifuge tube and centrifuged at 700 × g for 10 min at 4°C. Supernatant was collected and transferred to a new vial, and the supernatant was centrifuged at 16,000 × g for 60 min at 4°C. The final supernatant contained the cytoplasmic proteins, and the pellet contained the total cellular membrane protein. Equal amounts of membrane and cytoplasmic fractions were resolved by SDS/PAGE and analyzed by immunoblotting with use of the indicated antibodies. Tubulin was used as the cytoplasmic marker.
PI3K Activity Assay
p85α was immunoprecipitated from equal protein cell lysates with the rabbit monoclonal anti-PI3 Kinase p85α antibody, and the PI3K activity was evaluated with a PI3 kinase ELISA kit (Echelon Biosciences) according to the manufacturer’s protocol. The ELISA kit was also used to determine PIP3 levels (mass ELISA).
Measurements of Glucose Consumption and Lactate Production
Cells were seeded in culture dishes, and the medium was changed after 6 h with non-serum DMEM. Cells were incubated for 24 h, and the culture medium was then collected for measurement of glucose and lactate concentrations. Glucose levels were determined by using a glucose (GO) assay kit (Sigma). Glucose consumption was the difference in glucose concentration between the collected culture medium and DMEM. Lactate levels were determined by using a lactate assay kit (Eton Bioscience, San Diego, CA). All results were normalized to the final cell number.
Measurement of PFK1 Activity
The reaction was performed by using either cell lysate (30 μg) or recombinant purified PFKP (0.1 μg) in 1 ml of reaction buffer containing 50 mM Tris-HCl (pH 7.5), 100 mM KCl, 5 mM MgCl2, 1 mM ATP, 0.2 mM NADH, 5 mM Na2HPO4, 0.1 mM AMP, 1 mM NH4Cl, 5 mM fructose 6-phosphate (Sigma), 5 U of triose phosphate isomerase (Sigma), 2 U of aldolase (Sigma), and 1 U α-glycerophosphate dehydrogenase (Sigma). Absorbance was recorded at 339 nm at room temperature in a 96-well plate every 15 s for 10 min. In some experiments, PFK1 activity was determined by using a PFK activity colorimetric assay Kit (BioVision, Milpitas, CA).
Fructose-2,6-bisphosphate Measurement Assay
Intracellular fructose-2,6-bisphosphate levels were determined by using a previously described method (Van Schaftingen et al., 1982). Briefly, cells were centrifuged at 300 × g and washed in PBS; cells were then resuspended in 100 mM NaOH/50 mM Tris acetate (pH 8.0) and then in 1 volume of 0.13N NaOH to obtain a pH >11. Cell lysates were vortexed for 103s, incubated at 80°C for 53min, and cooled in an ice bath; they were then neutralized to pH 7.2 by adding ice-cold acetic acid and 20 mM HEPES and incubated at 25°C for 23min in the following assay mixture: 503mM Tris, 23mM Mg2+, 13mM fructose 6-phosphate, 0.2 mM NADH, 10 U/L PPi-dependent PFK1, 2 U aldolase, 5 U triosephosphate isomerase, and 1 U α-glycerophosphate dehydrogenase. Next, 0.53mM pyrophosphate was added, and the rate of change in absorbance (OD=3393nm) per minute for 5 min was determined. The values were normalized to total cellular protein. Data represent the means ± SD of three independent experiments.
Cell Proliferation Assay
A total of 2 × 10⁴ cells were plated and counted 7 days after seeding in DMEM with 0.5% bovine calf serum. Data represent the means ± SD of three independent experiments.
QUANTIFICATION AND STATISTICAL ANALYSES
All quantitative data were presented as the mean ± SD. Sample number (n) indicates the number of independent biological samples in each experiment. A two-group comparison was conducted by using two-sided, two-sample Student t test. Simultaneous comparison of more than two groups was conducted by one-way ANOVA (SPSS statistical package, version 12; SPSS Inc.). Values of P < 0.05 were considered statistically significant.
DATA AND SOFTWARE AVAILABILITY
Raw data have been deposited to Mendeley Data and are available at http://dx.doi.org/doi:10.17632/658dzgyh5d.1.
Supplementary Material
Table S1. LC-MS/MS analysis of PFKP-interacting proteins. Related to Figure 1.
Table S2. Oligos used in CRISPR/cas9-mediated knock-in study. Related to Figure 2.
Table S3. Information of GBM patients. Related to the STAR Methods.
Highlights.
KAT5 acetylates PFKP at K395 and promotes the binding of PFKP to EGFR.
EGFR-phosphorylated PFKP Y64 binds to p85α SH2 domain and activates PI3K.
PFKP-activated AKT enhances GLUT1 expression and PFK2-mediated PFK1 activity.
PFKP Y64 phosphorylation enhances the Warburg effect and tumorigenesis.
Acknowledgments
We thank Tamara Locke in the Department of Scientific Publications at The University of Texas MD Anderson Cancer Center for critically reading this manuscript and Dr. Li Li (Mass Spectrometry Specialist) at The University of Texas Health Center at Houston for technical assistance.
This work was supported by National Cancer Institute grants 2R01 CA109035 (Z.L.) and 1R0 CA169603 (Z.L.), National Institute of Neurological Disorders and Stroke grant 1R01 NS089754 (Z.L.), NIH/NCI award numbers P30CA016672 and 1S10OD012304-01, 2P50 CA127001 (Brain Cancer SPORE), a Cancer Prevention Research Institute of Texas (CPRIT) Core Facility Award RP130397 (P.L.), and a Sister Institution Network Fund from MD Anderson (Z.L.). Z.L. is a Ruby E. Rutherford Distinguished Professor.
Footnotes
DECLARATION OF INTERESTS
The authors declare no competing interests.
AUTHOR CONTRIBUTIONS
Conceptualization, Z.L., J-H.L., and R.L.; Methodology, Investigation, and Formal Analysis, J-H.L., R.L., J.L., Y.W., L.T., X.L., X.Q., C.Z., Y.X., Y.Z., D.X., L.D., W.G., and P.L.L.; Writing – Original Draft, Z.L. and J-H.L.; Writing – Review & Editing, Z.L., J-H.L., R.L., and G.B.M.; Funding Acquisition, Z.L.; Resources, Z.D., Q.C., T.J., and G.B.M.; Supervision, Z.L.
Publisher's Disclaimer: This is a PDF file of an unedited manuscript that has been accepted for publication. As a service to our customers we are providing this early version of the manuscript. The manuscript will undergo copyediting, typesetting, and review of the resulting proof before it is published in its final citable form. Please note that during the production process errors may be discovered which could affect the content, and all legal disclaimers that apply to the journal pertain.
References
- Alessi DR, James SR, Downes CP, Holmes AB, Gaffney PR, Reese CB, Cohen P. Characterization of a 3-phosphoinositide-dependent protein kinase which phosphorylates and activates protein kinase Balpha. Curr Biol. 1997;7:261–269. doi: 10.1016/s0960-9822(06)00122-9. [DOI] [PubMed] [Google Scholar]
- Bader AG, Kang S, Zhao L, Vogt PK. Oncogenic PI3K deregulates transcription and translation. Nature reviews Cancer. 2005;5:921–929. doi: 10.1038/nrc1753. [DOI] [PubMed] [Google Scholar]
- Barthel A, Okino ST, Liao J, Nakatani K, Li J, Whitlock JP, Jr, Roth RA. Regulation of GLUT1 gene transcription by the serine/threonine kinase Akt1. The Journal of biological chemistry. 1999;274:20281–20286. doi: 10.1074/jbc.274.29.20281. [DOI] [PubMed] [Google Scholar]
- Cairns RA, Harris IS, Mak TW. Regulation of cancer cell metabolism. Nat Rev Cancer. 2011;11:85–95. doi: 10.1038/nrc2981. [DOI] [PubMed] [Google Scholar]
- Deprez J, Vertommen D, Alessi DR, Hue L, Rider MH. Phosphorylation and activation of heart 6-phosphofructo-2-kinase by protein kinase B and other protein kinases of the insulin signaling cascades. The Journal of biological chemistry. 1997;272:17269–17275. doi: 10.1074/jbc.272.28.17269. [DOI] [PubMed] [Google Scholar]
- Dunaway GA, Kasten TP. Nature of the subunits of the 6-phosphofructo-1-kinase isoenzymes from rat tissues. Biochem J. 1987;242:667–671. doi: 10.1042/bj2420667. [DOI] [PMC free article] [PubMed] [Google Scholar]
- Dunaway GA, Kasten TP, Sebo T, Trapp R. Analysis of the phosphofructokinase subunits and isoenzymes in human tissues. Biochem J. 1988;251:677–683. doi: 10.1042/bj2510677. [DOI] [PMC free article] [PubMed] [Google Scholar]
- Engelman JA, Luo J, Cantley LC. The evolution of phosphatidylinositol 3-kinases as regulators of growth and metabolism. Nat Rev Genet. 2006;7:606–619. doi: 10.1038/nrg1879. [DOI] [PubMed] [Google Scholar]
- Fang D, Hawke D, Zheng Y, Xia Y, Meisenhelder J, Nika H, Mills GB, Kobayashi R, Hunter T, Lu Z. Phosphorylation of beta-catenin by AKT promotes beta-catenin transcriptional activity. J Biol Chem. 2007;282:11221–11229. doi: 10.1074/jbc.M611871200. [DOI] [PMC free article] [PubMed] [Google Scholar]
- Fruman DA. Regulatory subunits of class IA PI3K. Curr Top Microbiol Immunol. 2010;346:225–244. doi: 10.1007/82_2010_39. [DOI] [PubMed] [Google Scholar]
- Holgado-Madruga M, Emlet DR, Moscatello DK, Godwin AK, Wong AJ. A Grb2-associated docking protein in EGF- and insulin-receptor signalling. Nature. 1996;379:560–564. doi: 10.1038/379560a0. [DOI] [PubMed] [Google Scholar]
- Hsu PP, Sabatini DM. Cancer cell metabolism: Warburg and beyond. Cell. 2008;134:703–707. doi: 10.1016/j.cell.2008.08.021. [DOI] [PubMed] [Google Scholar]
- Ji H, Ding Z, Hawke D, Xing D, Jiang BH, Mills GB, Lu Z. AKT-dependent phosphorylation of Niban regulates nucleophosmin- and MDM2-mediated p53 stability and cell apoptosis. EMBO reports. 2012;13:554–560. doi: 10.1038/embor.2012.53. [DOI] [PMC free article] [PubMed] [Google Scholar]
- Ji HT, Wang J, Nika H, Hawke D, Keezer S, Ge QY, Fang BL, Fang XX, Fang DX, Litchfield DW, et al. EGF-Induced ERK Activation Promotes CK2-Mediated Disassociation of alpha-Catenin from beta-Catenin and Transactivation of beta-Catenin. Molecular Cell. 2009;36:547–559. doi: 10.1016/j.molcel.2009.09.034. [DOI] [PMC free article] [PubMed] [Google Scholar]
- Jiang Y, Wang Y, Wang T, Hawke DH, Zheng Y, Li X, Zhou Q, Majumder S, Bi E, Liu DX, et al. PKM2 phosphorylates MLC2 and regulates cytokinesis of tumour cells. Nat Commun. 2014;5:5566. doi: 10.1038/ncomms6566. [DOI] [PMC free article] [PubMed] [Google Scholar]
- Kahn A, Meienhofer MC, Cottreau D, Lagrange JL, Dreyfus JC. Phosphofructokinase (PFK) isozymes in man. I. Studies of adult human tissues. Hum Genet. 1979;48:93–108. doi: 10.1007/BF00273280. [DOI] [PubMed] [Google Scholar]
- Kaidi A, Jackson SP. KAT5 tyrosine phosphorylation couples chromatin sensing to ATM signalling. Nature. 2013;498:70–74. doi: 10.1038/nature12201. [DOI] [PMC free article] [PubMed] [Google Scholar] [Retracted]
- Kloos M, Bruser A, Kirchberger J, Schoneberg T, Strater N. Crystal structure of human platelet phosphofructokinase-1 locked in an activated conformation. Biochem J. 2015;469:421–432. doi: 10.1042/BJ20150251. [DOI] [PubMed] [Google Scholar]
- Koch CA, Anderson D, Moran MF, Ellis C, Pawson T. SH2 and SH3 domains: elements that control interactions of cytoplasmic signaling proteins. Science. 1991;252:668–674. doi: 10.1126/science.1708916. [DOI] [PubMed] [Google Scholar]
- Lee JH, Liu R, Li J, Zhang C, Wang Y, Cai Q, Qian X, Xia Y, Zheng Y, Piao Y, et al. Stabilization of phosphofructokinase 1 platelet isoform by AKT promotes tumorigenesis. Nature communications. 2017;8:949. doi: 10.1038/s41467-017-00906-9. [DOI] [PMC free article] [PubMed] [Google Scholar]
- Li X, Jiang Y, Meisenhelder J, Yang W, Hawke DH, Zheng Y, Xia Y, Aldape K, He J, Hunter T, et al. Mitochondria-Translocated PGK1 Functions as a Protein Kinase to Coordinate Glycolysis and the TCA Cycle in Tumorigenesis. Mol Cell. 2016;61:705–719. doi: 10.1016/j.molcel.2016.02.009. [DOI] [PMC free article] [PubMed] [Google Scholar]
- Lu Z, Liu D, Hornia A, Devonish W, Pagano M, Foster DA. Activation of protein kinase C triggers its ubiquitination and degradation. Mol Cell Biol. 1998;18:839–845. doi: 10.1128/mcb.18.2.839. [DOI] [PMC free article] [PubMed] [Google Scholar]
- Manning BD, Cantley LC. AKT/PKB signaling: navigating downstream. Cell. 2007;129:1261–1274. doi: 10.1016/j.cell.2007.06.009. [DOI] [PMC free article] [PubMed] [Google Scholar]
- Mayer BJ, Jackson PK, Van Etten RA, Baltimore D. Point mutations in the abl SH2 domain coordinately impair phosphotyrosine binding in vitro and transforming activity in vivo. Mol Cell Biol. 1992;12:609–618. doi: 10.1128/mcb.12.2.609. [DOI] [PMC free article] [PubMed] [Google Scholar]
- Moon JS, Kim HE, Koh E, Park SH, Jin WJ, Park BW, Park SW, Kim KS. Kruppel-like factor 4 (KLF4) activates the transcription of the gene for the platelet isoform of phosphofructokinase (PFKP) in breast cancer. The Journal of biological chemistry. 2011;286:23808–23816. doi: 10.1074/jbc.M111.236737. [DOI] [PMC free article] [PubMed] [Google Scholar]
- Mor I, Cheung EC, Vousden KH. Control of glycolysis through regulation of PFK1: old friends and recent additions. Cold Spring Harb Symp Quant Biol. 2011;76:211–216. doi: 10.1101/sqb.2011.76.010868. [DOI] [PubMed] [Google Scholar]
- Moreno-Sanchez R, Rodriguez-Enriquez S, Marin-Hernandez A, Saavedra E. Energy metabolism in tumor cells. FEBS J. 2007;274:1393–1418. doi: 10.1111/j.1742-4658.2007.05686.x. [DOI] [PubMed] [Google Scholar]
- Mouton V, Toussaint L, Vertommen D, Gueuning MA, Maisin L, Havaux X, Sanchez-Canedo C, Bertrand L, Dequiedt F, Hemmings BA, et al. Heart 6-phosphofructo-2-kinase activation by insulin requires PKB (protein kinase B), but not SGK3 (serum- and glucocorticoid-induced protein kinase 3) Biochem J. 2010;431:267–275. doi: 10.1042/BJ20101089. [DOI] [PubMed] [Google Scholar]
- Novellasdemunt L, Tato I, Navarro-Sabate A, Ruiz-Meana M, Mendez-Lucas A, Perales JC, Garcia-Dorado D, Ventura F, Bartrons R, Rosa JL. Akt-dependent activation of the heart 6-phosphofructo-2-kinase/fructose-2,6-bisphosphatase (PFKFB2) isoenzyme by amino acids. J Biol Chem. 2013;288:10640–10651. doi: 10.1074/jbc.M113.455998. [DOI] [PMC free article] [PubMed] [Google Scholar]
- Plattner R, Kadlec L, DeMali KA, Kazlauskas A, Pendergast AM. c-Abl is activated by growth factors and Src family kinases and has a role in the cellular response to PDGF. Genes Dev. 1999;13:2400–2411. doi: 10.1101/gad.13.18.2400. [DOI] [PMC free article] [PubMed] [Google Scholar]
- Qian X, Li X, Cai Q, Zhang C, Yu Q, Jiang Y, Lee JH, Hawke D, Wang Y, Xia Y, et al. Phosphoglycerate Kinase 1 Phosphorylates Beclin1 to Induce Autophagy. Mol Cell. 2017a doi: 10.1016/j.molcel.2017.01.027. [DOI] [PMC free article] [PubMed] [Google Scholar]
- Qian X, Li X, Tan L, Lee JH, Xia Y, Cai Q, Zheng Y, Wang H, Lorenzi PL, Lu Z. Conversion of PRPS hexamer to monomer by AMPK-mediated phosphorylation inhibits nucleotide synthesis in response to energy stress. Cancer Discov. 2017b doi: 10.1158/2159-8290.CD-17-0712. [DOI] [PMC free article] [PubMed] [Google Scholar]
- Salamon RS, Backer JM. Phosphatidylinositol-3,4,5-trisphosphate: tool of choice for class I PI 3-kinases. BioEssays: news and reviews in molecular, cellular and developmental biology. 2013;35:602–611. doi: 10.1002/bies.201200176. [DOI] [PMC free article] [PubMed] [Google Scholar]
- Sanchez-Martinez C, Aragon JJ. Analysis of phosphofructokinase subunits and isozymes in ascites tumor cells and its original tissue, murine mammary gland. FEBS Lett. 1997;409:86–90. doi: 10.1016/s0014-5793(97)00496-1. [DOI] [PubMed] [Google Scholar]
- Songyang Z, Shoelson SE, Chaudhuri M, Gish G, Pawson T, Haser WG, King F, Roberts T, Ratnofsky S, Lechleider RJ, et al. SH2 domains recognize specific phosphopeptide sequences. Cell. 1993;72:767–778. doi: 10.1016/0092-8674(93)90404-e. [DOI] [PubMed] [Google Scholar]
- Staal GE, Kalff A, Heesbeen EC, van Veelen CW, Rijksen G. Subunit composition, regulatory properties, and phosphorylation of phosphofructokinase from human gliomas. Cancer Res. 1987;47:5047–5051. [PubMed] [Google Scholar]
- Stine ZE, Dang CV. Stress eating and tuning out: cancer cells re-wire metabolism to counter stress. Crit Rev Biochem Mol Biol. 2013;48:609–619. doi: 10.3109/10409238.2013.844093. [DOI] [PMC free article] [PubMed] [Google Scholar]
- Stokoe D, Stephens LR, Copeland T, Gaffney PR, Reese CB, Painter GF, Holmes AB, McCormick F, Hawkins PT. Dual role of phosphatidylinositol-3,4,5-trisphosphate in the activation of protein kinase B. Science. 1997;277:567–570. doi: 10.1126/science.277.5325.567. [DOI] [PubMed] [Google Scholar]
- Taus T, Kocher T, Pichler P, Paschke C, Schmidt A, Henrich C, Mechtler K. Universal and confident phosphorylation site localization using phosphoRS. J Proteome Res. 2011;10:5354–5362. doi: 10.1021/pr200611n. [DOI] [PubMed] [Google Scholar]
- Van Schaftingen E, Lederer B, Bartrons R, Hers HG. A kinetic study of pyrophosphate: fructose-6-phosphate phosphotransferase from potato tubers. Application to a microassay of fructose 2,6-bisphosphate. Eur J Biochem. 1982;129:191–195. doi: 10.1111/j.1432-1033.1982.tb07039.x. [DOI] [PubMed] [Google Scholar]
- Vander Heiden MG, Cantley LC, Thompson CB. Understanding the Warburg effect: the metabolic requirements of cell proliferation. Science. 2009;324:1029–1033. doi: 10.1126/science.1160809. [DOI] [PMC free article] [PubMed] [Google Scholar]
- Vivanco I, Sawyers CL. The phosphatidylinositol 3-Kinase AKT pathway in human cancer. Nature reviews Cancer. 2002;2:489–501. doi: 10.1038/nrc839. [DOI] [PubMed] [Google Scholar]
- Vora S, Halper JP, Knowles DM. Alterations in the activity and isozymic profile of human phosphofructokinase during malignant transformation in vivo and in vitro: transformation- and progression-linked discriminants of malignancy. Cancer Res. 1985a;45:2993–3001. [PubMed] [Google Scholar]
- Vora S, Oskam R, Staal GE. Isoenzymes of phosphofructokinase in the rat. Demonstration of the three non-identical subunits by biochemical, immunochemical and kinetic studies. Biochem J. 1985b;229:333–341. doi: 10.1042/bj2290333. [DOI] [PMC free article] [PubMed] [Google Scholar]
- Wang G, Xu Z, Wang C, Yao F, Li J, Chen C, Sun S. Differential phosphofructokinase-1 isoenzyme patterns associated with glycolytic efficiency in human breast cancer and paracancer tissues. Oncol Lett. 2013;6:1701–1706. doi: 10.3892/ol.2013.1599. [DOI] [PMC free article] [PubMed] [Google Scholar]
- Warburg O. On the origin of cancer cells. Science. 1956;123:309–314. doi: 10.1126/science.123.3191.309. [DOI] [PubMed] [Google Scholar]
- Webb BA, Forouhar F, Szu FE, Seetharaman J, Tong L, Barber DL. Structures of human phosphofructokinase-1 and atomic basis of cancer-associated mutations. Nature. 2015;523:111–114. doi: 10.1038/nature14405. [DOI] [PMC free article] [PubMed] [Google Scholar]
- Wieman HL, Wofford JA, Rathmell JC. Cytokine stimulation promotes glucose uptake via phosphatidylinositol-3 kinase/Akt regulation of Glut1 activity and trafficking. Mol Biol Cell. 2007;18:1437–1446. doi: 10.1091/mbc.E06-07-0593. [DOI] [PMC free article] [PubMed] [Google Scholar]
- Yang W, Xia Y, Hawke D, Li X, Liang J, Xing D, Aldape K, Hunter T, Alfred Yung WK, Lu Z. PKM2 phosphorylates histone H3 and promotes gene transcription and tumorigenesis. Cell. 2012a;150:685–696. doi: 10.1016/j.cell.2012.07.018. [DOI] [PMC free article] [PubMed] [Google Scholar]
- Yang W, Xia Y, Ji H, Zheng Y, Liang J, Huang W, Gao X, Aldape K, Lu Z. Nuclear PKM2 regulates beta-catenin transactivation upon EGFR activation. Nature. 2011;480:118–122. doi: 10.1038/nature10598. [DOI] [PMC free article] [PubMed] [Google Scholar]
- Yang W, Zheng Y, Xia Y, Ji H, Chen X, Guo F, Lyssiotis CA, Aldape K, Cantley LC, Lu Z. ERK1/2-dependent phosphorylation and nuclear translocation of PKM2 promotes the Warburg effect. Nat Cell Biol. 2012b;14:1295–1304. doi: 10.1038/ncb2629. [DOI] [PMC free article] [PubMed] [Google Scholar]
Associated Data
This section collects any data citations, data availability statements, or supplementary materials included in this article.
Supplementary Materials
Table S1. LC-MS/MS analysis of PFKP-interacting proteins. Related to Figure 1.
Table S2. Oligos used in CRISPR/cas9-mediated knock-in study. Related to Figure 2.
Table S3. Information of GBM patients. Related to the STAR Methods.