. 2018 Aug 9;7:e39879. doi: 10.7554/eLife.39879

Figure 4. Despite the recovery of CB size, PCs are poorly replenished and motor behavior deficits develop when PCs are killed at P5 but not at P1.

(A) Number of CALB1+ cells at P30 (One-way ANOVA, F(2,16)=9.464, p=0.002, n ≥ 6). (B) Number of BrdU+ PCs 2 days post DT-injection in P1- or P5-PC-DTR mice (Two-tailed t-test, p=0.04). (C). Quantification of CB area in midline sagittal sections demonstrates that CB size is smaller at P12 in P5-PC-DTR mice but not later (Two-way ANOVA, F(1,22)=7.045, p=0.01, n ≥ 3). (D–E) PC soma size (D, One-way ANOVA, F(2.11) = 20.56, p=0.0002, n ≥ 4) and primary and secondary dendrite lengths (E, One-way ANOVA, F(2,11)=14.54, p=0.0008, n ≥ 4) at P30 were increased in P5-PC-DTR animals compared to No DT and P1-PC-DTR animals. (F–G) Latency to fall from rotarod at each trial (F, Two-way ANOVA, F(2,34)=8.37, p=0.001, n ≥ 9) and cumulative analysis (G, One-way ANOVA, F(2,34)=11.12, p=0.0002, n ≥ 9, No DT vs. DT@P1: p=0.83) for P30 P5-PC-DTR animals compared to No DT and P1-PC-DTR animals. (H) Analysis of grip strength showed no change in P1 (n = 9, vs No DT: p=0.89) and P5 (n = 11, vs. No DT: p=0.84, vs. DT@P1: p=0.64) DT-injected mice compared to controls (No DT, n = 17). (I–J) Representative images (I) and quantification (J) of footprint analysis performed on P1- (vs. No DT: stride: p=0.10 and sway: p=0.90) and P5-PC-DTR mice and controls (Two-way ANOVA, F(2,133)=73.45, p=0.0001, n ≥ 9). Significant post hoc comparisons are shown.

Figure 4.

Figure 4—figure supplement 1. PC numbers are reduced upon PC ablation at P5 in PC-DTR mice.

Figure 4—figure supplement 1.

(A) Schematic representation of the experimental plan. (B-I). IF analysis of PCs upon ablation at P5 (F, G, H, I) reveals lack of full recovery of PC numbers in mouse mice. (J-K) Analysis of apoptosis by TUNEL reveals TUNEL+ TdT cells (arrows) in the PCL of P5-PC-DTR mice (K) but not is No DT mice (J) at P8. (L-Q) Higher magnification of PCs from P8, P12 and P30 P5-PC-DTR animals and No DT controls reveal that P5-PC-DTR mice have disrupted PC morphology at P8 and P12. Arrows show PCs. Arrowheads indicate ectopic PCs at P30. (R) Quantification of CALB1+ cells shows that PC numbers do not recover in most animals from ablation of PCs at P5 (Two-way ANOVA, F(1,24)=77.85, p=0.0001, n ≥ 3). (S) Quantification of the number of TdT+ cells, shows a large variation in recombination efficiency in No DT brains, and an initial decrease in TdT+ cells after DT injection at P5 (Two-way ANOVA, F(1,21)=40.17, p=0.0001, n ≥ 3). At P30, P5-PC-DTR brains show a decrease in the number of TdT+ cells compared to No DT animals (t-test, p=0.03, n ≥ 4), similar to P1-PC-DTR animals (Figure 1q). Significant post hoc comparisons are shown. EGL: External granule layer, PCL: Purkinje cell layer. Scale bars: a-k: 100 μm, l-q: 50 μm.
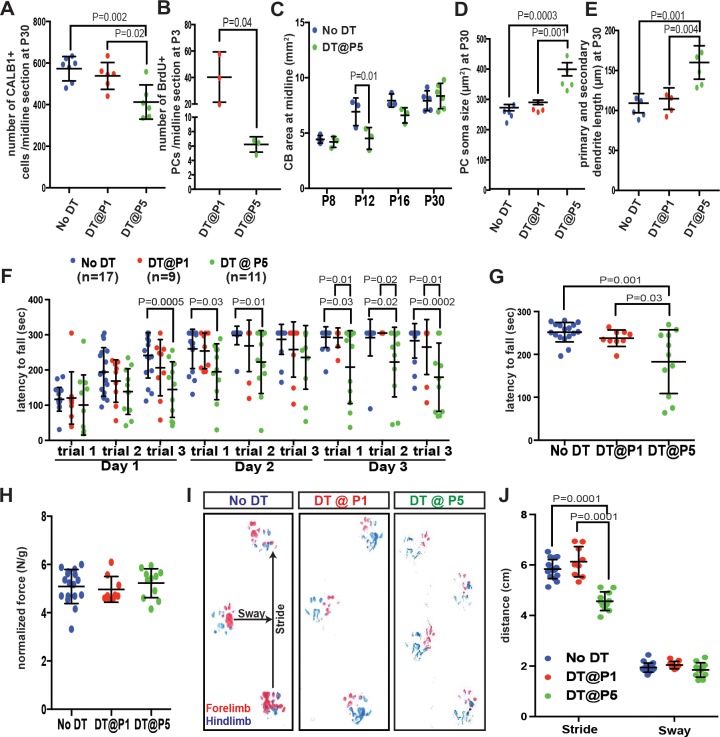
Figure 4—figure supplement 2. Distribution of BrdU+ PCs in P5-PC-DTR mice at 15 hr and 2 days post injection of DT.

Figure 4—figure supplement 2.

(A) Schematic showing the different zones of the CB in a P5 sagittal midline section. (B-C) Distribution of BrdU+ PCs across different zones analyzed 15 hr (B) and 2 days (C) after DT injection in P5-PC-DTR animals reveals that incorporation of BrdU is limited, and most of the cells reside in the central and the nodular zones (n = 3/ condition). No BrdU incorporation was detected in No DT mice at the same ages.

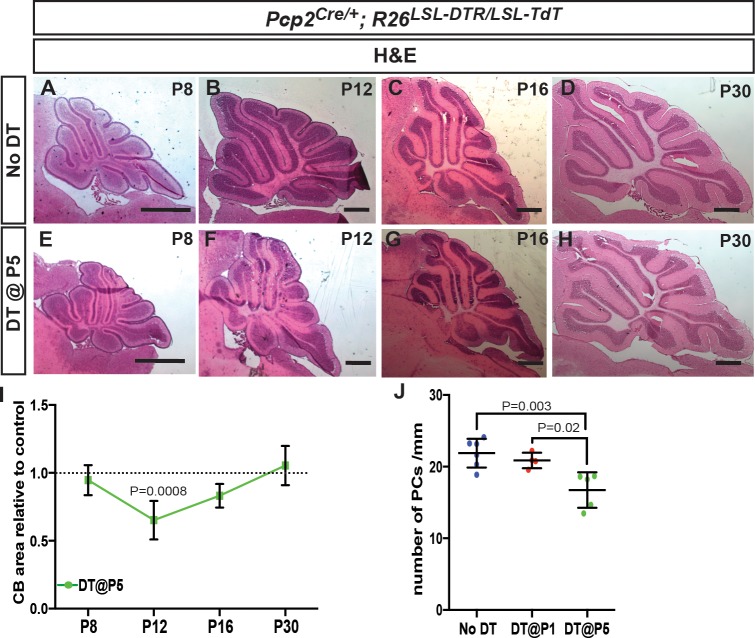
Figure 4—figure supplement 3. Transient decrease in CB size and altered PC morphology after ablation of PCs at P5.

Figure 4—figure supplement 3.

(A-H) H and E staining shows that the area of the CB (sagittal sections) is reduced at P12 after DT injection in P5-PC-DTR mice compared to No DT (F compared to B), but no significant difference in area is seen at P16 and P30. (I) Quantification of CB area in midline sagittal sections demonstrates that CB size is smaller only at P12 (Two-way ANOVA, F(1,22)=7.799, p=0.01, n ≥ 3). (J) The density of PCs is reduced at P30 in P5-PC-DTR but not in P1-PC-DTR animals, correlating with poor recovery of PC numbers in P5-PC-DTR mice (One-way ANOVA, F(2,12)=9.687, p=0.003, n ≥ 4). Significant post hoc comparisons are shown. Scale bars: 500 μm.
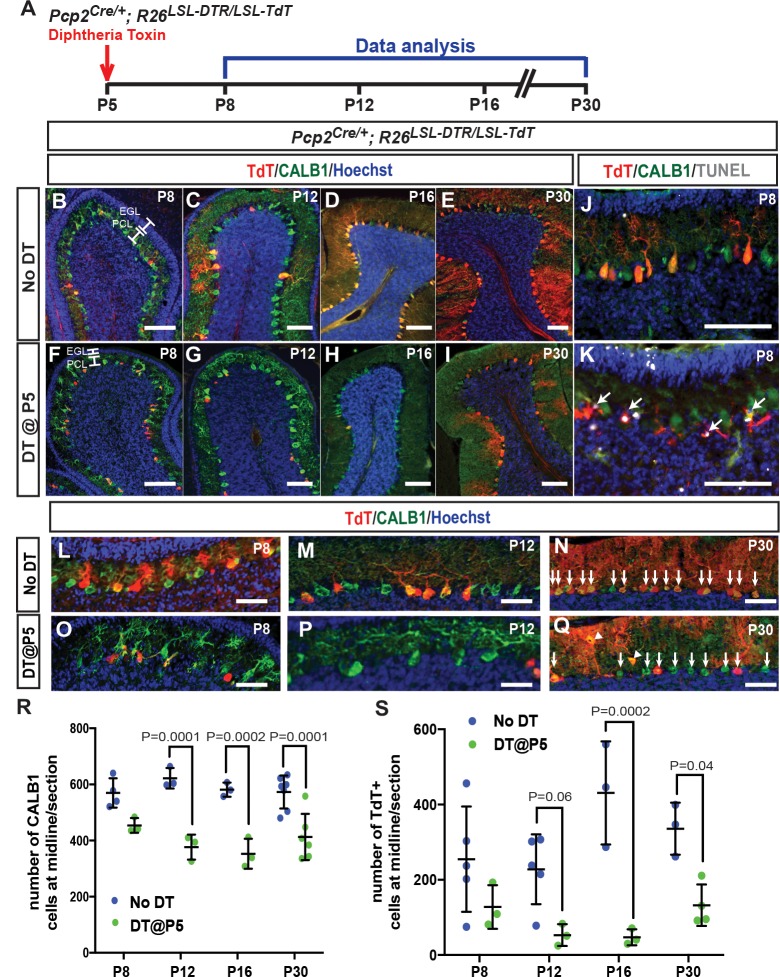
Figure 4—figure supplement 4. Transient decrease in external granule cell layer thickness after DT injection at P5.

Figure 4—figure supplement 4.

(A-D) IF analysis of Ki67 (outer EGL, oEGL) and p27 (inner EGL, iEGL) in No DT (A, C) and P5-PC-DTR (B, D) mice. (E) Quantification shows that both the oEGL and iEGL thicknesses (area/length) are significantly reduced at P8 (Two-tailed t-test, p=0.05, n = 3), but not at P12 in P5-PC-DTR mice. (F) Likely as a consequence of the thinner EGL at P8 in in P5-PC-DTR mice, granule cell density in the internal granule cell layer (IGL) is reduced in P5-PC-DTR animals, but not in No DT and P1-PC-DTR animals at P30 (One-way ANOVA, F(2,12)=15.73, p=0.0004, n ≥ 4). Significant post hoc comparisons are shown. Scale bars: 100 μm.

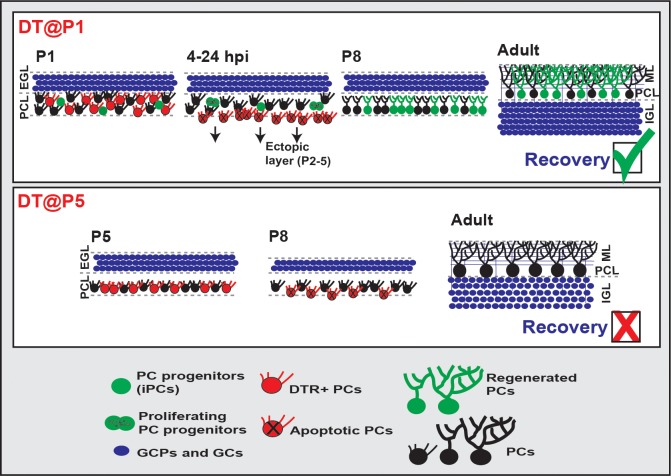
Figure 4—figure supplement 5. Graphical summary of the findings.

Figure 4—figure supplement 5.

iPCs: CALB1 negative/low and FoxP2-expressing progenitors that are immature PCs, EGL: external granule cell layer, PCL: Purkinje cell layer, ML: Molecular Layer, GCP: granule cell progenitors, GC: granule cells.