

Abstract
Oncogenic alterations in the RAS-RAF-MEK-ERK pathway drive the growth of a wide spectrum of cancers. While BRAF and MEK inhibitors are efficacious against BRAFV600E-driven cancers, effective targeted therapies are lacking for most cancers driven by other pathway alterations, including non-V600E oncogenic BRAF, RAS GTPase-activating protein (GAP) NF1 (neurofibromin 1) loss and oncogenic KRAS. Here, we show that targeting the PTPN11/SHP2 phosphatase with RMC-4550, a small molecule allosteric inhibitor, is effective in human cancer models bearing RAS-GTP dependent oncogenic BRAF (e.g. class 3 BRAF mutants), NF1 loss or nucleotide-cycling oncogenic RAS (e.g. KRASG12C). SHP2 inhibitor treatment decreases oncogenic RAS-RAF-MEK-ERK signaling and cancer growth by disrupting SOS1-mediated RAS-GTP loading. Our findings illuminate a critical function for SHP2 in promoting oncogenic RAS/MAPK pathway activation in cancers with RAS-GTP dependent oncogenic BRAF, NF1 loss and nucleotide-cycling oncogenic KRAS. SHP2 inhibition is a promising molecular therapeutic strategy for patients with cancers bearing these oncogenic drivers.
Keywords: PTPN11, BRAF, NF1, KRAS, G12C, lung cancer, RMC-4550
INTRODUCTION.
Oncogenic activation of the RAS/MAPK signaling pathway occurs across a wide spectrum of tumor types1. Tumor-driving hyperactivation of RAS/MAPK signaling arises via disruption of the RAS guanine nucleotide exchange cycle and its regulation by RAS guanine nucleotide exchange factors (GEFs) and GTPase activating proteins (GAPs), which control the levels of active GTP-bound RAS in cells2. Among the tumor types with widespread hyperactivation of RAS/MAPK signaling is non-small cell lung cancer (NSCLC), in which oncogenic RAS/MAPK pathway activation is caused by mutations in KRAS or in upstream or downstream components of the pathway such as receptor tyrosine kinases (RTKs) or BRAF3. Inactivation of the tumor suppressor gene neurofibromin 1 (NF1), which encodes a RAS GAP, is an additional mechanism driving dysregulated RAS signaling in multiple tumor types, including approximately 10% of NSCLCs4, 5. Despite extensive clinical evaluation of RAF and MEK inhibitors across multiple tumor histologies harboring oncogenic mutations in RAS or RAF6, only tumors driven by BRAFV600 mutations have shown consistent clinical responses7. Identifying new therapeutic strategies to block RAS/MAPK pathway signaling and growth in tumors with oncogenic activation of the pathway is of paramount importance.
A commonly accepted paradigm is that proteins with driver mutations in the RAS/MAPK pathway are constitutively active and function independently of normal upstream regulation. This is exemplified by the BRAFV600E oncoprotein, which signals as a monomer in a RAS-GTP independent fashion. However, the recently described class 3 mutants of BRAF do not directly hyperactive BRAF kinase activity and instead promote RAF hetero-dimerization and signaling in a RAS-GTP dependent manner and therefore require upstream signals to drive aberrant cell growth8, 9. In addition, recent studies have demonstrated that some oncogenic mutant allelotypes of KRAS, like G12C, undergo active cycling between GTP- and GDP-bound states and therefore remain sensitive to modulation by upstream pathway components10–12. These oncogenic variants appear to amplify physiologic growth signals rather than drive signaling autonomously.
SHP2 (PTPN11) is a non-receptor protein tyrosine phosphatase and scaffold protein that functions downstream of multiple RTKs, integrating growth factor signals to promote RAS activation13. Autosomal dominant activating mutations in PTPN11 fuel excess RAS/MAPK signaling that drives certain human RASopathies and cancers14, 15. Genetic knockdown or pharmacological inhibition of SHP2 suppresses RAS/MAPK signaling and has been shown to limit the proliferation of cancer cells dependent upon a range of activated RTKs16.
Here, we describe a potent and selective SHP2 allosteric inhibitor, RMC-4550, and use this inhibitor to test the hypothesis that SHP2 is required for RAS activation and proliferation in cancers that are driven by RAS/MAPK pathway oncogenic mutants (beyond RTK alterations) that retain dependence on RAS nucleotide cycling for their oncogenic phenotype(s).
RESULTS
RMC-4550 is a potent and selective SHP2 allosteric inhibitor.
RMC-4550 was identified through a biochemical and cellular screen of compounds and a subsequent structure-guided medicinal chemistry campaign to optimize potency, selectivity, and drug-like properties (Fig. 1a). RMC-4550 is an allosteric inhibitor of SHP2 and stabilizes the auto-inhibited conformation of wild-type SHP2 enzyme17, with a mode of inhibition similar to that described previously for SHP09916, 18. Consistent with an allosteric mode of inhibition, RMC-4550 inhibited the activity of full-length wild-type SHP2 enzyme activated by a di-phosphotyrosine peptide, but lacked activity against the free catalytic domain of SHP2 (Fig. 1b). In addition, the potency of RMC-4550 was significantly reduced in the setting of the hyperactive mutant SHP2E76K or an established allosteric binding site mutant, SHP2T253M/Q257L 16 (Fig. 1c). RMC-4550 potently inhibited pERK levels driven by the oncogenic EGFRexon19deletion in PC9 cells, and by EGF stimulation in HEK293 cells (Fig. 1d,e). In the isogenic HEK293 system, inhibition of pERK levels by RMC-4550 was rescued by expression of either SHP2E76K or the allosteric binding site mutant, establishing an on-target effect of the drug against SHP2 (Fig. 1e). In addition, RMC-4550 was highly selective for full-length SHP2 over other phosphatase, kinase, and safety pharmacology targets (Tables S1–3).
Figure 1. RMC-4550 is a potent, selective, allosteric inhibitor of SHP2.
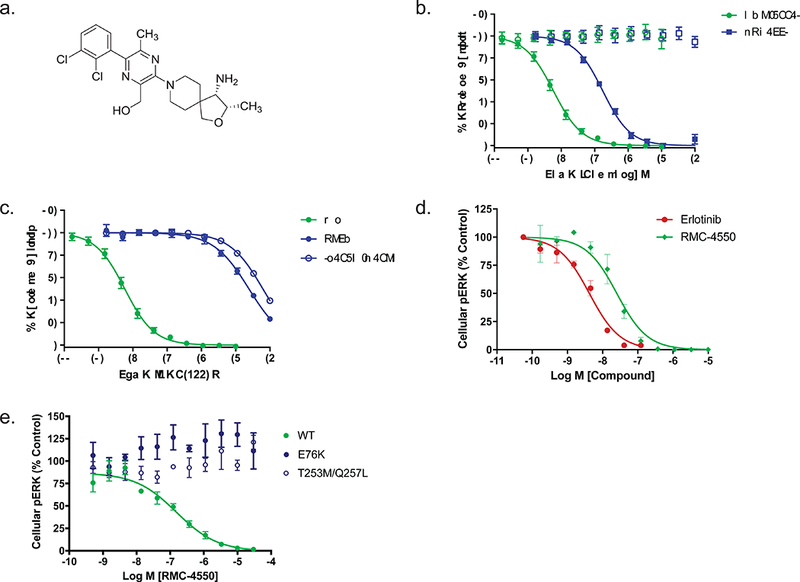
(a) Structure of RMC-4550. (b) Effect of RMC-4550 and SHP099 on enzyme activity of SHP2 full length or SHP2 catalytic domain. Purified full-length SHP2 was incubated with di-phosphotyrosine peptide and inhibitor for 30 min prior to determining the initial rate of substrate (DiFMUP) hydrolysis. Assay conditions for SHP2 catalytic domain were identical but omitted peptide. RMC-4550 and SHP099 produced a concentration-dependent reduction in activity of full-length SHP2 but had no effect on the catalytic domain up to the maximum test concentrations of 3 μM (RMC-4550) and 10 μM (SHP099). Geometric mean IC50 values for RMC-4550 and SHP099 were 0.583 nM and 53.7 nM (RMC-4550 n = 8 independent experiments SHP099 n = 6 independent experiments; figures show mean +/− S.D.) (c) Effect of RMC-4550 on wild-type, full-length SHP2, SHP2E76K, or SHP2T253M/Q257L. The phosphatase activity of all enzymes was assayed as described in (b). RMC-4550 produced a concentration-dependent reduction in activity of wild type SHP2 but had greatly reduced effect in E76K or T253M/Q257L mutants (SHP2WT n = 8, SHP2E76K n = 3, SHP2T253M/Q257L n = 3; figures show mean +/− S.D.) independent experiments (d) PC9 cells were grown in 2D culture and incubated with increasing concentrations of RMC-4550 or erlotinib for one hour prior to determining pERK levels. RMC-4550 produced a concentration-dependent reduction in pERK with a geometric mean IC50 value of 31 nM (n = 4 independent experiments; figures show mean +/− S.D.) e) Effect of RMC-4550 on HEK293 cells expressing wild type SHP2, SHP2E76K, or SHP2T253M/Q257L. Isogenic HEK293 cell lines expressing each SHP2 variant were incubated with RMC-4550 for 1 hour, stimulated with EGF for 5 minutes, lysed, and the levels of pERK were determined. RMC-4550 produced a concentration-dependent reduction in the level of pERK in cells expressing wild-type SHP2 with a geometric mean IC50 value of 49.2 nM (n = 4 independent experiments; figures show mean +/− S.D.) No inhibitory activity was observed in cells expressing E76K or T253M/Q257L mutants up to the maximum test concentration of 10 μM. Source data is provided in Supplementary Table 9.
Class 3 BRAF mutant cell lines are sensitive to SHP2 inhibition.
To determine whether specific driver mutations in proteins downstream of SHP2 in the RAS/MAPK pathway are sensitive to SHP2-dependent regulation of RAS-GTP levels, we screened a collection of cancer cell lines carrying diverse oncogenic mutations. BRAF is a serine/threonine kinase that is frequently mutated in human cancers. There are at least three classes of oncogenic BRAF mutations that each differ in the mechanism by which they drive pERK signaling. Class 1 mutations occur at V600 and result in constitutively active monomers of BRAF that decouple BRAF from RAS-GTP activity19. Class 2 mutations preserve BRAF’s dependence on dimerization, but also decouple dimer-dependent signaling from RAS-GTP levels20. We predicted that cancer cell lines driven by either class 1 or class 2 mutations in BRAF would be insensitive to SHP2 inhibition. In contrast, the recently-described class 3 mutations of BRAF maintain RAF dimer and RAS-GTP dependence to drive pERK signaling9. In light of their dependence on RAS-GTP, we hypothesized that class 3 mutations of BRAF would be responsive to suppression of RAS-GTP levels by SHP2 inhibition. To test these predictions, we screened a representative panel of cell lines bearing oncogenic BRAF mutations across these three classes for sensitivity to SHP2 inhibition.
We confirmed that class 1 and 2 BRAF mutations are refractory to SHP2 inhibition (Fig. 2a-c). Consistent with the mechanistic framework described above, we observed that RMC-4550 did not inhibit pERK levels or proliferation in BRAFV600E mutant A-375 cells. Similar results were observed in the NCI-H1755 (lung, BRAFG469A) cell line carrying a class 2 BRAF mutation (G469A), which exhibits RAS-independent homodimer formation and signaling20. Notably, RMC-4550 did not inhibit RAS-GTP levels in these cell lines. Class 1 and class 2 BRAF mutant oncoproteins function downstream of RAS but drive strong, ERK-dependent negative feedback that, through mechanisms upstream of RAS, leads to suppression of RAS-GTP21. Any residual activation of RAS that occurs in the presence of such negative feedback may either be insensitive to SHP2 inhibition, for example if suppression has occurred via direct inhibition of SOS122, 23, or below the level of detection for our RAS-GTP assay (Supplementary Fig. 1).
Figure 2. SHP2 inhibition suppresses growth and RAS/MAPK signaling in cancer cell lines with class 3 BRAF mutations.
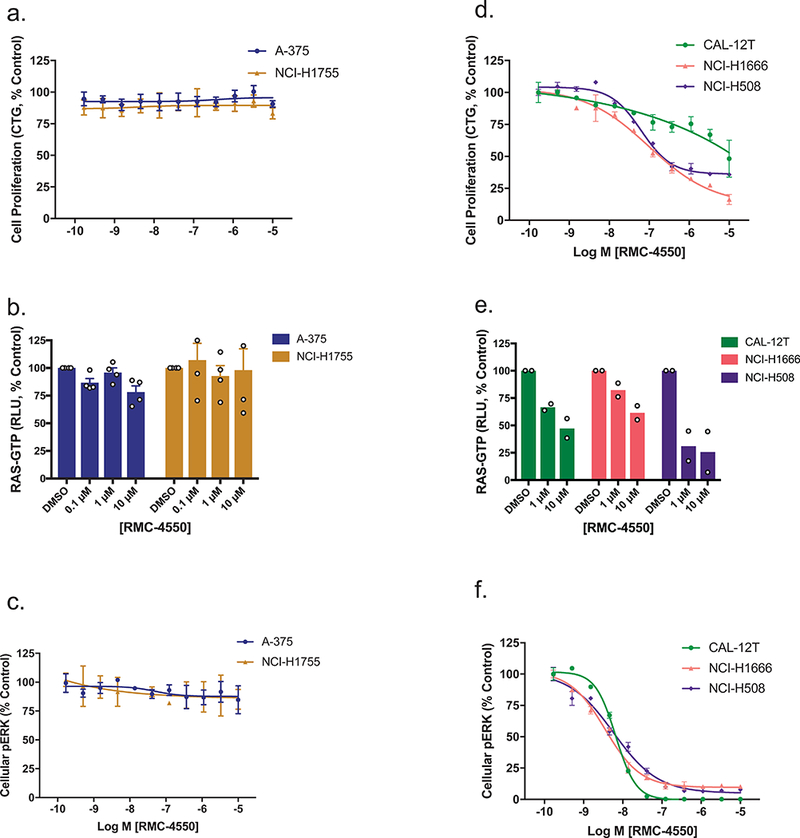
(a) Effect of RMC-4550 on proliferation of class 1 (A-375, BRAFV600E) and class 2 (NCI-H1755, BRAFG469A) BRAF mutant cell lines in 3D culture. Data represent 4 independent experiments each performed in technical duplicate. Figure shows mean +/− S.D. b) and c) A-375 and NCI-H1755 cells were grown in 2D culture and incubated with increasing concentrations of RMC-4550 for one hour. Cellular lysates were prepared and levels of RAS-GTP (b) and pERK (c) determined. RMC-4550 had no effect on cellular RAS-GTP or pERK levels in either cell line up to the maximal test concentration of 10 μM. RAS-GTP data show mean +/− S.E.M. of n = 4 independent biological experiments. pERK data are representative of n = 4 independent biological experiments each performed in duplicate; figures show mean +/− S.D. d) Effect of RMC-4550 on proliferation of three class 3 BRAF mutant cell lines (CAL-12T, BRAFG466V/+; NCI-H1666, BRAFG466V/+, NCI-H508, BRAFG596R/+) in 3D culture. RMC-4550 exhibited geometric mean IC50 values of >10 μM, 304 nM, and 19 nM, respectively, for growth inhibition in CAL-12T, NCI-H1666, and NCI-H508 cells (data are representative of n=4 independent biological experiments each performed in duplicate; figures show mean +/− S.D.) e) and f) CAL-12T, NCI-H1666, and NCI-H508 cells were grown in 2D culture and incubated with increasing concentrations of RMC-4550 for one hour. Cellular lysates were prepared and levels of RAS-GTP (e) and pERK (f) determined. RAS-GTP levels in CAL-12T, NCI-H1666, and NCI-H508 cells were inhibited in a concentration-dependent manner by RMC-4550. RMC-4550 produced a concentration-dependent reduction in pERK levels in CAL-12T, NCI-H1666, and H508 cells with geometric mean IC50 values of 7 nM, 6 nM, and 4 nM respectively (n = 2 biologically independent observations for RAS-GTP, and n = 4 biologically independent experiments for pERK, in duplicate; figures show mean +/− S.E.M. for RAS-GTP and mean +/− S.D. for pERK.) Source data is provided in Supplementary Table 9.
In contrast, treatment with RMC-4550 led to suppression of both RAS-GTP and pERK levels in three cell lines carrying class 3 BRAF mutations, NCI-H1666 (BRAFG466V/+), NCI-H508 (BRAFG596R/+) and CAL-12T (BRAFG466V/+) (Fig. 2e,f). In NCI-H1666 and NCI-H508 cells, pathway suppression translated to inhibition of cellular proliferation, while a disconnect was observed in CAL-12T, suggesting the potential presence of additional molecular alterations driving parallel growth and survival pathways in this cell line (Fig. 2d). Consistent with the results obtained in the isogenic HEK293 system, expression of the hyperactive variant SHP2E76K was sufficient to rescue NCI-H508 cells from RMC-4550 (Supplementary Fig. 2a,b). These results are consistent with recent reports that class 3 BRAF mutations are bona fide cancer driver alterations that remain sensitive to modulation of upstream signaling and RAS-GTP levels8, 9. Therefore, while class 1 and 2 BRAF mutations confer resistance to SHP2 inhibition, class 3 BRAF mutations are RAS/MAPK pathway oncoproteins that can be targeted through upstream blockade of RAS-GTP loading via SHP2 inhibition.
Loss of the tumor suppressor NF1 confers sensitivity to SHP2 inhibition.
NF1 is a tumor suppressor and a RAS GAP. Loss of NF1 function has been shown to increase RAS-GTP levels, hyperactivate RAS/MAPK signaling, and contribute to a variety of human cancers4, 5, 24. Because the increase in RAS-GTP levels is due to loss of RAS GAP function25 and wild-type RAS retains intrinsic, NF1-independent, GTPase activity26, we hypothesized that inhibition of RAS-GTP loading would offset the loss of RAS GAP activity and inhibit RAS-mediated downstream oncogenic signaling. Therefore, we tested whether NF1LOF cell lines were sensitive to SHP2 inhibition.
Consistent with our hypothesis, proliferation of 5/8 NF1LOF cell lines exhibited sensitivity to RMC-4550 (Fig. 3a, Supplementary Table 4). Treatment of the sensitive NF1LOF cell lines NCI-H1838 (lung, NF1N184fs) and MeWo (melanoma, NF1Q1336*) with RMC-4550 led to downregulation of RAS-GTP levels and suppression of pERK (Fig. 3b,c), demonstrating that SHP2 inhibition can attenuate the accumulation of RAS-GTP, and consequent RAS/MAPK pathway activation resulting from NF1 loss. Expression of SHP2E76K rescued NCI-H1838 cells from RMC-4550, supporting an on-target effect (Supplementary Fig. 2c,d). Corroborating these observations, shRNA knockdown of NF1 in BEAS-2B non-malignant bronchial epithelial cells resulted in accumulation of RAS-GTP that was attenuated by treatment with RMC-4550 (Supplementary Fig. 3a). Collectively, these data indicate that loss of NF1 is a second class of oncogenic mutation that can be targeted through suppression of RAS-GTP loading via SHP2 inhibition.
Figure 3. SHP2 inhibition suppresses growth and RAS/MAPK signaling in cancer cell lines driven by NF1LOF mutation.
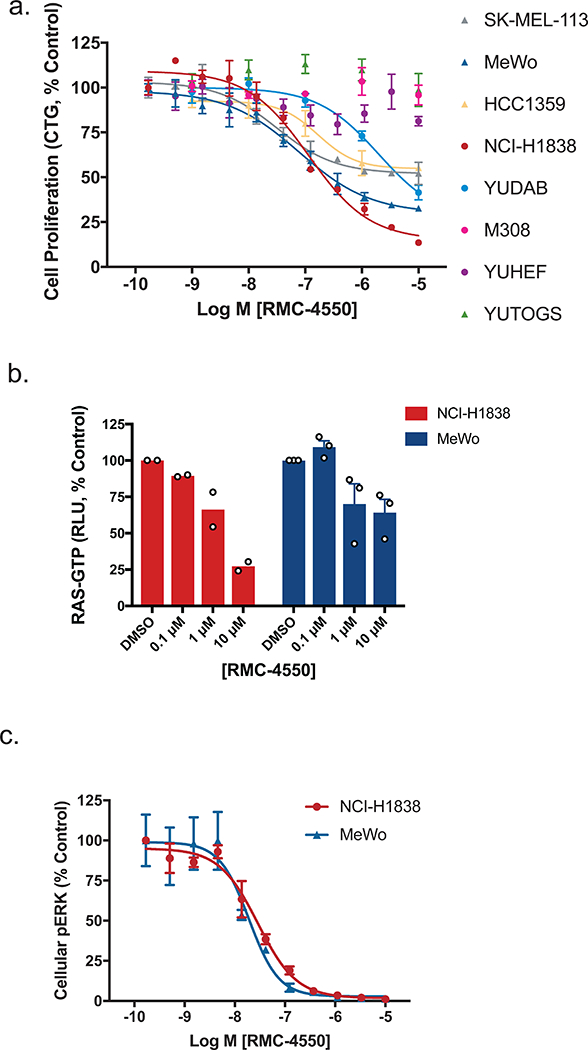
(a) Effect of RMC-4550 on proliferation of NF1LOF cells in 3D culture. One day after seeding cells were treated with RMC-4550 and cell viability measured on Day 7 using CTG. Figure shows mean +/− S.D.; n = 3 independent experiments performed in technical duplicate. (b) and (c) NCI-H1838 and MeWo NF1LOF cells were grown in 2D culture and incubated with increasing concentrations of RMC-4550 for one hour. Cellular lysates were prepared and levels of RAS-GTP (b) and pERK (c) determined. RAS-GTP levels in NCI-H1838 and MeWo cells were inhibited in a concentration-dependent manner by RMC-4550 (n = 2 independent experiments for MeWo and n = 3 independent experiments for NCI-H1838; figures show mean +/− S.E.M.) The geometric mean IC50 value for reduction in pERK was 29 nM in NCI-H1838 cells, and 24 nM in MeWo cells (data representative of n = 4 biologically independent observations, each performed in technical duplicate; figures show mean +/− S.D.) Source data is provided in Supplementary Table 9.
No effect of SHP2 inhibition was observed in YUHEF (NF1Q853*/FS-indel), YUTOGS (NF1L446F/K2535*), or M308 (NF1Q1070*) melanoma cell lines. The genomic landscape of these lines mirrors that of clinical melanoma populations, in that NF1LOF mutations frequently occur in cancers that also contain mutations in other RAS/MAPK pathway genes, some of which may confer resistance to SHP2 inhibition 4, 24. Specifically, M308 cells carry a BRAFV600E mutation, which we observe to drive resistance to SHP2 inhibition. YUTOGS cells lack other known activating mutations in the pathway, but carry the melanoma hotspot mutation RAC1P29S, which has been shown to confer resistance to BRAF inhibition 27. YUHEF carries three SOS1 mutations and RAF1P261L, a previously described MAPK pathway-activating Noonan Syndrome mutation 4, 28. The mechanisms of resistance to SHP2 inhibition warrant further investigation in future studies.
Certain KRASG12 mutant oncoproteins are dependent on SHP2 for activation.
Next, we asked whether specific driver mutations in KRAS itself may depend on upstream factors for activation and thus be sensitive to SHP2 inhibition. We screened a panel of thirty-three KRAS-mutant cancer cell lines for sensitivity to RMC-4550 using an in vitro 3D cell proliferation assay, as KRAS-dependence is well known to be more readily revealed in 3D than 2D culture formats12, 29–31 (Supplementary Table 5). Strikingly, cancer cell lines bearing missense mutations in KRAS at G12, but neither G13 nor Q61, exhibited sensitivity to RMC-4550 (GI50 < 2 μM, Supplementary Table 5). The observation that cancer cell lines bearing the G12C mutation were preferentially sensitive to SHP2 inhibition (hypergeometric p-value = 0.0043) extends prior work demonstrating that the sensitivity of KRASG12C cancer cell lines to a selective KRASG12C inhibitor can be modulated by upstream signals that regulate RAS activity10–12. In addition, KRAS G12A mutant cell lines were sensitive to SHP2 inhibition, while cell lines bearing KRAS G12V and G12D mutations exhibited a range of responses. These data suggest that certain cancers bearing other oncogenic KRAS variants, beyond KRASG12C, may also be sensitive to modulation by upstream factors32, 33.
In NCI-H358 (lung, KRASG12C/+) and MIA PaCa-2 (pancreas, KRASG12C/G12C) cell lines, RMC-4550 treatment inhibited cell proliferation, RAS-GTP and pERK levels (Fig. 4a,b, Supplementary Fig. 1). As predicted, expression of the RMC-4550-insensitive variant SHP2E76K was sufficient to rescue both the pERK signaling and growth inhibition caused by RMC-4550 treatment (Supplementary Fig. S2 e,f). To characterize further the cellular effects of RMC-4550, we examined a marker of apoptosis. In NCI-H358 cells, treatment of 3D spheroid cultures with RMC-4550 led to caspase 3/7 activation, indicating a pro-apoptotic effect (Fig. 4c). These results support a model in which SHP2 functions upstream of certain nucleotide-cycling forms of oncogenic KRAS to regulate its activation by promoting or sustaining GTP-loading of RAS. Consistent with this model, genetic knockdown of SHP2 or SOS1 phenocopied RMC-4550 treatment (Supplementary Fig. 3b-d).
Figure 4. SHP2 Inhibition suppresses growth and RAS/MAPK signaling in a range of cancer cell lines driven by KRASG12 mutations.
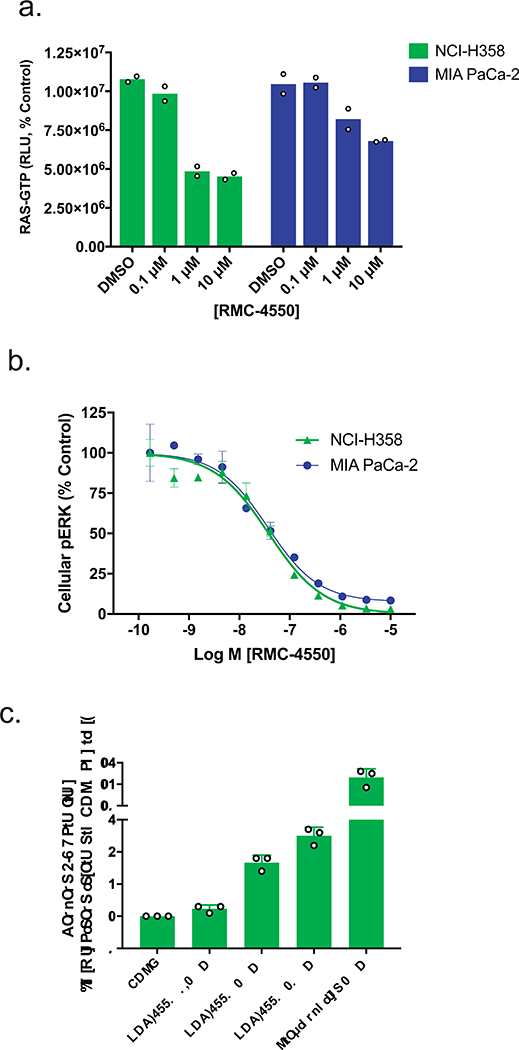
(a) and (b) Representative KRASG12C lines, NCI-H358 and MIA PaCa-2, were grown in 2D culture and incubated with increasing concentrations of RMC-4550 for one hour. Cellular lysates were prepared and levels of RAS-GTP (a) and pERK (b) determined. RMC-4550 produced a concentration-dependent reduction in both cellular RAS-GTP and pERK levels. Geometric mean IC50 values for reduction in pERK in NCI-H358 and MIA PaCa-2 cells were 28 nM and 63 nM respectively (n = 4 independent experiments performed in technical duplicate; figures show mean +/− S.D. for pERK and mean +/− S.E.M. for RAS-GTP). (c) NCI-H358 cells were grown on ULA plates as spheroids. After 5 days in culture, spheroids were treated with RMC-4550 or staurosporine, as a positive control, and assayed for caspase 3/7 activity after 20 hours (n = 3 independent observations; figure shows mean +/− S.D.) Source data is provided in Supplementary Table 9.
The proliferation of two KRASG12C cell lines, NCI-H2122 (lung, KRASG12C/G12C) and Calu-1 (lung, KRASG12C/G12C), was insensitive to SHP2 inhibition. In Calu-1 cells, RMC-4550 suppressed pERK with a potency comparable to that observed in a sensitive cell line (i.e. NCI-H358), confirming inhibition of RAS/MAPK pathway activation by the compound (Supplementary Fig. 3e,f). Comparison of the growth sensitivities of these two lines to the KRASG12C-specific covalent inhibitor ARS-85312 revealed a similar pattern to the SHP2 inhibitor, and a similar disconnect between signaling pathway and growth inhibition (Supplementary Fig. 3g,h). Collectively, these data suggest that the differential sensitivity to growth inhibition across different KRASG12C-bearing cell lines may reflect intrinsic variability in the dependence of each cell line on KRASG12C. Indeed, analysis of KRAS-dependencies derived from Project DRIVE34, 35 revealed a significant correlation between KRAS-dependence and RMC-4550 sensitivity within KRASG12C and KRASG12A mutant cell lines (correlation coefficient = 0.36, Supplementary Fig. 4a). This relationship was not apparent for KRAS mutations outside G12C and G12A, suggesting factors other than KRAS-independence may render cells insensitive to SHP2 inhibition in these genotypes. Analysis of a panel of isogenic RASless MEFs transduced with different KRAS mutations 36 further demonstrated the hypersensitivity of KRASG12C and also revealed sensitivities of KRASG12D and KRASG12V to RMC-4550-induced suppression of RAS-GTP and pERK levels (Supplementary Fig. 4b,c). These data are consistent with the more uniform responses of cancer cell lines bearing KRASG12C mutations to RMC-4550 mediated growth inhibition and the variable responses of cells bearing KRASG12D and KRASG12V mutations. Collectively, these data demonstrate that certain oncogenic G12 variants of KRAS remain dependent on SHP2-mediated GTP-loading to promote downstream signaling and cell proliferation.
RMC-4550 inhibits RAS activation through disruption of key protein interactions.
In light of our findings that SHP2 inhibition can be used to target distinct classes of RAS/MAPK pathway oncoproteins that remain dependent upon RAS GTP loading, we tested whether SHP2-dependent modulation of RAS-GTP levels was due to disruption of core RAS-regulatory processes. First, we mined data from Project DRIVE35, in which thousands of genes were systematically depleted across hundreds of cell lines to study genetic dependencies of molecularly defined cancer cell lines. Using a hypothesis-driven approach, we obtained data for twenty-three genes involved in RTK/RAS/MAPK signaling and calculated a correlation matrix (Fig. 5a). Two functional modules were readily apparent – the MAPK signal relay downstream of activated RAS and the RTK/convergent node module upstream of activated RAS. Furthermore, the most closely correlated knockdowns to PTPN11 (SHP2) are loss of the GEF protein SOS1 (correlation coefficient = 0.51) and of the adaptor protein GRB2, which links RTKs to SOS1-mediated GTP-loading of RAS (correlation coefficient =0.40). In fact, SOS1 and GRB2 are the most closely related gene knockdowns to PTPN11 across all 7,837 genes in the Project DRIVE dataset34. Consistent with previous work, this analysis suggested that SHP2 is an essential member of a core RAS-regulatory module containing SOS1 and GRB2. Therefore, RMC-4550 may downregulate RAS-GTP by disrupting the SHP2/GRB2/SOS1 module that is required for GTP-loading of RAS37, 38.
Figure 5. Mechanism of action of SHP2 inhibition is dependent on SOS1.
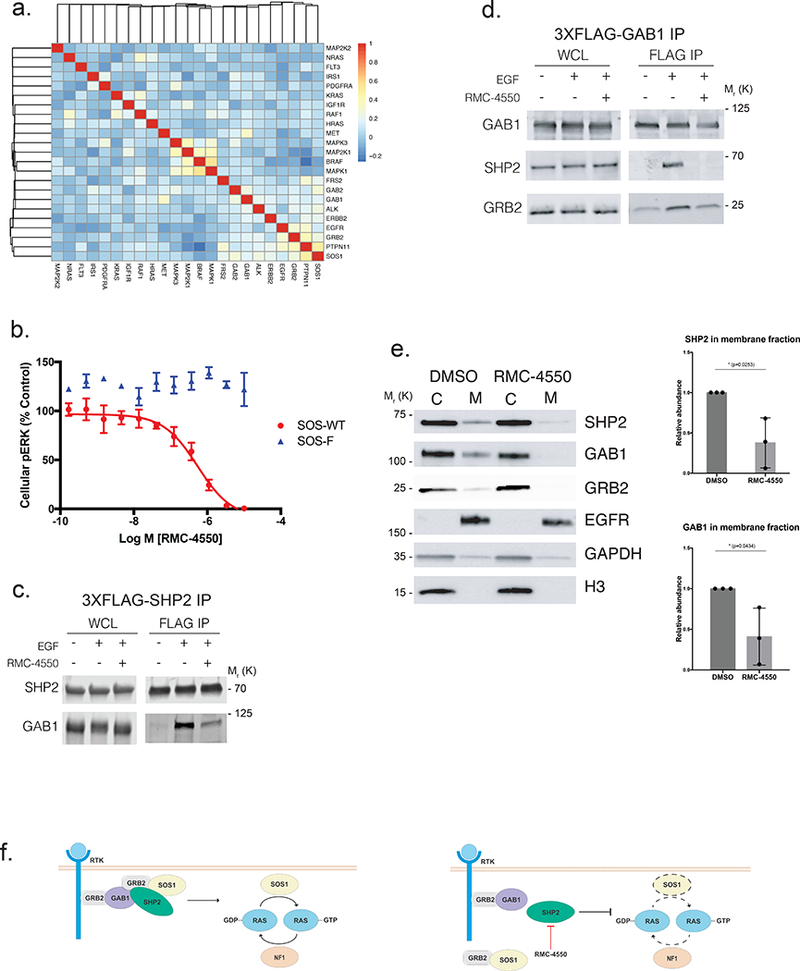
(a) Pearson correlation analysis of the cellular effects of genetic knockdown of signaling molecules in the RTK/RAS/MAPK pathway across 370 cell lines in Project DRIVE. Knockdown of PTPN11 (SHP2) is most closely correlated with SOS1 (correlation coefficient 0.51) and GRB2 (correlation coefficient 0.4). b) Effect of RMC-4550 on cellular pERK in HEK293 expressing SOS-WT (wild type) or SOS-F, a SOS1 mutant that targets SOS protein constitutively to the plasma membrane. Expression of SOS-WT and SOS-F was induced with doxycycline for 24 hours. Cells were incubated for 1 hour with RMC-4550 and stimulated with EGF (50 ng/mL) for the final five minutes of drug treatment. Cellular lysates were prepared for determination of pERK. RMC-4550 produced a concentration-dependent reduction in pERK levels in cells expressing SOS-WT but not SOS-F, geometric mean IC50 = 1.0 μM (n = 3 biologically independent experiments, performed in technical duplicate; figures show mean +/− S.D.) In SOS-F expressing cells, no inhibition was observed up to maximal test concentration of 10 μM. (c), (d) Effect of RMC-4550 (10 μM) on the physical association of SHP2 and GAB1 in HEK293 cells. Cells were incubated for 1 hour with RMC-4550 and stimulated with EGF (50 ng/mL) for the final minute of drug treatment prior to immunoprecipitation of (c) 3XFLAG-SHP2 or (d) 3XFLAG-GAB1 with anti-FLAG beads. Figure shows representative results of n = 3 biologically independent experiments. (e) Effect of RMC-4550 on membrane localization of SHP2, GAB1, and GRB2 in HEK293 cells. Cells were incubated for 1 hour with RMC-4550 and stimulated with EGF (50 ng/mL) five minutes prior to harvest. Membrane fractionation was performed by differential lysis and centrifugation of cellular components (C, cytosol and M, membrane Signal intensity was quantified for SHP2 and GAB1 in the membrane fraction, (n = 3 independent biological experiments depicted as normalized intensity for RMC-4550 over DMSO treated control, mean +/− S.D.) (f) Schematic model of the function of SHP2 as a transducer of signals from upstream RTKs to SOS1 for RAS activation. Source data is provided in Supplementary Table 9.
To test this hypothesis, we examined whether a dominant, constitutively-active mutant form of SOS1 could confer resistance to RMC-4550-mediated inhibition of RAS/MAPK signaling. Indeed, in HEK293 cells, inducible expression of SOS-F, an established SOS1 mutant in which the C-terminal region containing a GRB2 binding site is replaced with the HRAS farnesylation motif that targets the protein constitutively to the plasma membrane39, rendered cells insensitive to either EGF stimulation (Supplementary Fig. 4d) or SHP2 inhibition of pERK (Fig. 5b). Expression of SOS-F in NCI-H358 cells also markedly reduced sensitivity to RMC-4550-induced suppression of pERK (Supplementary Fig. 4e). These data show that the effects of SHP2 inhibition can be bypassed by constitutive activation of SOS1 and that SOS1 therefore functions downstream of (or in parallel to) SHP2.
Next, we examined whether RMC-4550 modulated the physical association of SHP2 with other proteins required for RAS activation. We observed by immunoprecipitation experiments that RMC-4550 blunted SHP2’s interaction with the RTK-proximal scaffolding protein GAB1 (Fig. 5c,d), as well as GAB1’s interaction with GRB2 (Fig. 5d). We then tested whether this disruption of these key protein interactions was associated with diminished recruitment of the proteins to the cell membrane, which is necessary for productive GEF-mediated RAS-GTP loading and subsequent downstream pathway signaling40, 41. We observed by cellular membrane fractionation studies that RMC-4550 caused a significant reduction in the levels of SHP2, GAB1, and GRB2 at the cell membrane (Fig. 5e), extending a recent report based on immunofluorescence imaging42. Allosteric inhibition of SHP2 may thus interfere with the formation of a multi-protein complex that is assembled at RTKs located in the cell membrane through disruption of productive binding of SHP2 with adaptor proteins such as GAB1. This effect of SHP2 inhibition interferes with the formation of a productive protein complex that is essential for RAS-GTP loading and activation (Fig. 5f). Our mechanistic insights extend the understanding of how SHP2 interacts with other proteins, such as the GAB1/GRB2/SOS1 complex, that are important regulators of RAS-GTP levels in cells.
SHP2 inhibition by RMC-4550 drives tumor growth inhibition and tumor regressions in vivo.
Building on our in vitro findings, we tested whether the sensitivity to SHP2 inhibition observed in NF1LOF and KRASG12C mutant cell lines was recapitulated in vivo. Daily oral dosing of RMC-4550 resulted in dose-dependent tumor growth inhibition in two NF1LOF-driven cell line-derived xenograft (CDX) models, MeWo and NCI-H1838, with tumor regression observed in the latter (Figure 6a,b). Similarly, we observed dose-dependent anti-tumor activity with daily oral dosing of RMC-4550 in both the KRASG12C NCI-H358 and MIA PaCa-2 xenograft tumor models in immune-deficient mice (Figure 6c,e, Supplementary Tables 6,7), with tumor growth inhibition observed at all doses. To link the observed anti-tumor activity with pharmacodynamic modulation of the RAS/MAPK pathway, we measured the effects of RMC-4550 on pERK levels in tumor lysates in the KRASG12C models. We observed time-dependent suppression of pERK in tumor lysates over a period of 24 hours following a single dose of RMC-4550 in the NCI-H358 xenograft model (Fig. 6d) and in the MIA PaCa-2 model following the final dose of a repeat dose study (Fig. 6f,g). Analysis of pERK inhibition, relative to the plasma concentration of unbound RMC-4550, revealed an in vivo EC50 (49 nM) strikingly similar to that observed in vitro (63 nM) (Fig. 6g).
Figure 6. SHP2 inhibition suppresses tumor growth and RAS/MAPK signaling in xenograft models of NF1LOF and KRASG12C-driven cancer.
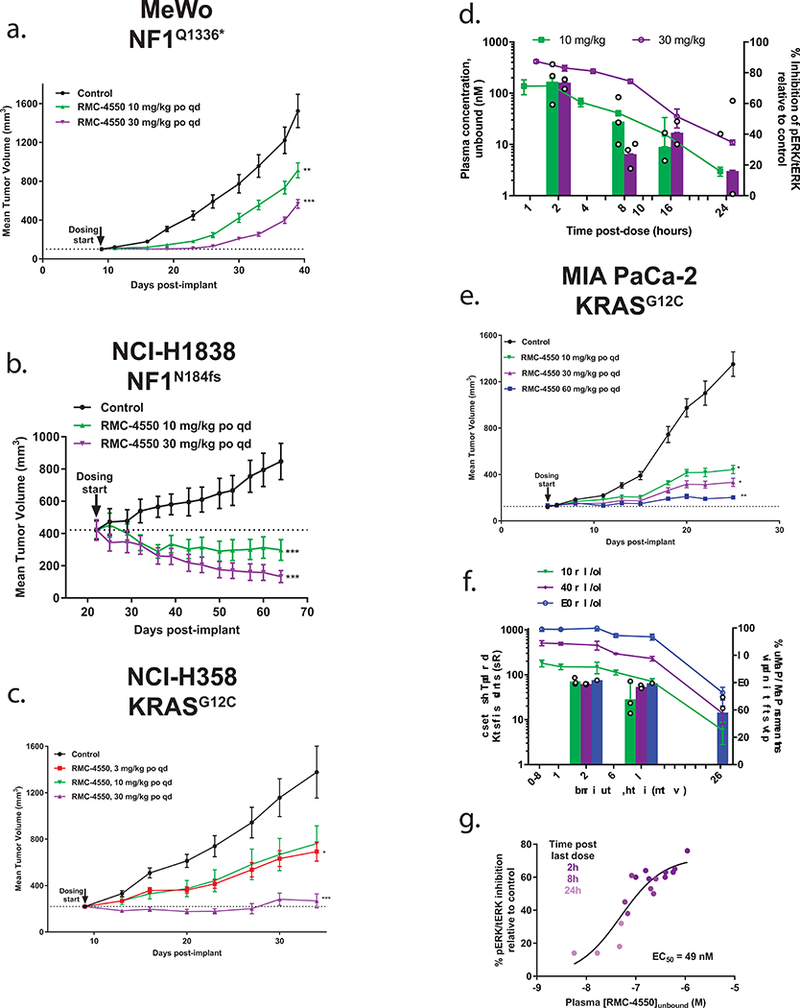
(a) MeWo (n = 10 animals/group) showed tumor growth inhibition (TGI) at 10 mg/kg (43%) and 30 mg/kg (67%) (** p = 0.00955; *** p = 2.1e−4) and b) NCI-H1838 (n = 10 animals/group) showed tumor regression at 10 mg/kg (−29%) and 30 mg/kg (−69%) (*** p = 1.12e−7 for 10 mg/kg; *** p = 2.0e−10 for 30 mg/kg). Dose-dependent efficacy following daily oral administration of RMC-4550 in two KRASG12C tumor xenograft models. (c) NCI-H358 (n = 10 animals/group) showed TGI at 3, 10, and 30 mg/kg (59, 53, 96% respectively) (* p = 0.0416; *** p = 5.2e−5). (d) Pharmacokinetic (left-y-axis) and pharmacodynamic (right y-axis) profile of RMC-4550 in plasma and tumors, respectively, following a single oral dose of 10 and 30 mg/kg in the NCI-H358 model. The plasma profile of RMC-4550 shows dose proportional maximal concentrations and exposure (Table S6) over a period of 24 hours; n = 3 independent samples/time point, figure shows mean +/− S.D. pERK/total ERK ratio in RMC-4550-treated tumors normalized to mean ratio in vehicle-treated tumors (n = 3 independent samples/group). (e) MIA PaCa-2 (n = 12 animals/group) exhibited dose-proportional and significant TGI at 10, 30 and 60 mg/kg (74, 83, 93% respectively) (* p = 0.0436 for 10 mg/kg; * p = 0.0120 for 30 mg/kg; *** p = 0.003). (f) Pharmacokinetic (left-y-axis) and pharmacodynamic (right y-axis) profile of RMC-4550 in plasma and tumors, respectively, following the last dose in MIA PaCa-2 study shown in (e) over a period of 24 hours. pERK/total ERK ratio in RMC-4550-treated tumors normalized to mean ratio in vehicle-treated tumors (n = 3 independent samples/group). Figure shows mean +/− S.D. (g) Concentration-response relationship from individual animals summarized in data shown in (f) indicates a time- and plasma concentration-dependent suppression of tumor pERK in vivo. Statistical test: ordinary one-way ANOVA with post-hoc Tukey’s test. Figures a-c, and e show mean +/− S.E.M. Source data is provided in Supplementary Table 9.
Consistent with our in vitro observations, daily oral dosing of RMC-4550 (at a dose of 30 mg/kg) in two CDX models of RMC-4550-insensitive KRAS mutations, HCT-116 (KRASG13D, CRC) and CALU-6 (KRASQ61K, NSCLC) failed to induce significant tumor growth inhibition (Supplementary Fig. 5a,b). All doses of RMC-4550 were well tolerated for the duration of each study (Supplementary Figs. 5c,d, 6a-d).
To extend our studies into additional clinically-relevant in vivo models, we evaluated the response to RMC-4550-mediated SHP2 inhibition in patient-derived xenograft (PDX) models. Two PDX models of BRAF mutant NSCLC, LUN023 and LUN037, were tested. LUN023 carries the previously described class 3 mutation BRAFD594N9, while LUN037 carries BRAFN581D, a known class 3 variant position and established RASopathy mutant substitution43. As predicted for this class of semi-autonomous driver of RAS/MAPK signaling, we observed dose-dependent tumor growth inhibition upon repeated daily oral dosing of RMC-4550 in both models (Figure 7a, b). Further, we tested RMC-4550 in three additional PDX models of NSCLC and confirmed NF1LOF and KRASG12C mutations as genotypic biomarkers of sensitivity to SHP2 inhibition in these PDXs, validating our in vitro and in vivo CDX model findings (Figure 7c-e). All doses of RMC-4550 were well tolerated for the duration of each study (Supplementary Fig. 6e-i). In the NF1LOF model, we observed significant suppression of RAS-GTP and tumor necrosis in treated relative to control tumors at study endpoint (Fig. 7f, Supplementary Fig. 7b). While not a head-to-head comparison, we noted that the effects of SHP2 inhibitor treatment we observed here appear to be similar to those observed upon treatment of these same KRASG12C PDX models with the KRASG12C covalent inhibitor ARS-162044.
Figure 7. SHP2 inhibition suppresses tumor growth in patient derived xenograft models of class 3 BRAF, NF1LOF and KRASG12C-driven cancer.
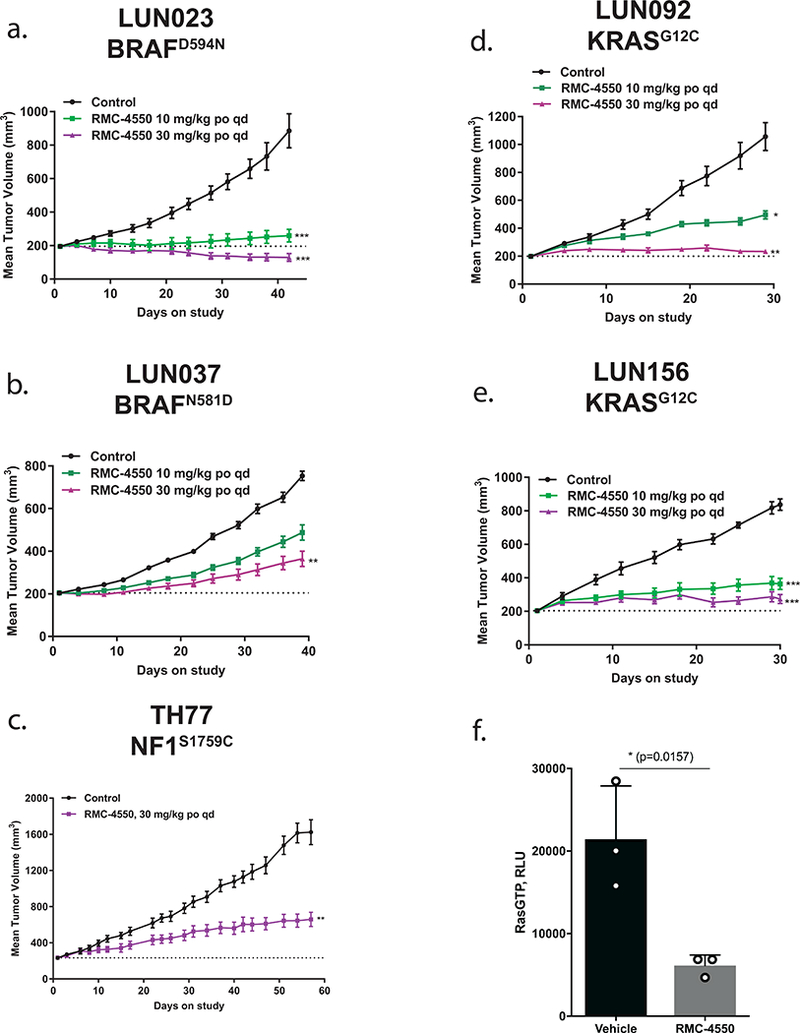
Daily oral administration of RMC-4550 resulted in a dose dependent inhibition of tumor growth in the following PDX models (a) LUN023 (BRAFD594N) at 10 and 30 mg/kg, TGI = 91% and regression = −34%, respectively (*** p = 0.00223 for 10mg/kg; *** p = 3.76e−5 for 30 mg/kg), (b) LUN037 (BRAFN581D) at 10 and 30 mg/kg, TGI = 48% and 71%, respectively (** p = 0.00575), (c) TH77 (NF1S1759C) at 30 mg/kg, TGI = 69% (** p = 0.0050), (d) LUN092 (KRASG12C) at 10 and 30 mg/kg, TGI = 65% and 96%, respectively (* p = 0.0386; ** p = 2.33e−4), and (e) LUN156 (KRASG12C) at 10 and 30 mg/kg, TGI = 75% and 89%, respectively (*** p = 1.03e−3 for 10mg/kg; *** p = 3.75e−6 for 30 mg/kg). Statistical test: ordinary one-way ANOVA with post-hoc Tukey’s test. Figures show mean +/− S.E.M. (f) RAS-GTP levels were assessed by RAS-GTP ELISA in tumor lysates derived from vehicle and RMC-4550 treated animals (n = 3 independent samples each). Durable suppression of RAS-GTP was observed in RMC-4550 treated tumors harvested at endpoint. Data shows mean +/− SD for each individual animal measured across two technical replicates, * p = 0.0157 by unpaired t-test (two-tailed). Source data is provided in Supplementary Table 9.
DISCUSSION
In summary, we report a potent and selective SHP2 allosteric inhibitor, RMC-4550, which we have used to uncover a previously unrecognized dependence of class 3 BRAF, NF1LOF, and KRASG12 mutants on SHP2-mediated upstream signals for cell growth. Our data indicate that these RAS pathway oncoproteins appear to amplify, rather than bypass, the physiologic control mechanisms regulating RAS-GTP levels and pathway output. This paradigm contrasts with the traditional model in which RAS pathway oncoproteins are constitutively active. Instead, our data support an emerging framework in which certain oncoproteins are semi-autonomous, rather than fully-autonomous, cancer drivers.
Our mechanistic findings provide insight into how SHP2 functions to promote RAS/MAPK signaling, cellular proliferation and cancer by coordinating adaptor protein and RAS GEF recruitment to the cell membrane where RTK activation occurs. Our data prompt additional, future investigations to more fully define the role of SHP2 in linking RTK activation to downstream RAS/MAPK pathway activation. These efforts are now enabled by the development of potent and selective allosteric inhibitors of SHP2 such as RMC-4550.
Our findings have immediate translational implications. The particular forms of RAS pathway oncoproteins we study herein occur frequently in NSCLC3, 45 and are currently pharmacologically intractable. Our data suggest SHP2 inhibition as a promising therapeutic strategy in patients with tumors harboring these semi-autonomous, non-RTK oncoproteins.
METHODS
Discovery of RMC-4550
RMC-4550 was identified through evaluation of our collection of methyl-pyrazine compounds. 309 of these compounds are exemplified in published patent application WO2018/013597A1, which contains the relevant structure-activity-relationship information, and listed in the related manuscript file “WO-2018013597_list.xls”. SHP2 inhibition values for exemplary compounds are also provided in the related manuscript file “WO-2018013597_list.xls”. Detailed information about the structure, potency, selectivity, and pharmacokinetic properties of RMC-4550 is provided in Figure 1 and Supplementary Tables 1–3, 6, 7.
Cell Lines and Reagents
Cells were grown in appropriate media and supplemented with 10% fetal bovine serum (Cellgro) and 1% penicillin/streptomycin (Gibco) unless directed otherwise. Cell were maintained at 37°C in a humidified incubator at 5% CO2. For a complete list of cell lines and sources, please see Reporting Summary.
Antibodies
Please see Supplementary Table 8 for a complete list of antibodies.
Spheroid Formation and Proliferation
2500 cells/well were seeded in round bottom ultra-low attachment 96-well plates (Corning) in growth media supplemented with 10% fetal bovine serum and 1% penicillin/streptomycin, and incubated for 72 hours at 37°C in 5% CO2. Spheroid formation was confirmed visually, and spheroids were treated in duplicate with serial 3-fold dilutions of RMC-4550 in complete growth media (final DMSO concentration = 0.1%). Following drug exposure for five days, cell viability in spheroids was determined using the CellTiter-Glo assay kit (Promega), following the manufacturer’s instructions. Luminescence was read in a SpectraMax M5 Plate Reader (Molecular Devices). Assay data was normalized to DMSO values, and EC50 values were determined using a four-parameter concentration-response model in GraphPad Prism 7. Figures show mean +/− standard deviation of duplicate values from representative experiments.
Analysis of ERK1/2 Phosphorylation
ERK1/2 phosphorylation at Thr202/Tyr204 was assayed using the AlphaLISA SureFire Ultra HV pERK Assay Kit (Perkin Elmer). 24 hours prior to the assay, 20,000 cells per well were plated in clear 96-well plates, in biotin-free media supplemented with 10% fetal bovine serum and 1% penicillin/streptomycin, and incubated overnight at 37°C in 5% CO2. One hour prior to treatment with RMC-4550, media was replaced with biotin-free media supplemented with 0.02% bovine serum albumin and 1% penicillin/streptomycin. Cells were incubated at 37°C in 5% CO2 for one hour. Cells were then exposed to serial 3-fold dilutions of RMC-4550 diluted in biotin-free media supplemented with 0.02% bovine serum albumin and 1% penicillin/streptomycin (final DMSO concentration equivalent to 0.1%). Cells were incubated in the presence of RMC-4550 for one hour at 37°C in 5% CO2. Cellular lysates were prepared and pERK levels determined according to the manufacturer’s protocol. Samples were read using an EnVision Multilabel Plate Reader (Perkin Elmer) using standard AlphaLISA settings. Assay data was plotted and EC50 values were determined using four-parameter concentration-response model in GraphPad Prism 7. Data in figures are mean +/− standard deviation of duplicate values from representative experiments.
Analysis of RAS-GTP Levels
Levels of activated RAS-GTPase were determined using the Ras GTPase ELISA Kit (Abcam), similar to a previously published method46. Briefly, 1 × 10⁶ cells were seeded in media supplemented with 10% fetal bovine serum and 1% penicillin/streptomycin in 10 cm tissue culture dishes, and incubated for 48 hours at 37°C in 5% CO2. Cells were then treated with RMC-4550 diluted in media supplemented with 0.02% bovine serum albumin and 1% penicillin/streptomycin to a final DMSO concentration equivalent to 0.1%. Cells were incubated in the presence of RMC-4550 for one hour at 37°C in 5% CO2. Following this exposure period, media was removed and cells were washed once in ice-cold PBS. Cells were immediately lysed in ice-cold 1 × Lysis buffer (25 mM Tris-HCl, pH 7.2, 150 mM NaCl, 5 mM MgCl2, 1% NP-40, 5% glycerol)(Thermo) supplemented with Halt Protease and Phosphatase Inhibitor (EDTA-free)(Thermo), and lysates were cleared by centrifugation at 13,000 rpm for 15 minutes at 4°C. Protein quantification was performed with the BCA Protein Assay Kit (Pierce), and lysates were diluted to a final concentration of 1 mg/mL. Cell lysates were prepared and levels of RAS-GTP determined using a plate-based ELISA as described in manufacturer’s protocol. Data in figures are mean +/− standard deviation of duplicate values from representative experiments.
RAS-mutant Cancer Cell Panel Screen
Cell lines were maintained in growth medium supplemented with 10% fetal bovine serum and 1% penicillin/streptomycin at 37°C, 5% CO2. For each line, two 96-well plates were seeded with 600 cells/well suspended in 0.65% methylcellulose. Plates were incubated at 37°C, 5% CO2. The following day, one of the plates for each line was used to obtain initial (T=0) readings using the CellTiter-Glo (CTG) assay kit (Promega), following the manufacturer’s instructions. Luminescence was read in an EnVision Multilabel Plate Reader (Perkin Elmer). Serial 3-fold dilutions of RMC-4550 were prepared in growth medium supplemented with 10% fetal bovine serum and 1% penicillin/streptomycin (final DMSO concentration = 0.1%) and added to each well. Cells were incubated for seven days, and the number of viable cells was quantitated using the CTG assay, as above. Day 7 (T=7) values for a given RMC-4550 concentration X were individually normalized against T=0 values according to the formula: Normalized value = ((S7[X]-S0)/(S7[DMSO]-S0))*100, where S7 is the CTG signal at T=7, and S0 is the CTG signal at T=0. Normalized data was imported into Prism 7 (GraphPad) software, and IC50 values were calculated by fitting to a four-parameter concentration-response model and determining the RMC-4550 concentration resulting in 50% absolute inhibition.
Activated Caspase 3/7 Assay in Spheroids
H358 cells were grown into spheroids by seeding 5,000 cells/well in round bottom ultra-low attachment 96-well plates (Corning) in RPMI media supplemented with 10% fetal bovine serum and 1% penicillin/streptomycin and incubated at 37°C in 5% CO2 for five days to allow for spheroid formation. Spheroid formation was confirmed visually. Spheroids were treated in triplicate with RMC-4550, staurosporine (Sigma), or DMSO (Sigma) (0.1% final), diluted in RPMI media supplemented with 10% fetal bovine serum and 1% penicillin/streptomycin, and incubated at 37°C in 5% CO2 for 20 hours. Caspase 3/7 activity was measured using the Caspase-Glo 3/7 Assay System (Promega), following the manufacturer’s instructions. Luminescence was read in an EnVision Multilabel Plate Reader (Perkin Elmer).
SHP2 and SOS1 knockdown:
For stable and lenti virally transfected shRNA based knockdown experiments, viruses were generated in HEK293T cells transfected with lentiviral packaging vectors along with vectors expressing pLKO-shSHP2 and pLKO-shSOS1 (MISSION® TRC shRNA) using Fugene6 (Promega). Two distinct hairpins per gene were chosen for the experiments. Below are their sequences-
SHP2–1: CCGGCGTGTTAGGAACGTCAAAGAACTCGAGTTCTTTGACGTTCCTAACACGTTTTT
SHP2–2: CCGGCCCTTGTAAGAAGAAAGGATTCTCGAGAATCCTTTCTTCTTACAAGGGTTTTT
SOS1–1: CCGGGCACTTTATTTGCAGTCAATACTCGAGTATTGACTGCAAATAAAGTGCTTTTTG
SOS1–2: CCGGCCACAGATGTTTGCAGTGTATCTCGAGATACACTGCAAACATCTGTGGTTTTTG
Viral supernatant harvested from confluent monoculture was filtered and used to infect NCI-H358 lung cancer cells. 0.5 × 10⁶ NCI-H358 cells were seeded in one well of a 6-well chamber and allowed to grow for 24 hours. Next day, cells were incubated with a 1:1 mixture of normal growth media and viral supernatant harvested earlier from HEK293T cells, which contains lentiviruses producing shRNAs against SHP2 and SOS1. Polybrene was added at 8μg/ml concentration. This was followed by a plate centrifugation at 3000 rcf for 90 minutes (Sorvall RT7 plus). Subsequently, cells were selected for transduced cells using 1μg/ml puromycin for 48 hours. Sensitivities of the cells to the SHP2 and SOS1 knockdown were determined using crystal violet staining assays via spectrophotometric intensity. Harvested lysates from parallel experiments were probed for knock down efficiency, pERK level using western blot and RAS-GTP level using affinity purification followed by immunoblot.
SHP2WT and SHP2E76K rescue experiments
SHP2WT and SHP2E76K constructs were synthesized(Atum) and stable expression in NCI-H358 (KRASG12C) cells, NCI-H1838 (NF1LOF) cells, and NCI-H508 (Class 3 BRAF) cells was achieved by lentiviral transduction. Cell proliferation of parental and lentiviral-transduced cells was performed as outlined above (Spheroid Formation and Proliferation). For pERK analysis, 5 × 10⁵ cells per well were seeded in 6-well format. Post 24 hours, cells were treated for 90 minutes with DMSO or RMC-4550 (1 μM), respectively. Cell lysates were prepared and analyzed by western blotting using antibodies against pERK, ERK, SHP2, and HSP90 (Cell Signaling Technologies).
Sensitivity analysis in RASless MEFs
Hras−/−, NRas−/−, Kras−/− mouse embryonic fibroblasts (RASless MEFs) were acquired from the NCI RAS Initiative47, namely KRAS-4B WT, G12C, G12D, G12V, and Q61H as well as BRAFV600E expressing cells. For each line and treatment, 4 × 10⁵ cells were seeded per 10 cm dish and treated with DMSO or RMC-4550 (1 μM) for 24 hours. Cell lysates were prepared and RAS-GTP levels were determined by RAS-GTP ELISA (Abcam) or RAF-RBD mediated pull-down using the RAS Pull-down Activation Assay Biochem Kit (Cytoskeleton, Inc.), respectively. Western blot analysis was conducted on pull-down fractions and whole cell lysates using antibodies against RAS (Millipore), pERK (Cell Signaling Technologies), ERK (Cell Signaling Technologies), and Actin (Sigma Aldrich).
Knockdown of NF1 in BEAS-2B cells
Knock-down of NF1 was achieved by lentiviral transduction of BEAS-2B cells with MISSION shRNA (Sigma Aldrich) having the following sequence:
5’- CCGGCCATGTTGTAATGCTGCACTTCTCGAGAAGTGCAGCATTACAACATGGTTTTTG-3’
and being expressed from a pLKO.1-puro plasmid backbone. One day after lentiviral transduction, cells were selected via treatment with 1 μg/mL puromycin for 48 hours. For RAS-GTP analysis, cells were seeded at a density of 1×10⁶ cells per 10 cm dish. One day post seeding, cells were starved in serum-free media for 18 hours and treated with either vehicle (DMSO) or RMC-4550 (1 μM) for 1 hour. Cells were stimulated with 100 ng/mL hEGF (Sigma) for 5 minutes prior to harvest. Cell lysates were prepared and RAS-GTP levels were determined via RAF-RBD mediated pull-down using the RAS Pull-down Activation Assay Biochem Kit (Cytoskeleton, Inc.). Western blot analysis was performed for RAS, pERK, ERK, and HSP90 as outlined previously. For NF1 analysis, SDS-PAGE was performed using 3–8% Tris-Acetate gels and Tris-Acetate running buffer (Novex) prior to western blot analysis using an antibody against NF1 (Santa Cruz Biotechnology).
Gene Depletion Sensitivity Correlation Analysis
Gene signatures were downloaded from the Project Drive data portal (https://oncologynibr.shinyapps.io/drive/)) and assembled into a matrix. Correlation analysis was conducted in R and heatmaps generated with the pheatmap package.
SOS-WT and SOS-F Expression Constructs
N-terminally HA-tagged SOS-WT and SOS-F constructs were synthesized (Atum) and subcloned into the pcDNA5/FRT/TO vector (ThermoFisher) using the following primers:
SOS1-HA-FOR 5’- ACAGGTAAGCTTATGTACCCATACGATGTTCCAGATTAC-3’
SOS1-HA-REV 5’- AGACTAGCGGCCGCTCAGGAAGAATGGGCATTCTCCAA-3’
SOS-F-HA-REV 5’- GATCGAGCGGCCGCTCAGGAGAGCACACACTTGCAG-3’.
SOS-WT and SOS-F plasmids were co-transfected with the pOG44 Flp-recombinase expression vector (ThermoFisher) into the HEK Flp-In T-Rex 293 cell line according to the manufacturer’s protocol. Transfected cells were selected in drug media (200 μg/mL hygromycin B, 15 μg/mL blastidicin) and expression of SOS constructs was verified by western blot (SOS-1: Cell Signaling Technologies # 5890; HA: Sigma 11867423001).
pERK Analysis of HEK293 SOS-WT and SOS-F
30,000 HEK293 cells per well were plated in 2D culture in 96-well plates in Biotin-free RPMI (Hyclone) supplemented with 0.1% fetal bovine serum, 0.02% bovine serum albumin and 1% penicillin/streptomycin. Expression of SOS1 constructs was induced by the addition 0.1 μg/mL doxycycline (Sigma) for 24 hours. Cells were treated with serial 3-fold dilutions of RMC-4550 diluted in biotin-free media supplemented with 0.02% bovine serum albumin and 1% penicillin/streptomycin (final DMSO concentration equivalent to 0.1%) for one hour. For the final 5 minutes of drug treatment, cells were stimulated with 50 ng/mL EGF (Sigma), lysed and subjected to ERK1/2 phosphorylation analysis as described above.
SOS-WT and SOS-F overexpression in NCI-H358 cells
In one well of a 12-well chamber 0.2×10⁶ NCI-H358 cells were seeded and were reverse transfected with SOS-WT and SOS-F plasmids using Fugene6 (Promega). 48-hour post transfection, cells were treated with either vehicle control (DMSO) or RMC-4550 (1μM) for 1 hour or 6 hour. Lysates harvested from these cells were probed for pERK level using western blot.
Immunoprecipitation
HEK293E cells stably expressing SHP2 with an N-terminal 3X FLAG tag were serum starved (0.1% FBS) for 18 hours and treated with either vehicle (DMSO) or RMC-4550 (10 μM) for 1 hour. At the end of the treatment period, cells were treated with hEGF at a concentration of 50 ng/mL (Sigma) for 1 minute. Media was immediately removed and the cells were washed with cold PBS and cold IP lysis buffer (Pierce, 25 mM Tris-HCl pH 7.4, 150 mM NaCl, 1 mM EDTA, 1% NP-40 and 5% glycerol) containing protease and phosphatase inhibitors, as well as DMSO or RMC-4550 (10 μM). Cells were scraped on ice, transferred to a microcentrifuge tube and incubated on ice for 20 minutes. Lysates were centrifuged for 20 min at 4°C and 14,000 rpm. The supernatant was removed and quantified by BCA. Anti-FLAG M2 magnetic beads (Sigma) were washed with TBS, 1 mg of lysate was added, and beads were placed on a rotator at 4°C for 2 hours. Beads were washed with 500 μL lysis buffer three times with 5 min of rotation at 4°C after each wash. Bound proteins were eluted with 2 × 100 μL of 3X FLAG peptide (Sigma) at 150 μg/mL. Whole cell lysates and FLAG elutions were run on a tris-glycine 4–12% gradient gel and analyzed by western blot using antibodies for SHP2 (Cell Signaling Technologies), GAB1 (Bethyl Laboratories), FLAG (Sigma), and β-actin (Cell Signaling Technologies).
Membrane fractionation assay
HEK Flp-In T-Rex 293 cells (ThermoFisher) were seeded at a density of 5×10⁶ cells per 10 cm dish. Post 24 hours, cells were serum-starved (0.1% FBS) for 18 hours and treated with either vehicle (DMSO) or RMC-4550 (1 μM) for 1 hour. Cells were stimulated with 50 ng/mL hEGF (Sigma) for 5 minutes prior to cell lysis, washed once in ice-cold PBS and collected in 1 mL ice-cold PBS by rubber policeman. Cytosolic and membrane fractions were prepared using FractionPREP™ Cell Fractionation kit (BioVision) according to manufacturer’s instructions. Briefly, cells were resuspended in ice-cold Cytosol Extraction Buffer-Mix (CEB-Mix) and incubated on ice for 20 minutes, vortexing every 5 minutes. Lysates were centrifuged at 700 g at 4 °C for 10 minutes and supernatant was collected as cytosolic fraction. Pellets were washed twice in ice-cold CEB-Mix prior to adding ice-cold Membrane-Extraction Buffer A- and B-Mix. Lysates were incubated on ice for one minute and centrifuged at 1000 g at 4 °C for 5 minutes. Supernatant was collected immediately, centrifuged again and transferred to a new tube as membrane fraction. Membrane recruitment of SHP2 (Cell Signaling Technologies), GAB1 (Cell Signaling Technologies) and GRB2 (Cell Signaling Technologies) was analyzed by western blot using indicated antibodies and including analysis of EGFR (membrane marker, Cell Signaling Technologies), GAPDH (cytosol marker, Santa Cruz Biotechnology) and Histone H3 (nuclear marker, Cell Signaling Technologies) as controls for successful membrane fractionation. Signal quantification was done via Fiji image analysis software48.
Purification of SHP2 FL and SHP2 cat Proteins
Constructs for SHP2FL (Met1- Arg593) and SHP2Cat (Phe247-Arg529) were generated by cloning the PTPN11 gene into a modified pET15 plasmid (GeneArt) containing an N-terminal 6x Histidine tag. The constructs were transformed into BL21 (DE3) cells and grown at 37°C in Luria Bertani broth (LB) containing 50 μg/ml ampicillin. At an OD600 = 0.8 cells were transferred at 18°C and expression was induced by the addition of 0.5 mM IPTG. Cells were collected by centrifugation after overnight growth at 18°C.
Cell pellets were resuspended in lysis buffer containing 25 mM Tris-HCl pH 8.0, 300 mM NaCl, 5 mM Imidazole, 1 mM TCEP, 1 μg/ml DNase and Complete EDTA-free protease inhibitors. The solution was incubated at 4°C with stirring for 30 minutes. After the cell pellet was completely suspended the cells were sonicated on ice and centrifuged at 40,000 × g for 45 min. The supernatant was loaded under gravity to a 5ml Ni NTA column equilibrated with 25 mM Tris-HCl pH 8.0, 300 mM NaCl, 5 mM Imidazole and 1 mM TCEP. The column was washed with the above buffer until the absorbance at 280nm (A280) was close to zero. Protein was eluted with buffer containing 25 mM Tris-HCl pH 8.0, 300 mM NaCl, 300 mM Imidazole and 1 mM TCEP. Fractions were collected and their protein content was determined by A280. Fractions containing either SHP2FL or SHP2Cat were pooled and concentrated with Amicon YM30 (SHP2FL) or YM10 (SHP2Cat) centrifugal concentrator. Concentrated protein was loaded to a Superdex 200 Increase 10/300 GL column equilibrated with 25 mM Tris-HCl pH 8.0, 150 mM NaCl and 3mM TCEP.
SHP2 inhibition assay
Full length SHP2 was activated using a bisphosphorylated peptide derived from GAB1 (sequence H2N-VE(pY)LDLDLD(PEG8)RVD(pY)VVVDQQ-amide). The catalytic activity of SHP2 was monitored using the fluorogenic small molecule substrate DiFMUP (ThermoFisher) in 96-well, black polystyrene plates (Corning). The final reaction volume was 100 μl, and the final assay conditions were 55 mM HEPES pH 7.2, 100 mM NaCl, 0.5 mM EDTA, 1 mM DTT, 0.001% Brij35, 0.002% BSA, 0.1% DMSO, 20 μM DiFMUP, 0.2 nM enzyme, 500 nM activating peptide, and 10 μM to 1.9 pM inhibitor. Inhibitors were dissolved and serial 3-fold dilutions were prepared in DMSO. DMSO solutions were then diluted 1:100 in 50 mM HEPES pH 7.2 with 0.02% BSA. Enzyme was mixed with activating peptide in 2X buffer 10–60 minutes before starting the experiment. Diluted compound (10 μL) was mixed with activated enzyme (50 μl) and incubated for 30 minutes at room temperature. A 50 μM aqueous DifMUP solution (40 μl) was added and the plate was read in kinetic mode on a SpectraMax M5 plate reader (Molecular Devices) for 6 minutes using excitation and emission wavelengths of 340 nm and 450 nm. Plots of fluorescence units vs. time were fit with linear regression to determine initial velocity. Plots of initial velocity vs. inhibitor concentration were fit using a four-parameter concentration-response model in GraphPad Prism 7. For display purposes the concentration response curves were normalized using uninhibited and maximally inhibited controls on the experimental plates. The inhibition assay for the isolated catalytic domain of SHP2 was identical except that the activating peptide was omitted.
Formulation and Pharmacokinetics
RMC-4550 was formulated in sulfobutylether betacyclodextrin (Captisol™)/50 mM sodium acetate pH 4.6 (10%/90%, w/v%). Plasma samples for PK analysis were collected in a composite manner with 3 animals per time point. The plasma concentration of RMC-4550 was measured by a liquid chromatography tandem mass spectrometry (LC/MS/MS) method using positive electrospray ionization in multiple reaction monitoring mode. Plasma samples were extracted by protein precipitation using acetonitrile containing an internal standard. After vortexing and centrifugation, the supernatant was injected into an API6500 (AB SCIEX, CA) LC/MS/MS system for quantification. PK parameters were calculated by non-compartmental analysis of the plasma concentration-time profiles using Phoenix 64 (Certera, Menlo Park, CA).
Tumor Xenograft and in vivo Pharmacodynamics
The study is compliant with all relevant ethical regulations regarding animal research. Animal studies shown in Figures 6a and S6a were conducted in accordance with approved institutional animal care and use committee (IACUC) protocols at Translational Drug Development, Scottsdale, AZ. Animal studies shown in Figures 6b-d, S5, S6b-c were conducted in accordance with approved IACUC protocols at WuXi Apptec, Suzhou, China. Animal studies shown in Figures 6e-g and S6d conducted in accordance with approved IACUC protocols at MI Bioresearch, Inc., Ann Arbor, MI. Animal studies shown in Figures 7 a, b, d, e and S6e, f, h, and i were conducted in accordance with approved IACUC protocols at Genendesign, Inc., Shanghai, China. Animal studies shown in Figures 7c, f and S6g conducted in accordance with approved IACUC protocols at University of California, San Francisco, CA. Female (6–8 week old) athymic nude mice were implanted with NCI-H358 (Balb/c strain background), MIA PaCa-2 (NCR nude strain background), MeWo (SCID Beige strain background), NCI-H1838 (SCID Beige strain background), HCT-116 (Balb/c strain background), or CALU-6 (Balb/c strain background) tumor cells subcutaneously in the flank. Once tumors reached an average size of ~200 mm3 (NCI-H358, MIA PaCa-2), 100 mm3 (MeWo), 400 mm3 (NCI-H1838), or 150 mm3 (HCT-116, CALU-6), administration of RMC-4550 (3 to 60 mg/kg PO) or vehicle (Captisol/50 mM acetate buffer pH4.6 (10%/90%, w/v)) was initiated. RMC-4550 was dosed daily via oral gavage at specified doses and was well tolerated (Supplementary Figs. 9–11). For pharmacodynamics studies, animals received a single dose of either RMC-4550 or vehicle, followed by euthanasia at a specified time (2, 8 or 24 hours post-dose). At this time tumors were collected, a portion minced and snap frozen immediately for protein isolation and another portion fixed in 10% neutral buffered formalin prior to processing into paraffin blocks. Tumor lysates were prepared and pERK 1/2 evaluation carried out using Meso-Scale Discovery kit K15107D according to manufacturer’s instructions.
Patient-derived Xenografts
The study is compliant with all relevant ethical regulations regarding research involving human participants. For generation of the TH77 PDX model, informed consent was obtained from the patient as per an open IRB-approved protocol at University of California, San Francisco. Tumors were implanted in SCID mice (Taconic Biosciences). LUN023, LUN037, LUN092, and LUN156 were obtained with informed consent under approval by the Shanghai Changhai Hospital Ethics Committee. The models were derived at Genendesign, Inc., Shanghai, China, implanted in athymic Balb/C nude mice, and used at low passage for the experiments described herein. Once tumors reached an average volume of ~200 mm3, mice were treated with RMC-4550 (10 or 30mg/kg PO, n = 10) or vehicle (2% HPMC E-50, 0.5% Tween-80 in 50 mM sodium citrate buffer, pH 4.0, n = 10), dosed daily via oral gavage. Animals were euthanized when a mean tumor volume of ~1000–1600 mm3 was reached in the vehicle cohort. To allow pharmacodynamics analysis at endpoint, animals received a final dose of RMC-4550 or vehicle, respectively, and were euthanized at 2, 8, or 24 hours post dosing. All tumors were split in two pieces and either snap-frozen and stored at −80 °C, or fixed in 10% neutral buffered formalin for 72 hours prior to transferring to 70% ethanol and storage at 4 °C. For RAS-GTP analysis, frozen tumors were minced using a liquid-nitrogen cooled mortar and pestle. Cell lysates were prepared and RAS-GTP levels were determined by RAS-GTP ELISA (Abcam). For IHC analysis, fixed tumor samples were sectioned and H&E stained.
Phosphatase Selectivity Panel
A panel of twelve protein tyrosine phosphatases was expressed with 6-his tags in E. coli and purified using standard Ni2+ affinity purification procedures. Two protein serine/threonine phosphatases (PP1 and PP2A) were also used and obtained from SignalChem. The inhibition assays for each phosphatase were similar to the conditions described for the SHP2 full length and catalytic enzymes, except that the assay was performed in 384 well black polystyrene plates (Corning) with a total well volume of 50 μl, and fluorescence was read as an endpoint after a five-minute incubation at room temperature. The following additional enzyme-specific changes were made. The enzyme concentration was 0.3 nM (PTP1b, HePTP, Lyp, CD45, and PTPRB), 125 nM (LMPTPA and PRL1), 15 nM (LMPTPB), 5 nM (DUSP22 and STEP), 1.6 nM (PP1), 0.5 nM (PP2A), 0.25 nM (SHP1 catalytic domain), and 0.2 nM (SHP1 full length). The reaction time for PP1 and DUSP22 was 20 minutes, and 90 minutes for PRL1. For PP1 and PP2A the EDTA in the assay buffer was replaced with 5 mM MnCl2. The assay for full length SHP1 was similar to the assay for full length SHP2, except that the enzyme was activated with a synthetic activating peptide with sequence H2N-LN(pY)AQLWHA(PEG8)LTI(pY)ATIRRF-amide at 250 nM.
Kinase selectivity panel
Kinase selectivity was determined using the ScanMax panel, DiscoverRX (42501 Albrae Street, Fremont, CA 94538, United States).
Cellular targets selectivity panel
Off-target profile was determined using Eurofins SafetyScreen44 panel, Eurofins (Eurofins Cerep, Le Bois l'Evêque, B.P. 30001, 86 600 Celle l'Evescault, France).
Code Availability
Computational code used in this study is available from the corresponding authors on reasonable request.
Statistics and Reproducibility
Quantitative data are presented as mean +/− standard deviation (S.D.) or standard error of the mean (S.E.M.), as specified in the figure legend. Statistical tests were performed using GraphPad Prism 7.0. Two-sided Student’s t-tests were used for comparisons of the means of data between two groups, unless otherwise specified. For comparisons among multiple independent groups, one-way ANOVA with post-hoc Tukey’s test was used. For animal studies, animals were randomized before treatments, and all animals treated were included for the analyses. When representative experiments are shown, these represent one out of at least two independent experiments with similar results. The number of independent experiments is indicated in the figure legends.
Data Availability
Source data for Figs. 1–7 and Supplementary Figs. 1–6 have been provided as Supplementary Table 9. All other data supporting the findings of this study are available from the corresponding authors on reasonable request.
Supplementary Material
ACKNOWLEDGMENTS
Revolution Medicines thanks Steve Kelsey for scientific guidance and critical review of the manuscript, Kevan Shokat for scientific guidance, Nidhi Tibrewal for development of the phosphatase selectivity panel, and Jeff Jasper for scientific input. Franziska Haderk was supported by the Mildred Scheel postdoctoral fellowship from the German Cancer Aid. Funding support from NIH / NCI U54CA224081, NIH / NCI R01CA204302, NIH / NCI R01CA211052, NIH / NCI R01CA169338, and Pew Trust and Stewart Foundation (Trever G. Bivona), is acknowledged. We are grateful to researchers at MI Bioresearch, Inc., WuXi Apptec, and Genendesign who support our in vivo pharmacology efforts.
Footnotes
AUTHOR CONTRIBUTIONS
R.J.N. contributed to the design, conduct, and interpretation of all experiments. F.H. contributed in vitro and in vivo experimental design, conduct, and interpretation. C.S., C.J.S, G.H., D.W., C.T., K.M., A.M., J.R., T.H. and A.Z. contributed in vitro experimental design, conduct, and interpretation. V.O., C.M., and Z.W. contributed design, conduct, and interpretation of in vivo experiments. C.B. established and maintains the TH77 model. G.K., E.S.K., and A.L.G. directed the design and synthesis of RMC-4550. M.S. contributed design, conduct, and interpretation of in vivo experiments. M.A.G. contributed to the interpretation of all experiments. J.A.M.S. and T.G.B. supervised the project and contributed to the design and interpretation of all experiments. R.J.N., J.A.M.S. and T.G.B. wrote the manuscript with input from all co-authors.
COMPETING FINANCIAL INTERESTS
T.G.B. is a consultant to Novartis, AstraZeneca, Array Biopharma (Scientific Advisory Board), Inventiva, and is the recipient of research grants from Ignyta and Revolution Medicines. T.G.B. is a member of the Revolution Medicines Scientific Advisory Board. All Revolution Medicines authors are employees of Revolution Medicines, Inc. The other authors declare no competing financial interests.
REFERENCES
- 1.Dhillon AS, Hagan S, Rath O & Kolch W MAP kinase signalling pathways in cancer. Oncogene 26, 3279–3290 (2007). [DOI] [PubMed] [Google Scholar]
- 2.Bos JL, Rehmann H & Wittinghofer A GEFs and GAPs: Critical Elements in the Control of Small G Proteins. Cell 130, 385 (2007). [DOI] [PubMed] [Google Scholar]
- 3.Network, T.C.G.A.R. Comprehensive molecular profiling of lung adenocarcinoma. Nature, 1–9 (2014). [DOI] [PMC free article] [PubMed] [Google Scholar]
- 4.Krauthammer M et al. Exome sequencing identifies recurrent mutations in NF1 and RASopathy genes in sun-exposed melanomas. Nature genetics 47, 996–1002 (2015). [DOI] [PMC free article] [PubMed] [Google Scholar]
- 5.Redig AJ et al. Clinical and Molecular Characteristics of NF1-Mutant Lung Cancer. Clinical cancer research : an official journal of the American Association for Cancer Research 22, 3148–3156 (2016). [DOI] [PMC free article] [PubMed] [Google Scholar]
- 6.Caunt CJ, Sale MJ, Smith PD & Cook SJ MEK1 and MEK2 inhibitors and cancer therapy: the long and winding road. Nature Reviews Cancer 15, 577–592 (2015). [DOI] [PubMed] [Google Scholar]
- 7.Bollag G et al. Vemurafenib: the first drug approved for BRAF-mutant cancer. Nature Reviews Drug Discovery, 1–14 (2012). [DOI] [PubMed] [Google Scholar]
- 8.Nieto P et al. A Braf kinase-inactive mutant induces lung adenocarcinoma. Nature, 1–13 (2017). [DOI] [PMC free article] [PubMed] [Google Scholar]
- 9.Yao Z et al. Tumours with class 3 BRAF mutants are sensitive to the inhibition of activated RAS. Nature, 1–15 (2017). [DOI] [PMC free article] [PubMed] [Google Scholar]
- 10.Lito P, Solomon M, Li L-S, Hansen R & Rosen N Allele-specific inhibitors inactivate mutant KRAS G12C by a trapping mechanism. Science 351, 604–608 (2016). [DOI] [PMC free article] [PubMed] [Google Scholar]
- 11.Ostrem JM, Peters U, Sos ML, Wells JA & Shokat KM K-Ras(G12C) inhibitors allosterically control GTP affinity and effector interactions. Nature 503, 548–551 (2013). [DOI] [PMC free article] [PubMed] [Google Scholar]
- 12.Patricelli MP et al. Selective Inhibition of Oncogenic KRAS Output with Small Molecules Targeting the Inactive State. Cancer Discovery 6, 316–329 (2016). [DOI] [PubMed] [Google Scholar]
- 13.Prahallad A et al. PTPN11 Is a Central Node in Intrinsic and Acquired Resistance to Targeted Cancer Drugs. CellReports 12, 1978–1985 (2015). [DOI] [PubMed] [Google Scholar]
- 14.Niihori T et al. Functional analysis of PTPN11/SHP-2 mutants identified in Noonan syndrome and childhood leukemia. Journal of human genetics 50, 192–202 (2005). [DOI] [PubMed] [Google Scholar]
- 15.Tartaglia M & Gelb BD Germ-line and somatic PTPN11 mutations in human disease. Eur J Med Genet 48, 81–96 (2005). [DOI] [PubMed] [Google Scholar]
- 16.Chen Y-NP et al. Allosteric inhibition of SHP2 phosphatase inhibits cancers driven by receptor tyrosine kinases. Nature 535, 148–152 (2016). [DOI] [PubMed] [Google Scholar]
- 17.Wildes DNA, Buckl A, Hsieh D, Jogalekar AS, Kiss G, Koltun ES, Marquez A, Mellem KT, Romero J, Saldajeno-Concar M, Schulze CJ, Semko CM, Won W, Nichols RJ, Stahlhut C, Tzitzilonis C, Gill AL, Smith JAM in Proceedings of the 109th Annual Meeting of the American Association for Cancer Research (Chicago, IL; 2018). [Google Scholar]
- 18.Garcia-Fortanet J et al. Allosteric Inhibition of SHP2: Identification of a Potent, Selective, and Orally Efficacious Phosphatase Inhibitor. Journal of Medicinal Chemistry 59, 7773–7782 (2016). [DOI] [PubMed] [Google Scholar]
- 19.Poulikakos PI et al. RAF inhibitor resistance is mediated by dimerization of aberrantly spliced BRAF(V600E). Nature 480, 387–390 (2011). [DOI] [PMC free article] [PubMed] [Google Scholar]
- 20.Yao Z et al. BRAF Mutants Evade ERK-Dependent Feedback by Different Mechanisms that Determine Their Sensitivity to Pharmacologic Inhibition. Cancer Cell 28, 370–383 (2015). [DOI] [PMC free article] [PubMed] [Google Scholar]
- 21.Lito P et al. Relief of profound feedback inhibition of mitogenic signaling by RAF inhibitors attenuates their activity in BRAFV600E melanomas. Cancer Cell 22, 668–682 (2012). [DOI] [PMC free article] [PubMed] [Google Scholar]
- 22.Corbalan-Garcia S, Yang SS, Degenhardt KR & Bar-Sagi D Identification of the mitogen-activated protein kinase phosphorylation sites on human Sos1 that regulate interaction with Grb2. Molecular and Cellular Biology 16, 5674–5682 (1996). [DOI] [PMC free article] [PubMed] [Google Scholar]
- 23.Kamioka Y, Yasuda S, Fujita Y, Aoki K & Matsuda M Multiple Decisive Phosphorylation Sites for the Negative Feedback Regulation of SOS1 via ERK. Journal of Biological Chemistry 285, 33540–33548 (2010). [DOI] [PMC free article] [PubMed] [Google Scholar]
- 24.Nissan MH et al. Loss of NF1 in cutaneous melanoma is associated with RAS activation and MEK dependence. Cancer Research 74, 2340–2350 (2014). [DOI] [PMC free article] [PubMed] [Google Scholar]
- 25.Shapira S, Barkan B, Friedman E, Kloog Y & Stein R The tumor suppressor neurofibromin confers sensitivity to apoptosis by Ras-dependent and Ras-independent pathways. Cell Death Differ 14, 895–906 (2007). [DOI] [PubMed] [Google Scholar]
- 26.Hunter JC et al. Biochemical and Structural Analysis of Common Cancer-Associated KRAS Mutations. Molecular Cancer Research 13, 1325–1335 (2015). [DOI] [PubMed] [Google Scholar]
- 27.Watson IR et al. The RAC1 P29S hotspot mutation in melanoma confers resistance to pharmacological inhibition of RAF. Cancer Res 74, 4845–4852 (2014). [DOI] [PMC free article] [PubMed] [Google Scholar]
- 28.Kobayashi T et al. Molecular and clinical analysis of RAF1 in Noonan syndrome and related disorders: dephosphorylation of serine 259 as the essential mechanism for mutant activation. Hum Mutat 31, 284–294 (2010). [DOI] [PubMed] [Google Scholar]
- 29.Fujita-Sato S et al. Enhanced MET Translation and Signaling Sustains K-Ras-Driven Proliferation under Anchorage-Independent Growth Conditions. Cancer Res 75, 2851–2862 (2015). [DOI] [PMC free article] [PubMed] [Google Scholar]
- 30.Rebecca Foster CM, Ceri Wiggins Chris Torrance in Proceedings of the 104th Annual Meeting of the American Association for Cancer Research (Washington, DC; 2013). [Google Scholar]
- 31.Vartanian S et al. Identification of mutant K-Ras-dependent phenotypes using a panel of isogenic cell lines. J Biol Chem 288, 2403–2413 (2013). [DOI] [PMC free article] [PubMed] [Google Scholar]
- 32.Huang H et al. Oncogenic K-Ras requires activation for enhanced activity. Oncogene 33, 532–535 (2014). [DOI] [PMC free article] [PubMed] [Google Scholar]
- 33.Tashiro T et al. In vivo and ex vivo cetuximab sensitivity assay using three-dimensional primary culture system to stratify KRAS mutant colorectal cancer. PLoS One 12, e0174151 (2017). [DOI] [PMC free article] [PubMed] [Google Scholar]
- 34.Deweck AM, Schmelzle R;, T (
- 35.McDonald I, E Robert et al. Project DRIVE: A Compendium of Cancer Dependencies and Synthetic Lethal Relationships Uncovered by Large-Scale, Deep RNAi Screening. Cell 170, 577–586.e510 (2017). [DOI] [PubMed] [Google Scholar]
- 36.Drosten M et al. Genetic analysis of Ras signalling pathways in cell proliferation, migration and survival. EMBO J 29, 1091–1104 (2010). [DOI] [PMC free article] [PubMed] [Google Scholar]
- 37.Dance M, Montagner A, Salles JP, Yart A & Raynal P The molecular functions of Shp2 in the Ras/Mitogen-activated protein kinase (ERK1/2) pathway. Cell Signal 20, 453–459 (2008). [DOI] [PubMed] [Google Scholar]
- 38.Hadari YR, Kouhara H, Lax I & Schlessinger J Binding of Shp2 tyrosine phosphatase to FRS2 is essential for fibroblast growth factor-induced PC12 cell differentiation. Mol Cell Biol 18, 3966–3973 (1998). [DOI] [PMC free article] [PubMed] [Google Scholar]
- 39.Aronheim A et al. Membrane targeting of the nucleotide exchange factor Sos is sufficient for activating the Ras signaling pathway. Cell 78, 949–961 (1994). [DOI] [PubMed] [Google Scholar]
- 40.Cunnick JM, Dorsey JF, Munoz-Antonia T, Mei L & Wu J Requirement of SHP2 binding to Grb2-associated binder-1 for mitogen-activated protein kinase activation in response to lysophosphatidic acid and epidermal growth factor. J Biol Chem 275, 13842–13848 (2000). [DOI] [PubMed] [Google Scholar]
- 41.Cunnick JM et al. Regulation of the mitogen-activated protein kinase signaling pathway by SHP2. J Biol Chem 277, 9498–9504 (2002). [DOI] [PubMed] [Google Scholar]
- 42.Batth TS et al. Large-Scale Phosphoproteomics Reveals Shp-2 Phosphatase-Dependent Regulators of Pdgf Receptor Signaling. Cell Rep 22, 2784–2796 (2018). [DOI] [PMC free article] [PubMed] [Google Scholar]
- 43.Niihori T et al. Germline KRAS and BRAF mutations in cardio-facio-cutaneous syndrome. Nat Genet 38, 294–296 (2006). [DOI] [PubMed] [Google Scholar]
- 44.Janes MR et al. Targeting KRAS Mutant Cancers with a Covalent G12C-Specific Inhibitor. Cell 172, 578–589 e517 (2018). [DOI] [PubMed] [Google Scholar]
- 45.Zehir A et al. Mutational landscape of metastatic cancer revealed from prospective clinical sequencing of 10,000 patients. Nat Med 23, 703–713 (2017). [DOI] [PMC free article] [PubMed] [Google Scholar]
- 46.Lee SJ et al. Regulation of hypoxia-inducible factor 1alpha (HIF-1alpha) by lysophosphatidic acid is dependent on interplay between p53 and Kruppel-like factor 5. J Biol Chem 288, 25244–25253 (2013). [DOI] [PMC free article] [PubMed] [Google Scholar]
- 47.The NCI RAS Initiative.
- 48.Schindelin J et al. Fiji: an open-source platform for biological-image analysis. Nat Methods 9, 676–682 (2012). [DOI] [PMC free article] [PubMed] [Google Scholar]
Associated Data
This section collects any data citations, data availability statements, or supplementary materials included in this article.
Supplementary Materials
Data Availability Statement
Source data for Figs. 1–7 and Supplementary Figs. 1–6 have been provided as Supplementary Table 9. All other data supporting the findings of this study are available from the corresponding authors on reasonable request.