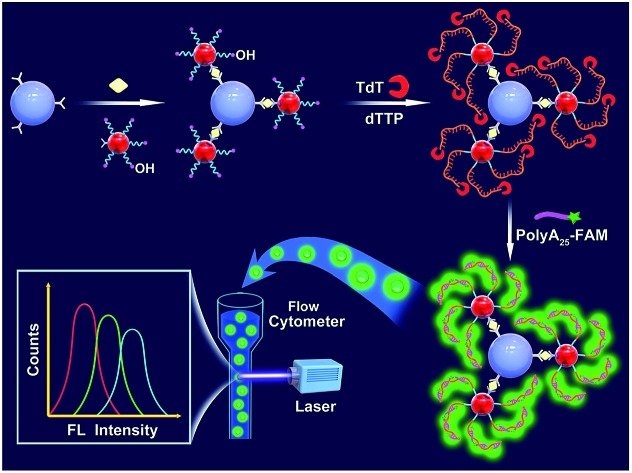
 An ultrasensitive flow cytometric immunoassay (TdT-FCI) is developed based on bead surface-initiated template-free DNA extension.
Abstract
Proteins lack the duplication mechanism like nucleic acids, so the connection of immunoassays with effective nucleic acid amplification techniques has become a powerful way for the detection of trace protein biomarkers in biological fluids. However, such immunoassays generally suffer from rather stringent DNA sequence design and complicated operations. Herein, we propose a simple but highly sensitive flow cytometric immunoassay (FCI) by employing on-bead terminal deoxynucleotidyl transferase (TdT)-initiated template-free DNA extension as an effective signal amplification pathway (TdT-FCI), and gold nanoparticles (AuNPs) co-functionalized with both the detection antibody and a 3′-OH oligonucleotide (ODN) as the transducer to bridge the immunoassay and subsequent TdT-mediated DNA amplification. The target antigen can sandwich with the capture antibody immobilized on the magnetic beads (MBs) and the detection antibody on the AuNPs to bring a lot of ODNs onto the surface of MBs. Each ODN on the MBs can be effectively elongated by TdT in a template-free manner to produce a long poly(T) tail, which will then bind to many 6-carboxyfluorescein (FAM)-labeled poly(A)25. Since each AuNP can carry multiple ODNs and each extended ODN can ultimately capture numerous FAM-poly(A)25, efficiently amplified fluorophore accumulation on the MBs can be achieved. The fluorescent MBs can be individually interrogated with a flow cytometer and thus quantitative analysis of the target antigen can be realized. Coupled with the powerful flow cytometry analysis, the simple but efficient TdT-based signal amplification mechanism has pushed the detection limit of prostate specific antigen (PSA) down to a low level of 0.5 pg mL–1. Furthermore, based on an elegant bead size-encoding principle, we have further advanced the TdT-FCI for multiplexed antigen detection in a single reaction. Sharing the unique merits of simple design and operation, efficient signal amplification, powerful signal readout and the capability for multiplexed analysis, this TdT-FCI provides a versatile tool for detecting trace antigen biomarkers towards clinical diagnosis as well as prognosis.
Introduction
Sensitive detection of biomarkers in biological fluids is extremely important for disease diagnosis, prognosis and prevention.1–3 Until now, the detection of antigen/protein biomarkers using immunoassay techniques is still the dominant tool for clinical diagnosis.3,4 Although some conventional immunoassays are usually sufficient for routine clinical tests, however, in many cases, accurately monitoring the concentration fluctuation of antigen/protein biomarkers at extremely low levels in biological fluids still remains challenging. For example, PSA (prostate specific antigen) is a widely investigated serum biomarker for screening prostate cancer and evaluating the recovery of patients after surgery treatment.5,6 Typically, the PSA level is lower than 4 ng mL–1 in the serum of healthy males, while it will be remarkably increased in males with prostate cancer.7 Notably, the PSA levels in the serum of patients whose prostates were surgically removed are extremely low (approximately 1–5 pg mL–1).8 The obvious increase of serum PSA values at the pg mL–1 level post-operative may indicate the recurrence or metastasis of prostate cancer.7 Traditional immunoassays (with detection limits typically ranging from 0.1 ng mL–1 to several ng mL–1) can generally meet the clinical demand for the detection of PSA higher than 4 ng mL–1, but their compromised sensitivity is insufficient for tracing the serum PSA level for monitoring prostate cancer relapse after radical prostatectomy.5–8 Furthermore, in some cases, the existing well-applied immunoassays are also not sensitive enough for screening potential cancers at the very early stage when the concentrations of the trace amounts of cancer biomarkers are too low to detect. Therefore, the development of highly sensitive and reliable strategies for the detection of trace amounts of disease-related antigens will be of great significance for both clinical diagnosis and prognosis.
For decades, sandwich immunoassays, coupled with varying signal transducing mechanisms such as radioactive, electrochemical, optical, mass-sensitive and colorimetric readout pathways, have been the most widely used protocols in the fields of biodetection and clinical diagnostics, which have been well summarized in previous reviews.9–13 Radioimmunoassays (RIAs) are limited by their inherent drawbacks such as potential radiation hazards and the need for professional equipment/qualified personnel.14 Enzyme-linked immunosorbent assays (ELISAs) are the most extensively applied protocols in routine clinical laboratories.9–13 However, the traditional ELISAs only show compromised sensitivity, typically with the detection limits of antigen/protein biomarkers at the ng mL–1 level.6,15 Although the sensitivities of some modified ELISAs have been obviously improved based on the use of nanoparticle probes, nano-enzyme mimics and enzyme-functionalized nanostructures,16–21 these modified ELISAs often suffer from disadvantages such as the need for special synthetic skills and complicated procedures as well as delicate surface modification and bioconjugation.
Unlike proteins, nucleic acids have efficient replication and amplification mechanisms,22 such as the well-known polymerase chain reaction (PCR), which can achieve exponential signal amplification.23 Although one cannot yet chemically duplicate protein targets, the connection of efficient nucleic acid amplification mechanisms with antibody-based immunoreactions has opened a new way to dramatically increase the sensitivity of traditional immunoassays,23–28 among which immuno-PCR and immuno-RCA (rolling circular amplification) are the most prominent. Although quite effective to improve the detection sensitivity, some problems still remain for most of the immuno-nucleic acid amplification strategies. On the one hand, well-optimized nucleic acid amplification systems and stringent sequence design are needed,29–31 otherwise undesired nonspecific signals may totally conceal the meaningful and true results. On the other hand, the preparation of DNA–antibody conjugates is a complicated process and involves the use of toxic chemicals and cumbersome purification procedures.29–31 Therefore, it is urgent to devise a much simpler and facile nucleic acid amplification technique that can be easily connected with immunoreactions for the highly sensitive detection of various antigens.
Herein, we wish to propose a simple but highly sensitive flow cytometric immunoassay (FCI) by employing terminal deoxynucleotidyl transferase (TdT)-initiated on-bead DNA extension as the effective signal amplification pathway (TdT-FCI). In this new TdT-FCI, gold nanoparticles (AuNPs) are used as the carrier to facilely co-load detection antibodies and 3′-OH oligonucleotides (ODN), which leads to an increased ODN/antibody ratio and greatly simplifies the purification procedure in comparison with covalent DNA–antibody bioconjugation protocols. After the magnetic bead (MB)-supported sandwich immunoreaction, the 3′-OH end of each ODN captured on the MBs can be efficiently extended by TdT to produce a long poly(T) tail,32–39 which can further bind to a lot of fluorescein-labeled poly(A) sequences, leading to efficiently amplified fluorescence accumulation on the MBs. Such fluorescent MBs can be sequentially and rapidly detected one-by-one through a powerful flow cytometer at a high speed.40–42 It is worth noting that unlike immuno-PCR and immuno-RCA where several sophisticatedly designed DNA probes must be involved, since TdT-based DNA polymerization is sequence-independent and template-free,32–39 only one ODN with a 3′-OH terminus is needed, whose sequence can be randomly designed. So, the DNA amplification in the TdT-FCI is greatly simplified. By combining TdT-catalyzed simple but efficient signal amplification mechanisms with powerful flow cytometry readout in the TdT-FCI, the detection limit of PSA is lowered down to the sub pg mL–1 level, well meeting the requirement for monitoring the ultra-low serum PSA after radical prostatectomy. More fascinatingly, the flow cytometer also enables clear differentiation of MBs with different sizes through the FSC (forward scatter) and SSC (side scatter) parameters.43–45 Based on this principle, we have further advanced the TdT-FCI for the simultaneous detection of several targets in one tube based on a novel MB size-encoding mechanism.
Experimental section
Reagents and materials
PSA, biotinylated anti-PSA monoclonal antibody (mAb1), anti-PSA monoclonal antibody (mAb2), fluorescein-labelled anti-PSA monoclonal antibody, human alpha fetoprotein antigen (AFP), anti-AFP monoclonal antibody and biotinylated anti-AFP monoclonal antibody were purchased from Linc-Bio Science (Shanghai, China). Human carcinoembryonic antigen (CEA), monoclonal anti-CEA antibody, and biotinylated monoclonal anti-CEA antibody were obtained from Biosynthesis Biotechnology (Beijing, China). Human IgG (HIgG) and goat-anti-human IgG (GaH IgG) were obtained from Sanchen Biotechnology (Nanjing, China). Dynabeads® M-270 Streptavidin (2.8 μm), Dynabeads® Myone Streptavidin C1 (1.0 μm) and TdT were supplied by Thermo Fisher Scientific. Biotin, dTTP, Tween-20 and bovine serum albumin (BSA) were acquired from Sangon Biotech (Shanghai, China). The ODN probe (5′-SH-TTTTTTCCCAGCACGAGACCAATT-3′) and 6-carboxyfluorescein (FAM)-labeled poly(A)25 were synthesized and purified by Sangon Biotech (Shanghai, China). All other chemical reagents were of analytical grade and used as received without further purification.
The detailed components of the used buffers in this study are listed below:
1× PBS (10 mM, pH 7.4, containing 137 mM NaCl and 2.7 mM KCl);
PBS–BSA (1× PBS with 0.5% BSA and 0.1% Tween-20);
PBST (1× PBS with 0.1% Tween-20);
1× TdT buffer (25 mM Tris–HCl, 1 mM CoCl2, 0.2 M potassium cacodylate, pH 7.2).
Preparation of ODNs and mAb2-conjugated AuNPs (mAb2–AuNPs–ODNs)
The colloidal AuNPs (16 nm, see the TEM image in Fig. S1†) were prepared following the well-established citrate-reduction method.46
The mAb2–AuNPs–ODN nanocomplexes were prepared according to a modified literature protocol.47 Typically, 1 mL of 16 nm colloidal AuNPs were firstly adjusted to pH 9.2–9.5 by using 0.1 M Na2CO3 solution. Then, 10 μL anti-PSA mAb2 (1.0 mg mL–1) was introduced and the mixture was incubated at room temperature for 20 min with mild stirring. Afterward, the alkylthiol-capped ODNs (1 nmol) were pipetted into the mixture. After gently shaking for 5 min, the mixture was further incubated at 4 °C overnight. Following that, the mixture was first buffered to 10 mM PB (pH 7.2), and then the NaCl concentration was tuned to 0.15 M under slow stirring. The mAb2–AuNPs–ODNs were purified by multiple rounds of centrifugation. Finally, the obtained mAb2–AuNPs–ODNs were dispersed in 1 mL of PBS–BSA, and stored at 4 °C.
Standard procedures of the proposed TdT-FCI strategy
Let's take the detection of PSA as an example to describe the standard procedures of the proposed TdT-FCI strategy by using Dynabeads® M-270 Streptavidin (abbreviated as M-270 MBs) as the reaction carrier.
The standard TdT-FCI assay consists of the following steps. (i) In each reaction, 0.02 μg of biotinylated capture antibody (mAb1) was firstly incubated with ∼1.2 × 10⁵ M-270 MBs (corresponding to 0.2 μL original bead slurry) at room temperature for 30 min under shaking to form the mAb1–MB conjugates; (ii) after purification, in a total of 10 μL of PBS–BSA media, the mAb1–MBs were incubated with serial dilutions of PSA and 5 μL mAb2–AuNPs–ODN for 2 h at room temperature under mild shaking to perform the non-competitive sandwich-type immunoreaction; (iii) the MBs carrying the sandwich immunocomplexes were magnetically isolated and washed three times, and such MBs were then suspended in 10 μL of TdT buffer containing 1 mM dTTP and 1 U TdT to conduct the TdT-assisted on-bead DNA extension (37 °C for 1 h); (iv) the MBs were further incubated with excess FAM-poly(A)25 (1 μM) under shaking (4 °C for 1 h); (v) as a final step, each sample was diluted to 350 μL with 1× PBS and immediately detected using a FACSCalibur Flow Cytometer (BD Biosciences). During FCM analysis, 10 000 MBs were collected for each reaction and their fluorescence signals were detected through the FL1 (FAM/FITC) channel under 488 nm laser excitation. The mean fluorescence intensity (MFI) of all the MBs in each sample was statistically analyzed for the quantitative analysis of PSA.
The fluorescence images of the fluorescent MBs were obtained on a laser scanning confocal microscope (FV-1200, Olympus) by dropping the MBs onto a 0.17 mm glass slide. Then their fluorescence images were recorded by collecting the fluorescence at 500–600 nm under the excitation of a 488 nm laser.
Protocol of the bead size-coded TdT-FCI strategy for simultaneous detection of multiple antigens
Taking the simultaneous detection of CEA and PSA in a single tube as an example. Firstly, two kinds of MB and AuNP-based nanocomplexes, namely, anti-CEA mAb1-functionalized Myone-MBs, anti-CEA mAb2–AuNPs–ODN, anti-PSA mAb1-functionalized M-270 MBs and anti-PSA mAb2–AuNPs–ODN, were prepared respectively. Briefly, anti-CEA mAb1–Myone MBs (∼3 × 10⁵ beads, 1.0 μm) and anti-PSA mAb1–M-270 MBs (∼3 × 10⁵ beads, 2.8 μm) were firstly mixed together, and then the two kinds of MBs in each reaction tube were sequentially incubated with the sample containing different targets, and the mixture containing PSA-specific and CEA-specific bio-barcode AuNPs. The subsequent TdT-assisted signal amplification reaction, FAM-poly(A)25 hybridization reaction, and the FCM analysis were performed with the same procedures stated above. The FSC, SSC and FL1 signals were measured simultaneously using the flow cytometer. The FSC/SSC signals are used for differentiating the MB sizes while the FL1 signals are recorded for the quantification of PSA and CEA.
Results and discussion
Principle of the proposed TdT-FCI
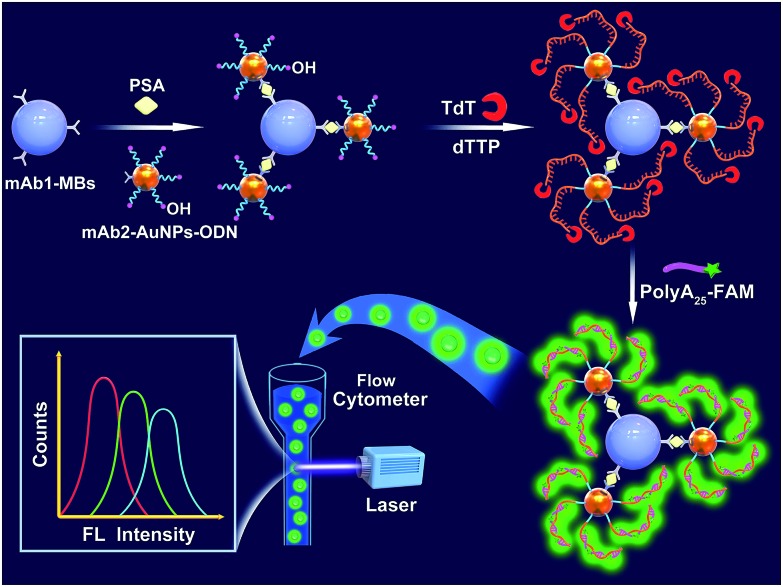
Fig. 1 illustrates the working principle of the MB-assisted TdT-FCI for the detection of PSA. In this work, the anti-PSA mAb1 is immobilized on the MBs to capture the target PSA. AuNPs co-functionalized with anti-PSA mAb2 and massive ODNs with their 3′-OH exposed outside are employed as the transducer to bridge the immunoreaction with subsequent template-free DNA polymerization. In the presence of target PSA, the noncompetitive sandwich-type immunoreaction between the mAb1, PSA and mAb2 will specifically bring the AuNPs, each of which carries many ODNs, to the surface of MBs.48 The use of mAb2–AuNPs–ODNs successfully transforms the PSA quantification to the detection of the ODNs loaded on the MBs. After the MB-supported immunoreaction, TdT can recognize the 3′-OH termini of the ODNs on the MBs to initiate the template-free DNA polymerization. Since only dTTP is provided, each ODN on the MBs can produce a long linear poly(T) tail up to thousands of nts long.32 Each of the produced poly(T) tails can further combine with numerous FAM-poly(A)25 ssDNA, resulting in highly efficient fluorophore accumulation and signal amplification on the surface of MBs. Finally, such fluorescent MBs are rapidly analyzed one-by-one using a flow cytometer without requirement of fluorophore elution.
Fig. 1. Schematic illustration of the MB-assisted TdT-FCI for the detection of protein biomarkers.
Through the statistical analysis of the collected fluorescence signals from numerous MBs for each sample, the target PSA level can be accurately reflected by the mean fluorescence intensity (MFI) with high sensitivity. In contrast, if PSA is absent, no sandwich immunoreaction occurs and thus the mAb2–AuNPs–ODNs will not be anchored on the surface of MBs. As a result, further TdT-based DNA extension and fluorophore enriching on the MBs will not be initiated at all, leaving the MBs non-fluorescent.
This new TdT-FCI shares several unique advantages. Firstly, in traditional nucleic acid amplification-based immunoassays, complicated and specialized conjugation and purification operations are needed to prepare the antibody–DNA probe bioconjugates. Herein, AuNPs serve as the carrier for both the mAb2 and ODN. The co-functionalization of SH-DNA and antibodies on AuNPs is mature and simple, which can be easily handled in an ordinary lab. Second, unlike the well-established immuno-PCR and immuno-RCA where multiple DNA probes must be sophisticatedly and stringently designed to avoid potential ambiguous results, in the TdT-FCI, only one ODN with a 3′-OH terminus is needed, whose sequence can be randomly designed since the TdT-based DNA polymerization is sequence-independent and template-free. This greatly simplifies the assay design and makes the results more reliable. Third, each PSA molecule will form an immunocomplex with a large ratio of ODN to PSA and each ODN can be elongated by TdT to capture numerous fluorescein molecules on the MBs, which lead to the efficient signal amplification and greatly improved detection sensitivity. Fourth, flow cytometers have been routinely used in the hospital. They enable highly sensitive analysis of fluorophore-enriched MBs without further fluorophore elution, and are powerful tools for biomedical applications.
Evaluation of the feasibility of the proposed TdT-FCI
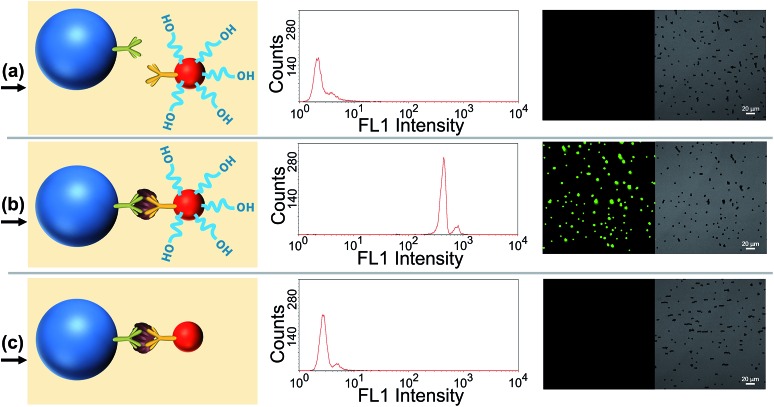
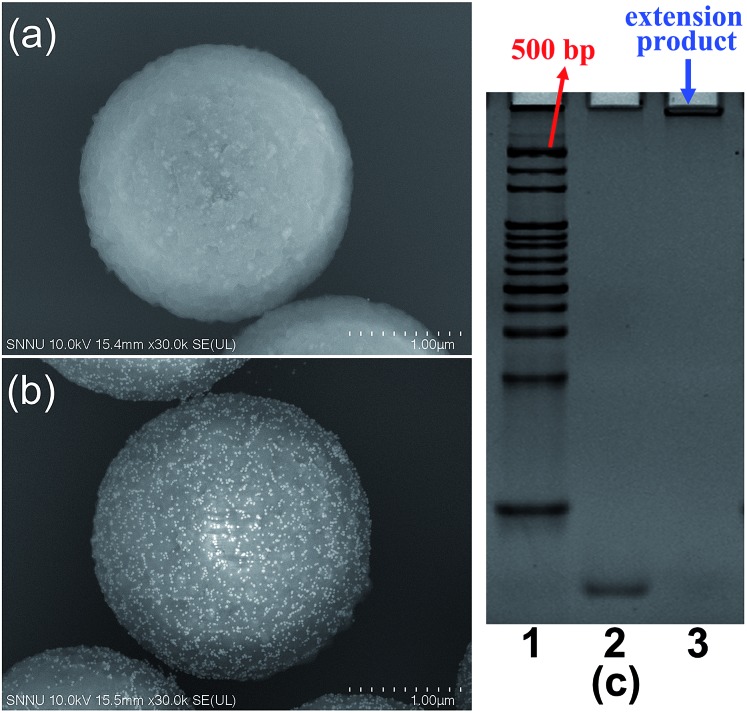
Several verification experiments were firstly carried out to prove the feasibility of the proposed TdT-FCI. Fig. 2a displays the FCM fluorescence histogram and the corresponding confocal fluorescence imaging result of the MBs of the blank control in the TdT-FCI. One can see that such MBs do not exhibit observable fluorescence since no immunoreaction and TdT-based extension can occur on the MBs. In contrast, as shown in Fig. 2b, with the introduction of PSA into the TdT-FCI system, the MBs all display a highly intense fluorescence signal both in the FCM fluorescence histogram and fluorescence image, which can be distinctly discriminated from those of the blank control (Fig. 2a) due to the AuNP-assisted immunoreaction and TdT-based efficient signal amplification. The phenomena shown in Fig. 2a and b can be further supported by the field-emission scanning electron microscopy (FE-SEM) images. As can be seen from Fig. 3b, in the presence of the PSA target, plenty of AuNPs are densely loaded on the MBs, indicating that the mAb2–AuNPs–ODNs are actually bound to the surface of MBs due to the PSA-tethered sandwich-type immunocomplexes. Nevertheless, no AuNPs can be observed for the MBs of the blank control (Fig. 3a), suggesting a high specificity of the immunoreaction and the absence of nonspecific adsorption of mAb2–AuNPs–ODN on the MBs, which are essential to achieve high signal-to-background ratios.
Fig. 2. (a) FCM result and the corresponding fluorescence image of the MBs involved in the TdT-FCI system without the PSA target (blank control); (b) FCM result and the corresponding fluorescence image of the MBs involved in the TdT-FCI system in the presence of 20 ng mL–1 PSA target. In images (a) and (b), the TdT-FCI is conducted following the standard procedures as stated in the Experimental section; (c) FCM result and corresponding fluorescence image of the MBs involved in the TdT-FCI system with 20 ng mL–1 PSA target by using mAb2–AuNPs instead of mAb2–AuNPs–ODN. All of the parameters for the FCM measurement and fluorescence imaging are the same in (a–c). Acquisition parameters of the fluorescence images: HV, 520 V; gain, 1; offset, 20%; collected fluorescence band, 500–600 nm.
Fig. 3. (a) Representative FE-SEM image of the MBs of the blank control (without PSA). (b) Representative FE-SEM image of the MBs treated with 20 ng mL–1 PSA target in the TdT-FCI. (c) Polyacrylamide gel electrophoresis (PAGE) results of the TdT-catalyzed extension products of the ODN. Lane 1, double-stranded DNA ladder; lane 2, pure ODN (200 nM); lane 3, 200 nM ODN after the TdT-catalyzed extension.
Besides the high specificity of the immunoreaction-induced loading of mAb2–AuNPs–ODNs on the MBs, the critical role of the TdT-catalyzed ODN polymerization is also testified. As shown in Fig. 2c, if mAb2–AuNPs (without co-loading of ODN) are used in the TdT-FCI instead of the mAb2–AuNPs–ODN, no fluorescence signal can be aroused on the MBs. The results shown in Fig. 2b and c clearly demonstrate that the ODN functionalized on the mAb2–AuNPs–ODN is essential in the TdT-FCI for efficient signal amplification and fluorescence enriching on the MBs. The efficient TdT-mediated ODN polymerization is well confirmed by polyacrylamide gel electrophoresis (PAGE) (Fig. 3c), where a band corresponding to a poly(T) tail (thousands of nts long) at the very top of the gel can be identified after the TdT-catalyzed extension of the ODN, suggesting a high amplification efficiency. All of these results shown in Fig. 2 and 3 clearly prove that the proposed sensing strategy of TdT-FCI is feasible for antigen detection and the combination of mAb2–AuNPs–ODNs with TdT-assisted DNA extension contributes to a considerable amplification effect.
Analytical performance of the TdT-FCI for the detection of PSA
In the proposed TdT-FCI, some important factors such as the amount of TdT and the ratio of mAb2/ODN on the AuNPs, which may affect the PSA detection, were firstly optimized (see Fig. S2 and S3 in the ESI†).
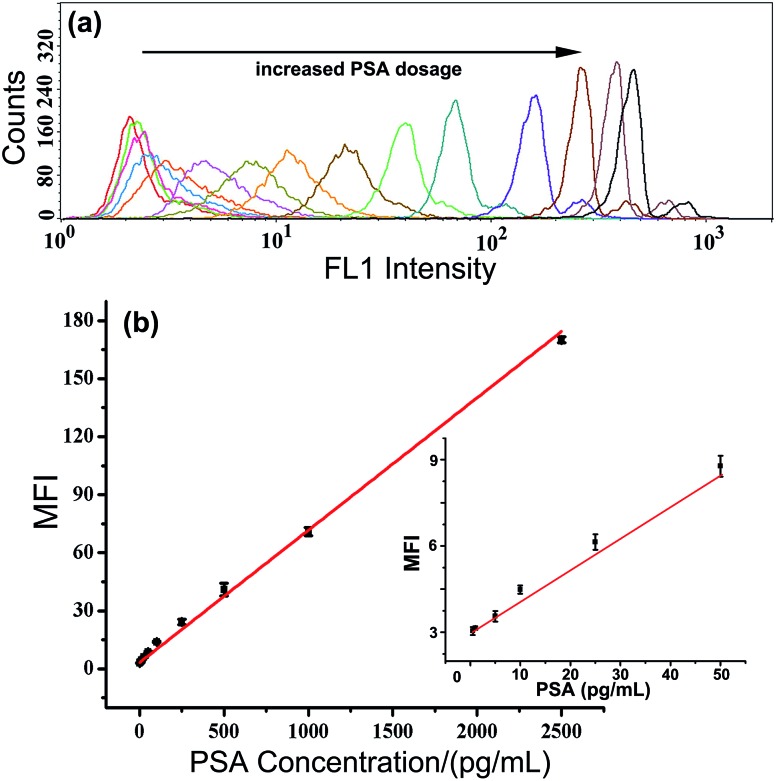
Under such optimal conditions, the performance of the TdT-FCI strategy is investigated for the detection of the PSA target. Fig. 4a displays the fluorescence histograms of the M-270 beads detected using the flow cytometer in the presence of varying dosages of PSA. One can see that the fluorescence signals of the beads in the TdT-FCI system increase gradually with increasing the PSA concentration from 0.5 pg mL–1 to 20 ng mL–1. The dependence of the MFI value of all the detected MBs in each sample on the PSA concentration is plotted in Fig. 4b. It can be seen that the MFI is linearly proportional to the concentration of PSA in a wide dynamic range from 0.5 pg mL–1 to 2.5 ng mL–1, and as low as 0.5 pg mL–1 PSA can be clearly detected from the blank control. The corresponding calibration is MFI = 0.068CPSA (pg mL–1) + 3.325 with a regression coefficient R of 0.9920.
Fig. 4. (a) Fluorescence histograms of the M-270 MBs in the presence of different concentrations of PSA. PSA from left to right: 0 (blank), 0.5 pg mL–1, 1 pg mL–1, 5 pg mL–1, 10 pg mL–1, 25 pg mL–1, 50 pg mL–1, 100 pg mL–1, 250 pg mL–1, 500 pg mL–1, 1 ng mL–1, 2.5 ng mL–1, 5 ng mL–1, 10 ng mL–1, and 20 ng mL–1, respectively. (b) The correlation between the MFI values and PSA concentrations. The inset shows the plot between the MFI values and PSA concentrations in the range of 0–50 pg mL–1. Error bars represent the standard deviation of three replicates. FL1 voltage for FCM measurements: 420 V.
In recent years, various immunoassays have been established for the detection of PSA. Some representative PSA assays based on fluorescent, colorimetric, and mass as well as electrochemical methods have been summarized in Table S1.† One can see from Table S1† that the sensitivity of the TdT-FCI is superior or at least comparable to most of the reported methods. Particularly, a time-resolved fluoroimmunoassay (TR-FI) coupled with a lanthanide nanoparticle enhancing mechanism has been recently reported to be one of the most sensitive fluorescent immunoassays for PSA analysis. The detection limit of PSA in our study is even slightly lower than that of the TR-FI (0.52 pg mL–1).7 The sensitivity of the TdT-FCI is also more than 100-fold higher than that of the commercial dissolution enhanced lanthanide fluoroimmunoassay (detection limit of PSA, ∼0.1 ng mL–1).49 Moreover, the Jiang group has proposed a MB-supported immuno-PCR method for the detection of PSA, in which the lowest detectable PSA concentration is ∼0.1 pM (∼3 pg mL–1).50 So, despite the simple design of TdT-based DNA polymerization, the sensitivity of the TdT-FCI is even higher than that of the immuno-PCR strategy. Most importantly, since the detection limit of PSA is lowered down to the sub pg mL–1 level, the TdT-FCI can fulfil the critical requirement for accurately detecting the serum PSA fluctuation at the trace pg mL–1 level for monitoring the prostate relapse after prostatectomy.
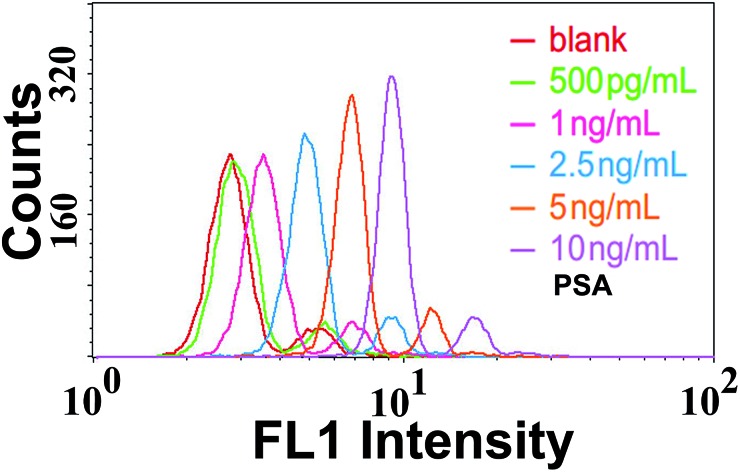
The excellent sensitivity of the TdT-FCI should be ascribed to the efficient signal amplification due to the combination of mAb2–AuNPs–ODN and TdT-based DNA polymerization. To prove their crucial roles, a further verification experiment was designed. In this case, the PSA-specific mAb1 was conjugated on the surface of the M-270 MBs, and then target PSA would be captured and subsequently directly sandwiched and stained with fluorescein-conjugated detection antibodies without further signal amplification. The MBs were also analyzed by FCM and the results are displayed in Fig. 5. Only when PSA reaches a high concentration of 1 ng mL–1 that the response can be unequivocally discerned from the blank control. Therefore, it can be obviously concluded that the integration of mAb2–AuNPs–ODNs with the TdT-based signal amplification has led to a remarkable ∼103-fold enhancement of the detection sensitivity.
Fig. 5. Fluorescence histograms of the M-270 MBs in the presence of different concentrations of PSA by directly using the fluorescein-labeled detection antibody instead of the mAb2–AuNPs–ODN without any signal amplification mechanism.
Specificity evaluation of the TdT-FCI
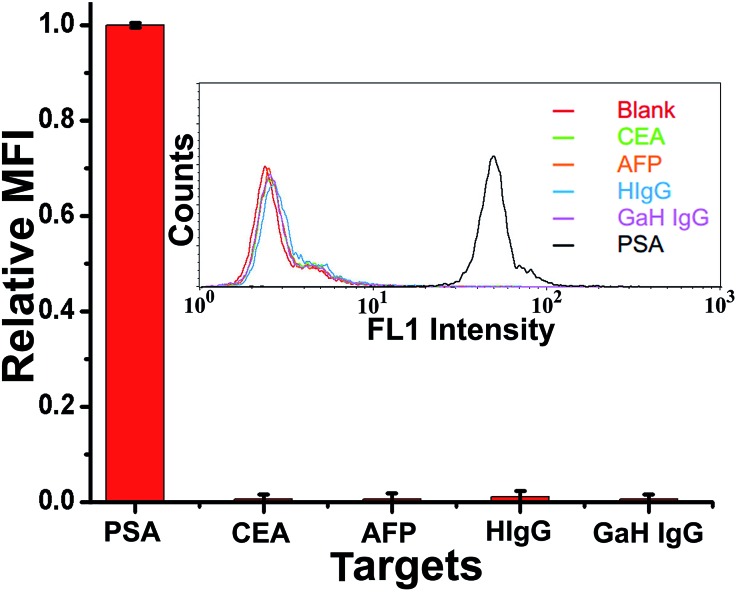
To evaluate the specificity of the proposed TdT-FCI strategy for PSA detection, we challenge the system with other potential interfering substances, including AFP, CEA, human IgG (HIgG), and goat-anti-human IgG (GaH IgG), by using PSA-specific mAb1 and mAb2–AuNPs–ODN. One can see from Fig. 6 that only PSA generates a distinct fluorescence signal while the responses aroused by AFP, CEA, HIgG and GaH IgG are all negligible. The nonspecific signals caused by these interfering components are also less than 1% of the PSA-produced signal. These results clearly suggest the ultrahigh selectivity of the TdT-FCI, which can be applied to the detection of PSA in complex biofluid samples with high specificity.
Fig. 6. Investigation of the specificity of TdT-FCI by using PSA-specific monoclonal antibodies. All of the antigens used in this study are 500 pg mL–1 and the fluorescence response of PSA is normalized to be 1. (Inset) The corresponding FCM fluorescence histograms of the MBs treated with different kinds of antigens by using PSA-specific antibodies.
Quantitative detection of PSA levels in serum
To further examine the reliability and practicability of the proposed strategy in potential biomedical application, we have determined the PSA levels in two independent serums from two healthy volunteers in our laboratory. By using the TdT-FCI strategy, the PSA levels in the two serum samples are identified to be 1.97 ng mL–1 (serum 1) and 1.44 ng mL–1 (serum 2), respectively. Meanwhile, the concentrations of PSA in the same serum samples were also monitored by the Hospital of Shaanxi Normal University based on a chemiluminescence platform (ADVIA CentaurCP® PSA Kit), and the measured PSA levels are 1.81 ng mL–1 for serum 1 and 1.30 ng mL–1 for serum 2, respectively, which exhibit acceptable consistency with the results of the TdT-FCI. Such results indicate that this new approach is reliable for the detection of antigen/protein biomarkers in blood or other biofluid samples. Since flow cytometers have been routinely used in the hospitals, the TdT-FCI shows great potential in the field of clinical diagnosis.
Simultaneous detection of multiple antigens based on the bead size-encoding mechanism
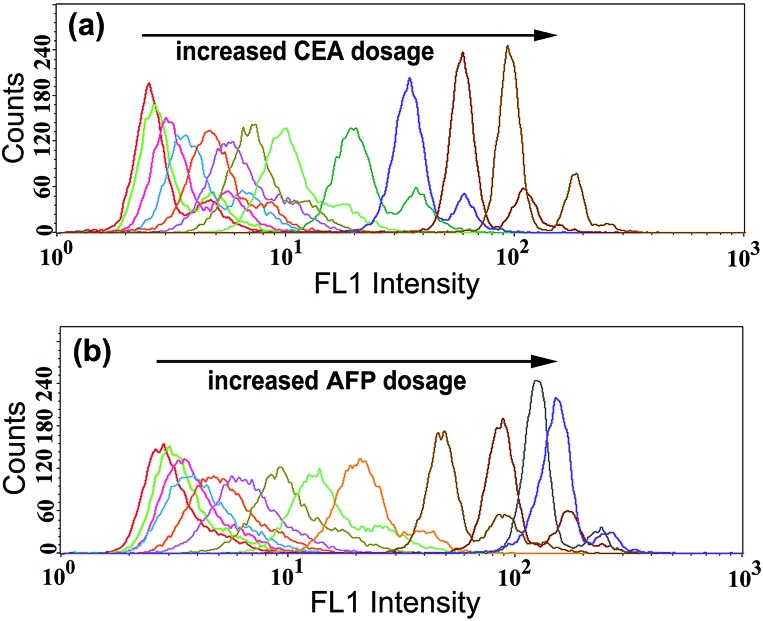
To examine the generality of the TdT-FCI strategy towards the detection of different antigens, we further applied this strategy to the detection of CEA and AFP by use of the corresponding target-specific capture antibodies and detection antibodies. As can be seen from Fig. 7, the MFI value gradually increases with increasing concentration of CEA or AFP, and as low as 5 pg mL–1 CEA or AFP can be clearly detected. The relationships between the MFI values and the concentrations of CEA or AFP are shown in Fig. S4.† These results suggest that the proposed TdT-FCI can be generally applicable to the detection of different antigen/protein biomarkers.
Fig. 7. (a) Fluorescence histograms of the M-270 MBs in the presence of different concentrations of CEA by using CEA-specific antibodies. CEA from left to right: 0 (blank), 5 pg mL–1, 25 pg mL–1, 50 pg mL–1, 100 pg mL–1, 250 pg mL–1, 500 pg mL–1, 1 ng mL–1, 2.5 ng mL–1, 5 ng mL–1, 10 ng mL–1, and 20 ng mL–1, respectively. (b) Fluorescence histograms of the M-270 MBs in the presence of different concentrations of AFP by using AFP-specific antibodies. AFP from left to right: 0 (blank), 5 pg mL–1, 10 pg mL–1, 25 pg mL–1, 50 pg mL–1, 100 pg mL–1, 250 pg mL–1, 500 pg mL–1, 1 ng mL–1, 2.5 ng mL–1, 5 ng mL–1, 10 ng mL–1, and 20 ng mL–1, respectively.
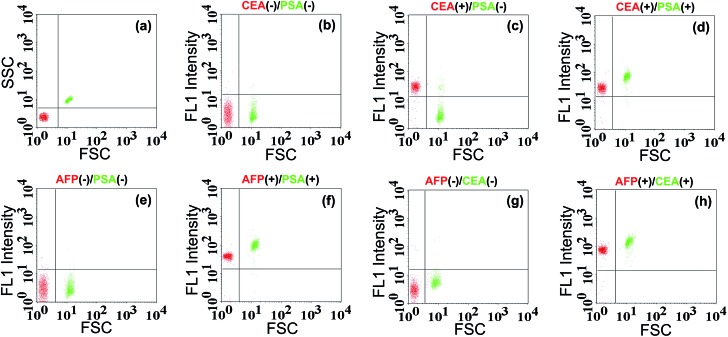
As we know, simultaneous analysis of multiple biomarkers in a limited amount of biological fluid sample is more reliable for biomedical diagnosis. Since the TdT-FCI exhibits high specificity and generality for protein detection, it is further applied to the simultaneous analysis of multiple antigens based on a bead size-encoding principle. In this study, the conceptual experiments are conducted for the simultaneous analysis of two antigens using Myone MBs (1 μm) and M-270 MBs (2.8 μm) as the size-encoding carrier, respectively. Taking the simultaneous detection of CEA/PSA as an example, two kinds of MB and AuNP-based nanoprobes, namely, anti-CEA mAb1-functionalized Myone MBs, anti-CEA mAb2–AuNPs–ODN, anti-PSA mAb1-functionalized M-270 MBs and anti-PSA mAb2–AuNPs–ODN, were prepared respectively. Each reaction contains the two kinds of MBs and the two kinds of AuNPs, and the subsequent immunoreaction, signal amplification and FCM detection procedures were essentially the same as those for PSA analysis. The FSC and fluorescence (FL1) signals were both measured using the flow cytometer. The FSC signals were used for size-decoding of the MBs while the fluorescence signals were recorded for the quantification of antigens. Since both the Myone and M-270 MBs are uniform in size, their FSC and SSC signals are only dependent on their sizes. The FSC vs. SSC plot (Fig. 8a) displays that the 1.0 μm Myone MBs (red color) and the 2.8 μm M-270 MBs (green color) are clearly sorted into two separate populations. So, MBs with a specific diameter can be facilely identified by virtue of their characterized FSC response. When CEA and PSA are both absent, as shown in Fig. 8b, both the Myone MB (CEA) population and M-270 MB (PSA) population display rather weak fluorescence intensity. If only CEA is introduced, only the fluorescence of the Myone MBs is remarkably enhanced while the fluorescence signals of the M-270 MBs could not be obviously influenced (Fig. 8c). Only when CEA and PSA are both present, can the fluorescence of the two bead populations increase obviously together (Fig. 8d). Similarly, the simultaneous detection of AFP and PSA can also be realized in the same manner. Fig. 8e shows that the two populations of Myone MBs (AFP-coded) and M-270 MBs (PSA-coded) both exhibit quite weak fluorescence in the absence of AFP and PSA. When AFP and PSA are both introduced into the reaction, the FL1 intensities of the two MBs populations observably move up (Fig. 8f). Fig. 8g and h exhibit similar results for the simultaneous analysis of AFP and CEA. Therefore, by using FSC for MB size sorting, the TdT-FCI enables the simultaneous analysis of two antigen biomarkers in a single reaction. It should be noted that routine flow cytometers are capable of discriminating beads with 0.5 μm size differences. So, although only conceptional experiments are performed in this work for the simultaneous detection of two targets, it is believable that by rationally employing uniform magnetic beads with varying size, this method is able to afford high multiplexing capability in protein detection.
Fig. 8. The results for simultaneous detection of two antigens by using the bead size-coded TdT-FCI strategy. (a) Scatter plot (FSC vs. SSC) of the bead mixture containing both 1 μm Myone MBs (red color) and 2.8 μm M-270 MBs (green color). (b)–(h) The size-coded scatter plots (FL1 vs. FSC) of the bead mixture treated with different target components (the target combinations are clearly indicated). 10 ng mL–1 AFP, 4 ng mL–1 PSA and 3 ng mL–1 of CEA are used in this study because such values are the recognized detection thresholds for clinical diagnosis, respectively. Other experimental conditions: TdT, 1 U; dTTP, 1 mM; FAM-poly(A)25, 5 μM.
Conclusions
In summary, for the first time we have combined the sandwich immunoreaction with TdT-based on-bead signal amplification and robust FCM to establish a versatile TdT-FCI for the highly sensitive detection of protein/antigen biomarkers. Due to the unique template-free and sequence-independent merits of the TdT-catalyzed DNA extension, the DNA amplification system in the TdT-FCI is extremely simple compared with the conventional immuno-PCR and immuno-RCA. Despite the simple design, the TdT-catalyzed efficient signal amplification has pushed the detection limit of PSA down to the sub pg mL–1 level, which is much lower than the clinical threshold of serum PSA concentration for screening potential prostate cancer. More importantly, the sensitivity of TdT-FCI is also sufficiently high for monitoring the serum PSA relapse at extremely low levels after radical prostatectomy. More fascinatingly, based on the powerful multiparameter signal reading capability of FCM, simultaneous analysis of multiple biomarkers can be accomplished in a single reaction with the TdT-FCI by using rationally selected size-coded MBs. It is worth noting that FCM has been commonly used in hospitals, and portable microflow cytometers are also become more and more popular in a wide variety of point-of-use applications, and thus we believe that this TdT-FCI may be of great potential in routine clinical diagnosis as well as in point-of-care testing (POCT).
Conflicts of interest
There are no conflicts to declare.
Supplementary Material
Acknowledgments
This work was supported by the National Natural Science Foundation of China (21622507, 21575086, and 21335005), the Natural Science Basic Research Plan of Shaanxi Province (2015KJXX-22), the Program for Changjiang Scholars and Innovative Research Team in University (IRT_15R43), the Program for Innovative Research Team in Shaanxi Province (No. 2014KCT-28) and the Fundamental Research Funds for the Central Universities (GK201802016).
Footnotes
†Electronic supplementary information (ESI) available. See DOI: 10.1039/c8sc02752h
References
- Gubala V., Harris L. F., Ricco A. J., Tan M. X., Williams D. E. Anal. Chem. 2012;84:487–515. doi: 10.1021/ac2030199. [DOI] [PubMed] [Google Scholar]
- Zhang W.-H., Ma W., Long Y.-T. Anal. Chem. 2016;88:5131–5136. doi: 10.1021/acs.analchem.6b00048. [DOI] [PubMed] [Google Scholar]
- Liu X., Dai Q., Austin L., Coutts J., Knowles G., Zou J., Chen H., Huo Q. J. Am. Chem. Soc. 2008;130:2780–2782. doi: 10.1021/ja711298b. [DOI] [PubMed] [Google Scholar]
- Nie H., Liu S., Yu R., Jiang J. Angew. Chem., Int. Ed. 2009;48:9862–9866. doi: 10.1002/anie.200903503. [DOI] [PubMed] [Google Scholar]
- Zhu Y., Wang H., Wang L., Zhu J., Jiang W. ACS Appl. Mater. Interfaces. 2016;8:2573–2581. doi: 10.1021/acsami.5b10285. [DOI] [PubMed] [Google Scholar]
- Li C., Ma J., Fan Q., Tao Y., Li G. Chem. Commun. 2016;52:7850–7853. doi: 10.1039/c6cc02633h. [DOI] [PubMed] [Google Scholar]
- Xu J., Zhou S., Tu D., Zheng W., Huang P., Li R., Chen Z., Huang M., Chen X. Chem. Sci. 2016;7:2572–2578. doi: 10.1039/c5sc04599a. [DOI] [PMC free article] [PubMed] [Google Scholar]
- Diamandis E. P., Yu H., Melegos D. N. Clin. Chem. 1996;42:853–857. [PubMed] [Google Scholar]
- Wu J., Fu Z., Yan F., Ju H. Trends Anal. Chem. 2007;26:679–688. [Google Scholar]
- Shen J., Li Y., Gu H., Xia F., Zuo X. Chem. Rev. 2014;114:7631–7677. doi: 10.1021/cr300248x. [DOI] [PubMed] [Google Scholar]
- Chinen A. B., Guan C. M., Ferrer J. R., Barnaby S. N., Merkel T. J., Mirkin C. A. Chem. Rev. 2015;115:10530–10574. doi: 10.1021/acs.chemrev.5b00321. [DOI] [PMC free article] [PubMed] [Google Scholar]
- Liu R., Wu P., Yang L., Hou X., Lv Y. Mass Spectrom. Rev. 2014;33:373–393. doi: 10.1002/mas.21391. [DOI] [PubMed] [Google Scholar]
- Wang Z., Zong S., Wu L., Zhu D., Cui Y. Chem. Rev. 2017;117:7910–7963. doi: 10.1021/acs.chemrev.7b00027. [DOI] [PubMed] [Google Scholar]
- Rinaldi S., Déchaud H., Biessy C., Morin-Raverot V., Toniolo P., Zeleniuch-Jacquotte A., Akhmedkhanov A., Shore R. E., Secreto G., Ciampi A., Riboli E., Kaaks R. Cancer Epidemiol., Biomarkers Prev. 2001;10:757–765. [PubMed] [Google Scholar]
- Guo J., Wang J., Zhao J., Guo Z., Zhang Y. ACS Appl. Mater. Interfaces. 2016;8:6898–6904. doi: 10.1021/acsami.6b00756. [DOI] [PubMed] [Google Scholar]
- Qu Z., Xu H., Xu P., Chen K., Mu R., Fu J., Gu H. Anal. Chem. 2014;86:9367–9371. doi: 10.1021/ac502522b. [DOI] [PubMed] [Google Scholar]
- Shu J., Qiu Z., Zhou Q., Lin Y., Lu M., Tang D. Anal. Chem. 2016;88:2958–2966. doi: 10.1021/acs.analchem.6b00262. [DOI] [PubMed] [Google Scholar]
- Asati A., Santra S., Kaittanis C., Nath S., Perez J. M. Angew. Chem., Int. Ed. 2009;48:2308–2312. doi: 10.1002/anie.200805279. [DOI] [PMC free article] [PubMed] [Google Scholar]
- Yu R.-J., Ma W., Liu X.-Y., Jin H.-Y., Han H.-X., Wang H.-Y., Tian H., Long Y.-T. Theranostics. 2016;6:1732–1739. doi: 10.7150/thno.16129. [DOI] [PMC free article] [PubMed] [Google Scholar]
- Sun J., Hu T., Chen C., Zhao D., Yang F., Yang X. Anal. Chem. 2016;88:9789–9795. doi: 10.1021/acs.analchem.6b02847. [DOI] [PubMed] [Google Scholar]
- Jin L.-Y., Dong Y.-M., Wu X.-M., Cao G.-X., Wang G.-L. Anal. Chem. 2015;87:10429–10436. doi: 10.1021/acs.analchem.5b02728. [DOI] [PubMed] [Google Scholar]
- Zhou J., Xu M., Tang D., Gao Z., Tang J., Chen G. Chem. Commun. 2012;48:12207–12209. doi: 10.1039/c2cc36820j. [DOI] [PubMed] [Google Scholar]
- Du P., Jin M., Chen G., Zhang C., Jiang Z., Zhang Y., Zou P., She Y., Jin F., Shao H., Wang S., Zheng L., Wang J. Sci. Rep. 2016;6:38114. doi: 10.1038/srep38114. [DOI] [PMC free article] [PubMed] [Google Scholar]
- Nam J.-M., Thaxton C. S., Mirkin C. A. Science. 2003;301:1884–1886. doi: 10.1126/science.1088755. [DOI] [PubMed] [Google Scholar]
- Cheng W., Yan F., Ding L., Ju H., Yin Y. Anal. Chem. 2010;82:3337–3342. doi: 10.1021/ac100144g. [DOI] [PubMed] [Google Scholar]
- Zhang B., Liu B., Tang D., Niessner R., Chen G., Knopp D. Anal. Chem. 2012;84:5392–5399. doi: 10.1021/ac3009065. [DOI] [PubMed] [Google Scholar]
- Li F., Zhang H., Wang Z., Li X., Li X.-F., Le X. C. J. Am. Chem. Soc. 2013;135:2443–2446. doi: 10.1021/ja311990w. [DOI] [PMC free article] [PubMed] [Google Scholar]
- Zong C., Wu J., Liu M., Yan F., Ju H. Chem. Sci. 2015;6:2602–2607. doi: 10.1039/c4sc03809f. [DOI] [PMC free article] [PubMed] [Google Scholar]
- Ali M. M., Li F., Zhang Z., Zhang K., Kang D.-K., Ankrum J. A., Le X. C., Zhao W. Chem. Soc. Rev. 2014;43:3324–3341. doi: 10.1039/c3cs60439j. [DOI] [PubMed] [Google Scholar]
- Chang L., Li J., Wang L. Anal. Chim. Acta. 2016;910:12–24. doi: 10.1016/j.aca.2015.12.039. [DOI] [PubMed] [Google Scholar]
- Niemeyer C. M., Adler M., Wacker R. Trends Biotechnol. 2005;23:208–216. doi: 10.1016/j.tibtech.2005.02.006. [DOI] [PubMed] [Google Scholar]
- Tjong V., Yu H., Hucknall A., Chilkoti A. Anal. Chem. 2013;85:426–433. doi: 10.1021/ac303132j. [DOI] [PubMed] [Google Scholar]
- Liu Z., Li W., Nie Z., Peng F., Huang Y., Yao S. Chem. Commun. 2014;50:6875–6878. doi: 10.1039/c4cc03103b. [DOI] [PubMed] [Google Scholar]
- Wang L.-J., Luo M.-L., Zhang Q., Tang B., Zhang C.-Y. Chem. Commun. 2017;53:11016–11019. doi: 10.1039/c7cc05485h. [DOI] [PubMed] [Google Scholar]
- Yuan Y., Li W., Liu Z., Nie Z., Huang Y., Yao S. Biosens. Bioelectron. 2014;61:321–327. doi: 10.1016/j.bios.2014.05.038. [DOI] [PubMed] [Google Scholar]
- Wang P., Wan Y., Deng S., Yang S., Su Y., Fan C., Aldalbahi A., Zuo X. Biosens. Bioelectron. 2016;86:536–541. doi: 10.1016/j.bios.2016.07.025. [DOI] [PubMed] [Google Scholar]
- Lin D., Mei C., Liu A., Jin H., Wang S., Wang J. Biosens. Bioelectron. 2015;66:177–183. doi: 10.1016/j.bios.2014.10.074. [DOI] [PubMed] [Google Scholar]
- Wang L.-J., Ren M., Liang L., Zhang C.-Y. Chem. Sci. 2018;9:4942–4949. doi: 10.1039/c8sc01641k. [DOI] [PMC free article] [PubMed] [Google Scholar]
- Zhang Y., Wang X.-Y., Zhang Q., Zhang C.-Y. Anal. Chem. 2017;89:12408–12415. doi: 10.1021/acs.analchem.7b03490. [DOI] [PubMed] [Google Scholar]
- Song Y., Cui L., Wu J., Zhang W., Zhang W. Y., Kang H., Yang C. J. Chem.–Eur. J. 2011;17:9042–9046. doi: 10.1002/chem.201101353. [DOI] [PubMed] [Google Scholar]
- Ren W., Liu C., Lian S., Li Z. Anal. Chem. 2013;85:10956–10961. doi: 10.1021/ac4024457. [DOI] [PubMed] [Google Scholar]
- Verma S. K., Amoah A., Schellhaas U., Winterhalter M., Springer S., Kolesnikova T. A. Adv. Funct. Mater. 2016;26:6015–6024. [Google Scholar]
- Piyasena M. E., Graves S. W. Lab Chip. 2014;14:1044–1059. doi: 10.1039/c3lc51152a. [DOI] [PMC free article] [PubMed] [Google Scholar]
- Saeys Y., Gassen S. V., Lambrecht B. N. Nat. Rev. Immunol. 2016;16:449–462. doi: 10.1038/nri.2016.56. [DOI] [PubMed] [Google Scholar]
- Picot J., Guerin C. L., Le Van Kim C., Boulanger C. M. Cytotechnology. 2012;64:109–130. doi: 10.1007/s10616-011-9415-0. [DOI] [PMC free article] [PubMed] [Google Scholar]
- Frens G. Nat. Phys. Sci. 1973;241:20–22. [Google Scholar]
- Stoeva S. I., Lee J.-S., Smith J. E., Rosen S. T., Mirkin C. A. J. Am. Chem. Soc. 2006;128:8378–8379. doi: 10.1021/ja0613106. [DOI] [PubMed] [Google Scholar]
- Hill H. D., Millstone J. E., Banholzer M. J., Mirkin C. A. ACS Nano. 2009;3:418–424. doi: 10.1021/nn800726e. [DOI] [PMC free article] [PubMed] [Google Scholar]
- Järås K., Adler B., Tojo A., Malm J., Marko-Varga G., Lilja H., Laurell T. Clin. Chim. Acta. 2012;414:76–84. doi: 10.1016/j.cca.2012.08.009. [DOI] [PMC free article] [PubMed] [Google Scholar]
- Jiang X., Cheng S., Chen W., Wang L., Shi F., Zhu C. Anal. Biochem. 2012;424:1–7. doi: 10.1016/j.ab.2012.02.004. [DOI] [PubMed] [Google Scholar]
Associated Data
This section collects any data citations, data availability statements, or supplementary materials included in this article.


