

 Chemical shifts can be used to predict the conformation of disulfide bonds, greatly improving resolution of solution NMR structures.
Abstract
Cystine residues result from the formation of disulfide bonds between pairs of cysteine residues. This cross linking of the backbone is essential for the structure and activity of peptides and proteins. The conformation of a cystine side chain can be described using five dihedral angles, χ1, χ2, χ3, χ2′, and χ1′, with cystines favouring certain combinations of these angles. 2D NMR spectroscopy is ideally suited for structure determination of disulfide-rich peptides, because of their small size and constrained nature. However, only limited information of the cystine side chain conformation can be determined by NMR spectroscopy, leading to ambiguity in the deduced 3D structures. Resolving accurate structures is important as disulfide-rich peptides have proven to be promising drug candidates in a number of fields, either as bioactive leads or scaffolds. Using a database of NMR chemical shifts combined with crystallographic structures, we have developed a method called DISH that uses support vector machines to predict the dihedral angles of cysteine side chains. It is able to successfully predict χ2 angles with 91% accuracy, and has improved performance over existing prediction methods for χ1 angles, with 87% accuracy. For 81% of cysteine residues, DISH successfully predicted both the χ1 and χ2 angles. By revisiting published solution structures of peptides determined using NMR spectroscopy, we assessed the impact of additional cystine dihedral restraints on the quality of 3D models. DISH improved the resolution and accuracy, highlighting the potential for improving the understanding of structure–activity relationships and rational development of peptide drugs.
Introduction
Disulfide bonds are essential for both the structure and activity of proteins.1–3 They are formed by the oxidation of two thiol groups from two cysteine residue side chains, resulting in a covalent bond between the two sulfur atoms and the creation of a cystine residue. Cystines can be classified as either structural or functional; structural cystines increase the rigidity of a structure by cross linking the backbone whilst functional residues undergo reduction/oxidation to either generate reactive thiol groups or induce structural change causing functional activation (referred to as allosteric cystines).4–7
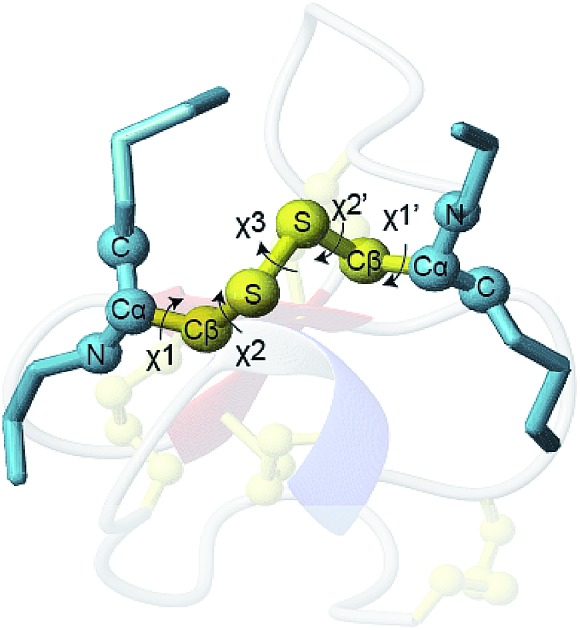
The conformation of a cystine side chain is described by five dihedral angles: χ1, χ2, χ3, χ2′, and χ1′ (Fig. 1). First reported by Richardson (1981), it has since been extensively shown that cystines favor particular configurations based on different combinations of the five dihedral angles.7–10 It has also been shown that the configuration of structural cystines can be influenced by the local secondary structure of the protein, particularly for cystines cross linking β-strands.11,12 The functional significance of the cystine configuration was highlighted by Schmidt and Hogg (2006), successfully identifying key allosteric cystine residues after the observation that they adopt a single high-energy configuration known as a right handed staple.
Fig. 1. (a) The five dihedral angles of a cystine residue side chain: χ1, χ2, χ3, χ2′, and χ1′ (b–d) distribution of χ angles of 3342 cystine residues. Angles were binned to the nearest 5°. X-Axis is the dihedral angle in degrees (°) and the Y-axis is the frequency in the database. Green areas indicate the dihedral angle ranges used to define three angle classes, χ1 (and χ1′), χ2 (and χ2′) and χ3.

For the disulfide-rich peptides, cystine residues are structural, dictating both the overall fold and the rigidity. Due to their small size, high solubility and restrained nature disulfide-rich peptides are ideal candidates for structure determination by two-dimensional (2D) Nuclear Magnetic Resonance (NMR) spectroscopy. The determination of a protein or peptide structure using NMR spectroscopy involves computational generation of conformations that satisfy a range of distance and angle restraints determined from spectroscopic measurements.13 These restraints include inter-proton distances, hydrogen bonds and dihedral angles of both backbone and side chains. The power of these methods for disulfide-rich peptides is highlighted by the fact that of the 177 experimental three-dimensional (3D) structures resolved of conotoxin to date, 166 have been derived from solution NMR data.14
NMR-derived data can be used to give some information on amino acid residue dihedral angles.15–19 The Karplus equation establishes a relationship between the dihedral angles and the 3JH–H coupling constants of vicinal protons.20,21 In practice, this is most often applied to the relationship between the 3JHα–HN and the backbone φ angle. This method relies on accurate empirical parameterization of the Karplus equation, and often the measurement of 3JH–H coupling constants in peptides is hampered by overlap and line shapes. The side chain χ1 dihedral angles can also be obtained by analyzing the 3JHα–Hβ coupling patterns in the exclusive correlation spectroscopy (E.COSY) spectrum and the intensities of HN–Hβ nuclear Overhauser effect spectroscopy (NOESY) peaks.17,22 However this method can be subjective and time-consuming, and is also often hindered by the overlap of peaks. The common sulfur isotope 32S has a nuclear spin of zero and the low abundant 33S isotope is quadrupolar with a spin of 3/2, resulting in broad line shapes incompatible with NMR experiments. Therefore, no NMR data can be used to directly and reliably measure the χ2 and χ3 angles of cystine residues. We note that isotopically labelled Cys residues (2R,3RS)-[β-13C; α,β-2H2] can be used to determine the conformation of cystine side chains from NOE intensities.23 Nevertheless, this method is not routinely applicable because it is expensive and requires recombinant expression of peptides, negating one of the key advantages of working with peptides compared to proteins. In contrast, with the availability of the highly sensitive modern cryoprobes chemical shifts for 15N and 13C can generally be determined using the natural abundance in synthetic and isolated naturally occurring peptides.
Several machine learning approaches, such as TALOS-N, DANGLE and PREDITOR predict backbone φ and psi (ψ) angles as well as side chain χ1 angles using the influence of local protein structure on NMR chemical shifts.19,24–28 TALOS-N and PREDITOR achieve ∼90% accuracy for backbone dihedral prediction, but their ability to predict χ1 angle of Cys residues is limited. TALOS-N only predicts the χ1 angle of less than 50% of all Cys residues.27 PREDITOR has an overall accuracy of 84% across all residue types however performance is reduced if the protein is β-sheet rich, a motif that is common in disulfide-rich families such as the cyclotides.28,29 To our knowledge there are no computational programs that predict the χ2 angles of any amino acid residues based on NMR data.
The conformation of cystine side chains in solution structures determined from NMR data is not imposed from specific experimental data but result from the simulated annealing protocols implemented in the programs CYANA that calculates structures in torsion angle space or CNS that uses both torsion angle and Cartesian space.30,31 As a result, the distribution of cystine dihedral angles in NMR solution structures are considered less accurate than those observed in X-ray structures.32,33 This inaccuracy in the structure of cystine residues, which are major determinant of the overall 3D structure of peptides, represents a major limitation to the determination of peptide solution structure by 2D NMR. This study aimed at using a machine learning approach to draw a correlation between easily accessible NMR measurements and the conformation of cystine residues, allowing accurate prediction of cystine residue structures and improvement of peptide and protein structures determined by 2D NMR.
The side chain χ1 angle is known to influence the backbone chemical shifts, however defining a definitive average is hindered by the common occurrence of rotameric averaging.26,34,35 There has been no specific investigation focusing on cystine residue side chains and chemical shifts. Cystine residues span peptide backbone and they consequently have twice the number of backbone chemical shifts compared to other residue types. Because cystines favor particular configurations and are generally restrained elements, we hypothesized a correlation between cystine dihedral angles and Cys chemical shifts.8 Gathering information on peptides studied both by NMR spectroscopy and high-resolution X-ray crystallography, a cystine specific database incorporating experimental chemical shifts and dihedral angles was built. Using this database, we developed a support vector machine (SVM) referred to as DISH (di-sulfide and di-hedral prediction) to predict the χ1 and χ2 angles of Cys residues. DISH is the first reported prediction algorithm of cystine χ2 angles, and it displays a greater accuracy for χ1 angle prediction compared to existing methods. Several examples highlight how including restraints suggested by DISH could improve the structural resolution of disulfide-rich peptides calculated with CNS.
Experimental section
Disulfide bond database generation
A cystine specific database was derived from the TALOS-N protein structural database (talos.obcCS) composed of 580 high-resolution X-ray protein structures that have additionally been experimentally studied by 2D NMR.27 This TALOS-N database catalogues the experimental 15N, 13C, 13Cα, 13Cβ, 1Hα and 1HN secondary chemical shifts of each residue. The corresponding coordinates file were downloaded from the Protein Data Bank (PDB).36 TALOS-N provides a second and larger protein structural database (talos.tab) where chemical shifts of proteins have been predicted using the program SPARTA+.27,35 However SPARTA+ shows poor predictive performance for 13C chemical shifts of cystine residues and was considered incompatible with our aims.18,35
The backbone and side chain dihedral angles of Cys residues were measured in the X-ray structures and were combined with the chemical shifts found in the TALOS-N dataset to yield a “Cys database” of 210 Cys residues. The Cys database also records the two residue types that flank the Cys residues, as well as their backbone dihedrals and chemical shifts. Cys residues that are located at the termini of the peptides were excluded from this dataset, consistent with approaches of other dihedral prediction programs.37 If a chemical shift was unassigned it was defined as the average chemical shift for that nucleus in the database in parts per million (ppm).
Side chains, whatever the residue type, typically adopt particular conformations. For cysteine residues the χ1 and χ2 angles are generally described as either gauche+ (+60°), gauche– (–60°) or trans (180°), whereas χ3 angles are classified as either right (+90°) or left handed (–90°).8,12
Fig. 1 shows the distribution of these three χ angles for >3000 disulfides bonds found in high resolution X-ray crystal structures. Most χ1 and χ3 angles of cystine residues can be classified by defining the range of the dihedral classes within the boundaries ±30°. The distribution of χ2 angles of cystine residues can be divided into three main classes defined as gauche+ (+75° ± 45), gauche– (–75° ± 45) and trans (180° ± 30). The dihedral angles in our Cys database where classified in these χ categories, and the 19 cystine residues for which the dihedral angles fall outside of the class ranges were excluded. The DSSP program was used to extract the secondary structure of Cys residues from the PDB file, and categorized it as either helix, strand or loop; consistent with the classification system of TALOS-N predictions.38,39 The final Cys database contains information on 86 cystine residues from 46 different coordinate files. The structural and chemical information stored in the Cys database is shown below:
(1) The PDB identifier, which is unique for each coordinate file.
(2) Cys position 1- [residue number, chain, φ and ψ angles, 15N, 13C, 13Cα, 13Cβ, 1Hα, 1HN secondary chemical shifts (ppm)].
(3) Neighboring residues of position 1- [residue number, chain, φ and ψ angles, 15N, 13C, 13Cα, 13Cβ, 1Hα, 1HN secondary chemical shifts (ppm)].
(4) Cys position 2- [residue number, chain, φ and ψ angles, 15N, 13C, 13Cα, 13Cβ, 1Hα, 1HN secondary chemical shifts (ppm)].
(5) Neighboring residues of position 2- [residue number, chain, φ and ψ angles, 15N, 13C, 13Cα, 13Cβ, 1Hα, 1HN secondary chemical shifts (ppm)].
(6) Dihedral angles values and classes [χ1, χ2, χ3, χ2′, χ1′].
(7) Secondary structure array [helix, strand, coil].
Support vector machine prediction
SVMs were developed for the prediction of χ1 and χ2 angles using as inputs chemical shifts and backbone dihedral angles. We chose to use SVMs compared to other machine learning approaches because of their proven performance in protein secondary structure prediction and global solution approach.40–43 The python library scikit-learn was used for SVM implementation.44 During the SVM training step, a set of hyperplanes are optimized for optimal separation between data points with the shape of the hyperplanes described by the SVM kernel function. Scikit-learn provides common kernel functions including linear, sigmoid, polynomial and the radial basis function (RBF).45 Two parameters were optimized during SVM training: the regularization parameter C, which controls how stringent the algorithm is with outliers and the gamma (γ) value, which dictates what training examples influences the hyperplane boundary.45 All kernel types were tested and the γ and C values were optimized for each kernel; the RBF providing the greatest predictive power. The RBF kernel has also been shown to be the most effective kernel for complex problems, such as secondary structure prediction.37,40 Methods such as balancing the dataset using synthetic minority over-sampling technique and edited nearest neighbors as well as standardization and variance scaling of data were also employed, however they did not to improve predictive performance.44,46,47
Due to the small database size, the predictive power of each SVM was evaluated using a leave-one-out method. In this instance a single Cys residue was selected for testing, whilst all remaining inputs were used for training of the classifier. A grid search between 2–15 and 23 for γ and 2–5 to 215 for C parameters was used before refinement to find optimal values.48 The Matthews correlation coefficient (MCC) was used to assess the performance of each stage.49 Final inputs, parameters and workflow are shown in Fig. 2.
Fig. 2. Workflow of the DISH method. The prediction of each χ angle uses a two level SVM. The workflow details the input values as well as the optimized γ and C SVM parameters.

χ1 angle prediction
A two-level SVM was developed for the prediction of χ1 angles (SVM-χ1). For each cystine the two hemi-cystine residues were considered separately, with the hemi-cystine residue with the χ1 dihedral of interest defined as Cys-1 and the other designated as Cys-2. The first-level SVM classifies χ1 angles as gauche+ or ‘other’ (i.e. gauche– or trans). The ‘other’ category is then further classified using the second level SVM as either gauche– or trans. For both levels the output was classified as discrete class labels, 0 and 1. Inputs included chemical shifts and dihedral angles from both Cys-1 and Cys-2 as well as the van der Waals volume of neighboring residues of Cys-1. The van der Waals volume was defined as the volume enclosed by the sum of the van der Waals radii for all atoms in a residue.50 Each level was more sensitive to a set of inputs, which are given in Fig. 2.
χ2 angle prediction
A two-level SVM predictor was also developed to predict χ2 angles (SVM-χ2), with the first level categorizing χ2 as either gauche– or ‘other’ (i.e. gauche+ or trans) and the second level sub-classifying the ‘other’ class into either gauche+ or trans. The optimal inputs were found to differ from that of SVM-χ1 but the testing of parameters and evaluation of predictive performance was the same as that previously described (Fig. 2). Initially only chemical shifts and the Cys secondary structure were tested as inputs for both SVM-χ1 and SVM-χ2. Whilst a relatively accurate performance was recorded, inclusion of backbone and side chain dihedral angles as inputs was shown to significantly improve the MCC values during validation and therefore included in the final program (Tables S1 and S2†).
Simultaneous χ1 and χ2 prediction
The SVM-χ1 and SVM-χ2 modules were combined to form the final framework for DISH. The χ1 angle predicted by the SVM-χ1 module was subsequently used as an input for SVM-χ2 (Fig. 2). The accuracy of the program was based on the number of hemi-cystine residues where both χ1 and χ2 angles were successfully predicted.
Evaluation of structures
We finally exemplified the use of DISH by revisiting some recently published peptide structures determined using NMR spectroscopy. The performance of DISH and the effect of adding its predicted restraints to 3D structures computations were evaluated on three examples: the anti-microbial Ep-AMP1 peptide from the Echinopsis pachanoi cactus species (PDB ; 2mfs), the immunomodulator barrettide A peptide from the marine sponge Geodia barretti (PDB ; 6cfb) and an engineered cyclic conotoxin cyc-PVIIA from Conus penaceus (PDB ; 2n8e).51–53 The 3D structures for all peptides have been resolved by 2D NMR spectroscopy and chemical shifts obtained in these studies were used as inputs for the DISH program.
The backbone dihedral angles were predicted from these shifts using the TALOS-N program.27 TALOS-N provides a three tier category ranking the strength of prediction for each residue. For DISH, only backbone angles with the highest level of confidence, “strong”, were repurposed as inputs. For all other Cys residues the original structure was consulted and the φ and ψ inputs were based on the average of the observed backbone conformation. This approach is consistent with the general experimental process of resolving a structure by 2D NMR. Initial structures are calculated with restraints derived directly from experimental data, such as proton distances. Computationally predicted or ambiguous restraints are then compared to see if they are consistent with these initial structures before their inclusion. Therefore it is proposed that the restraints from DISH are incorporated in the later stages of structure calculations as a method to further refine the structures. The predicted secondary structure of cysteines from TALOS-N was also used as an input, and incorporated as a hot array as either a helix, strand or loop.
The 3D structures were calculated in CNS using the previously reported proton-distances, hydrogen bonds and dihedral restraints and the additional χ1 and χ2 angles calculated in DISH.31 Fifty structures were generated, and the 20 models with the lowest energies and covalent geometry quality as evaluated by MolProbity were selected and figures generated using MOLMOL.54–56 The 20 models that were reported (without using DISH results) were also re-evaluated using the current version of MolProbity.55 In addition the χ1 predictions of DISH were compared to the reported NMR data of the two spider toxins, ProTx-II from Thrixopelma pruriens (PDB ; 2n9t) and μ-TRTX-Pn3a (Pn3a) from Pamphobeteus nigricolor (PDB ; 5t4r) and the conotoxin from Conus geographus G117 (PDB ; 6cei) for which the cystine residue χ1 angles were suggested through an analysis of E.COSY data.57,58
We further evaluated the effect of additional Cys χ restraints on the overall accuracy of NMR structures. The structure of the 129-residue hen egg-white lysozyme (from the Gallus gallus) has been well characterised and resolved by both X-ray crystallography (PDB ; 1iee) and NMR with residual dipolar couplings (RDCs) (PDB ; 1e8l).59,60 RDCs provide orientation information for individual bond vectors relative to the overall tensor of a protein. This information does not rely on local interactions and thus provides an overall greater accuracy to structures resolved by NMR. The hen egg-white lysozyme is included as a training example in DISH. Based on the predictions for the four Cys residues in the ‘leave-one-out method’, we compared two NMR structures; one that had been calculated with no Cys χ restraints and the other with the predicted DISH Cys χ1 and χ2 dihedrals. The reported distance, dihedral and hydrogen bond restraints from PDB ; 1e8l were used to calculate structures in CNS.31,60 A total of 200 conformers were initially annealed and the lowest 20 energy selected for final representation. The program PALES was then used to predict the N–HN RDCs for the structures and compared to the experimental values.61 The calculated structures were also compared to the deposited X-ray structure.
Results and discussion
Each of the two stages of the SVM-χ1 predictor were evaluated independently: stage I gave an MCC of 0.89, corresponding to only 2 angles out of 172 incorrectly classified; and stage II gave an MCC of 0.70. The overall accuracy of the two stages of SVM-χ1 was 87%. The accuracy for each of the χ1 classes is shown in Table 1.
Table 1. The MCC for each stage and final accuracy for χ1 and χ2 angle prediction by DISH from a ‘leave-one-out’ evaluation.
| gauche– | gauche+ | trans | |
| Number of χ1 angles correctly predicted | 104 | 9 | 37 |
| Total number of χ1 angles | 113 | 10 | 49 |
| Accuracy (%) | 92.0 | 90.0 | 75.5 |
| Number of χ2 angles correctly predicted | 109 | 31 | 16 |
| Total number of χ2 angles | 111 | 40 | 21 |
| Accuracy (%) | 98.2 | 77.5 | 76.2 |
a χ1 is an input of stage II and was measured in the crystal structure for this test.
bAccuracy was measured by serially using stages I and II.
DISH SVM-χ1 improved upon χ1 predictions for cystine residues made with TALOS-N and PREDITOR. The TALOS-N program has a >90% accuracy for its χ1 predictions, but it only returns a prediction for less than 50% of all tested Cys residues, whereas DISH returns an 87% accuracy for all the tested hemi-cystine residues. DISH has a slightly better accuracy than PREDITOR for χ1 prediction, which has an 84% accuracy across all residues. Importantly, PREDITOR makes its predictions using information from homologous proteins, whereas DISH does not have such requirement, making DISH more generally applicable.
For the SVM-χ2 module one of the inputs is the χ1 angle, and SVM-χ2 was initially tested using the χ1 angle determined from the crystal structure. The stage I and II of SVM-χ2 both had an MCC of 0.85 (Table 1). Combining the two stages, SVM-χ2 had an accuracy of 91%. The performance for individual χ2 angle classes is shown in Table 1. The SVM-χ1 and SVM-χ2 modules were then combined, i.e. the χ1 predicted from SVM-χ1 was used as input for SVM-χ2, resulting in 81% of all hemi-cystine residues having both χ1 and χ2 classes correctly predicted.
Scores of predictions
The Platt scaling method, as implemented in the scikit-learn modules, was used to compute the confidence score of the predictions.44 The output values of an SVM should be correlated to the probability of the prediction being true, i.e. the accuracy. The Platt method fits the output values to the accuracy, providing a confidence score for each possible class, with the combined scores totalling 1.0. Practically the scores are computed by considering the accuracy of all the predictions with output values above a certain cut-off, providing the confidence score for this cut-off. As the final confidence scores vary depending of the order of the leave-one-out, the fit for each cut-off was averaged over ten leave-one-out procedures. The relationship between accuracy of the predictions and the output values was established individually for the SVM-χ1 and SVM-χ2 modules. A score for the simultaneous prediction of χ1 and χ2 angles was determined by considering the output values as the product of the outputs of the SVM-χ1 and SVM-χ2 modules (Fig. 3).
Fig. 3. Correlations between the expected accuracy of predictions (confidence score) and the SVM output values for (a) χ1 × χ2 predictions, (b) χ1 predictions and (c) χ2 predictions. The accuracies were estimated using the leave-one-out method and correlations with output values were computed using the Platt scaling method. The frequency of predictions with output values above a cut-off is indicated in red. Each plot represents the mean with error bars showing standard deviation of ten (n = 10) rounds of Platt scaling on all the data. The dashed line represents the overall accuracy for 100% of the frequency.

Fig. 3 shows the relationship between the confidence scores and the output values from the SVMs. SVM-χ1 and SVM-χ2 have constantly high accuracy, and the predicted scores are therefore consistently high for all output value cut-offs. A slight increase of confidence score is observed as the output values increase (Fig. 3b and c). For simultaneous χ1 and χ2 prediction the confidence score increased almost exponentially with the output values. Notably, 31% of all hemi-cystine residues in the test set resulted in an output value larger than 0.75 and an expected accuracy of ∼90%. This frequency is to be compared to the overall accuracy of 81%. For probabilities greater than 0.75 high variability in the accuracy score was observed due to the small sample size, and therefore are not shown.
Cyc-PVIIA
Cyc-PVIIA peptide is a backbone cyclic variant of the conotoxin κ-PVIIA, which a potassium channel blocker isolated from C. penaceus.53 This peptide displays a knotted arrangement of three disulfide bonds, known as an inhibitory cystine knot. The published NMR solution structure of cyc-PVIIA (PDB ; 2n8e) displays two areas of large backbone conformational flexibility: loop 2 (between residues Cys8–Cys15) and the cyclizing linker region. Molecular simulations predicted that cyc-PVIIA was less flexible in loop 2 compared to the native κ-PVIIA,53 but the loop 2 region of κ-PVIIA adopts a significantly more restrained configuration in its solution structure than that of cyc-PVIIA.53 This apparent discrepancy suggests that the conformational heterogeneity displayed in the NMR models of cyc-PVIIA arise from a lack of distance restraints rather than from flexibility. Therefore, cyc-PVIIA is an interesting example for testing if the additional restraints from DISH could influence ambiguous backbone conformations.
Cys χ1 angles had been derived from analysis of NMR experimental data and they were included as restraints to generate the published solution structure of cyc-PVIIA.53 All DISH predicted angles shown in Table 2 were used as input restraints for structure calculations in CNS30 with the exception of the χ2 of Cys20, which diverged from the experimental data. The inclusion of the χ1 and χ2 cystine restraints resulted in a better defined loop 2 region, as shown in Fig. 4. Interestingly, the linker region was also slightly better defined. The overall backbone and heavy atom RMSDs were also significantly decreased after inclusion of the additional restraints (Table 3). The revised structure of cyc-PVIIA is in better agreement with theoretical molecular simulations.53 Assessing the quality of the revised structure using MolProbity shows a slight reduction in the overall quality of the score. This is likely to be due to the large rearrangements in the final structure clashing with the original experimental restraints such as inter-proton distances. Normally during a structural determination process these conflicts can be resolved though re-evaluation of the experimental data with the additional knowledge of the structure.
Table 2. The Cys residues of cyc-PVIIA and χ1 angles calculated from the E.COSY spectrum, χ1 angles predicted by TALOS-N and the χ1 and χ2 angles predicted by DISH, either gauche+ (g+), gauche– (g–) or trans (t).
| Residue | χ E.COSY | χ1 DISH | χ2 DISH |
| 1 | — | — | — |
| 8 | g+ | g+ | g+ |
| 15 | g– | g– | g– |
| 16 | — | g– | g– |
| 20 | — | t | t a |
| 26 | — | g– | g– |
aAs DISH was not in agreement with reported experimental data restraints or were found to violate were not included in the new structure calculation.
Fig. 4. Comparison of the backbone conformation of the 20 lowest energy models of cyc-PVIIA computed using CNS without DISH predictions (PDB 2n8e; in blue) and with DISH predictions (in pink). Cystine side chains are in yellow sticks.

Table 3. Structural statistics of the 20 lowest energy structures of cyc-PVIIA and the re-evaluated structure with additional χ1 and χ2 restraints calculated using simulated annealing procedures in CNS a .
| Original | Additional χ1 and χ2 | |
| Clash score b | 6.1 ± 2.7 | 11.8 ± 4.7 |
| Poor rotamers | 1.1 ± 1.0 | 0.05 ± 0.22 |
| Ramachandran outliers | 0.0 ± 0.0 | 0.45 ± 0.61 |
| Ramachandran favoured (%) | 95.5 ± 4.0 | 89.9 ± 5.1 |
| MolProb. score c | 1.9 ± 0.33 | 2.1 ± 0.18 |
| Percentile (%) d | 79.3 ± 15.5 | 69.8 ± 9.8 |
| Residues with bad bonds | 0.2 ± 0.45 | 0.6 ± 0.68 |
| RMSD (Å) (residues 3–8, 15–27) | ||
| Mean global backbone | 0.91 ± 0.25 | 0.61 ± 0.18 |
| Mean global heavy | 1.78 ± 0.26 | 1.52 ± 0.26 |
| RMSD (residues 1–34) | ||
| Mean global backbone | 1.65 ± 0.31 | 1.29 ± 0.35 |
| Mean global heavy | 2.42 ± 0.30 | 2.24 ± 0.48 |
aDefinition of MolProbity structural statistics.55
bThe number of non-donor–acceptor atoms that overlap by more than 0.4 Å per 1000 atoms.
cOverall quality of protein statistics. Log weighted combination of the clash score, percentage Ramachandran not favoured and percentage of bad side chain rotamers. Reflects the crystallographic resolution for structures that those values would be expected.
d100th percentile is the best among structures of comparable resolution; 0th percentile is the worst.
Ep-AMP1 and barretide A
The performance of DISH and influence of additional cystine restraints on experimental solution structures was further evaluated on the Ep-AMP1 and barretide A peptides. Ep-AMP1 is an antimicrobial peptide expressed by E. pachanoi (San pedro cactus). It has three disulfide bonds forming an inhibitor cysteine knot.51 The χ1 angles of three out of the six hemi-cystines have been determined via analysis of coupling constants determined from an E.COSY spectrum and intra residual NOE patterns.51 Barretide A is a peptide from the marine sponge G. barretti and has been shown to inhibit secretion of cytokines. This peptide contains two disulfide bonds and two anti-parallel β-strands, which form an elongated β-sheet. The Hα secondary chemical shift analysis suggested that the termini are highly flexible.52 The published solution structure displays a disordered conformation of the side chain and backbone of the cystine 5–23 residue, contrasting against the secondary shifts of the Cys residues and its neighbours that suggest a defined structural region.
Using the published chemical shifts, we predicted the values of the χ1 and χ2 angles of all cystine residues using DISH. Both structures were calculated using the previously derived restraints and additional χ1 and χ2 angles in CNS (Tables S3 and S4†).31,51,52 For Ep-AMP1, there was a significant reduction in the backbone RMSD of the lowest energy structures, from 0.86 Å to 0.55 Å.
Practically, the conformation of two loops were better defined when using the restraints on χ2 angles (Fig. S1†). There were no significant changes in the overall final MolProbity score. Some reductions in structural violations such as Ramachandran outliers (from an average of 0.25 to 0.00) were observed in the re-evaluated structure (Table S5†). These were however balanced by a small increase in the clash score and without reanalysing the NOESY spectra no adjustments could be made to distance restraints between protons. For barretide A again the inclusion of χ2 angles resulted in a decrease in the backbone and heavy atom RMSD among the lowest energy models (Fig. S2†). No major differences in the MolProbity statistics were observed for this peptide, confirming that the new dihedral constraints were fully compatible with all previous data (Table S6†).
ProTx-II, Pn3a and G117
The gauche– conformation of χ1 angles of cystine residues is by far the most populated, thus to further evaluate DISH we tested its performance on additional peptides for which the χ1 angles have been analysed by NMR data. The ProTx-II (PDB ; 2n9t), Pn3a (PDB ; 5t4r) and G117 (PDB ; 6cei) toxins are three peptides that display all three possible cystine χ1 configurations (gauche+, gauche– and trans) based on reported analysis of the E.COSY spectra.57,58 DISH successfully predicted 7 out of 7 χ1 angles for G117 and four out of five for ProTx-II and Pn3A. This resulted in a total of 15 out of 17 angles based on reported values from E.COSY analyses (Table 4).
Table 4. The Cys residues of ProTx-II, Pn3A and G117 and χ1 angles calculated from the E.COSY spectrum, χ1 angles predicted by TALOS-N and the χ1 and χ2 angles predicted by DISH.
| ProTx-II | χ1 E.COSY | χ1 DISH | χ1 TALOS-N | χ2 DISH |
| 2 | — | g– | — | g– |
| 9 | g+ | g– | — | g– |
| 15 | g– | g– | g– | g– |
| 16 | g– | g– | — | g– |
| 21 | t | t | t | t |
| 25 | g– | g– | — | g– |
| Pn3A | ||||
| 2 | g+ | g– | — | g– |
| 9 | — | g– | — | g– |
| 15 | g– | g– | g– | g– |
| 16 | g– | g– | g– | g– |
| 21 | t | t | t | g+ |
| 28 | g– | g– | — | g– |
| G117 | ||||
| 8 | g+ | g+ | — | g+ |
| 14 | g– | g– | — | g– |
| 15 | g– | g– | — | g– |
| 19 | g– | g– | — | g– |
| 20 | t | t | — | g+ |
| 24 | g– | g– | — | g– |
| 31 | g– | g– | — | g– |
Hen egg-white lysozyme
The hen lysozyme is an extensively studied structure and was used to show how additional Cys χ1 and χ2 restraints can not only refine, but also improve the accuracy of NMR structures. Both NMR data with RDCs and X-ray crystallography have been used to resolve the structure of this 127 residue protein with 4 cystines.59,60 Based on predictions in which the structure had been removed from the training database and used as a testing example, DISH predicted the correct χ1 and χ2 angles for all 8 Cys residues (Table S7†). Two separate structures were calculated in CNS, with and without Cys χ dihedral restraints (DISH predictions). The accuracy of the two structures were initially evaluated by comparison to the X-ray structure (Table S8†). The RMSDs relative to the crystal structure were 1.55 ± 0.28 Å and 1.73 ± 0.27 Å for the structures with and without DISH restraints, respectively. The improvement is particularly evident around the cysteine residues. When including the DISH predictions the RMSD for Cys heavy atoms was 0.87 ± 0.18 Å, as opposed to 1.32 ± 0.32 Å without DISH predictions.
The influence of DISH restraints was further evaluated by comparing computationally predicted and experimental RDCs. The PALES software was used to predict the N–HN RDCs for each of the 20 NMR structures and these values were compared to experimental ones, which were recorded in 5% DMPC:DHPC.60,61 The final difference was taken as the average across the 20 structures. Comparing the 8 Cys, an overall reduction in the difference between computed and experimental RDCs can be observed across the 20 structures when calculated with DISH predictions (Fig. 5). The above evidence supports that Cys χ1 and χ2 restraints increase the accuracy of NMR structures, particularly around the Cys residues themselves.
Fig. 5. The mean (error bars representing standard deviation) of the absolute difference between experimental N–HN RDC values and those predicted by PALES (n = 20). Two sets of structures for the hen lysozyme were calculated in CNS, with Cys χ1 and χ2 restraints and those without the statistical test being used to compute the P-values: (unpaired Student's t-test). *P < 0.05, **P < 0.005, ***P < 0.0005.

Significance for rational drug design development
Thanks to the presence of cross bracing covalent bonds, disulfide-rich peptides display highly ordered structures despite their small size. They have diverse biological functions, including in neurological signalling, plant and animal hormonal signalling, as defense peptides, or as potent toxins for capture of prey, as in the venom of cone snails, spiders and snakes.62–64 Many of these peptides are desirable drug candidates due to their high potency and selectivity, and have also attracted interest as potential drug scaffolds that could stabilize potent but vulnerable small peptides.65–67 Peptides fill a gap between the large biologics and the small molecule drugs, and are promising therapeutics because they are large enough to be specific and target protein–protein interactions, but are small enough to be chemically synthesized, allowing modifications of their activity through the use of non-natural amino acids and cyclisation.68 The determination of 3D structures of peptides, a key step in any structure–activity relationships study, can assist the rational development of analogues with improved therapeutic properties. By revising three existing structures with additional dihedral restraints from DISH, we showed here that we were able to significantly improve both the precision and overall quality of 3D structures in solution, a method that we believe will be particularly useful for this rational drug design process.
Conclusions
The DISH program is the first to predict cystine χ2 angles and represents an improvement on existing methods for χ1 predictions based on chemical shift and structural inputs. The predictions were tested using the leave-one-out method, achieving an overall accuracy of 81% for simultaneous prediction of χ1 and χ2 angles for all hemi-cystine residues tested. The positive effect of including additional cystine dihedral angle restraints on peptide structures resolved by 2D NMR was highlighted by revisiting four existing structures where we were able to reduce backbone conformational ambiguity, increase consistency with crystal structures and RDCs and improve overall covalent geometry. It is envisaged that the DISH program will be of important use during the structure determination of novel structures, where defining the cross-linking cystine configurations will reduce the reliance of assignment of NOESY peaks, a process hindered by overlap. The program and source code is available to the NMR community at ; https://github.com/davarm/DISH_prediction based on a simplified user input system.
Conflicts of interest
There are no conflicts to declare.
Supplementary Material
Acknowledgments
DAA was supported by an Australian Postgraduate Award. KJR was supported by an Australian Research Council Future Fellowship (FT130100890).
Footnotes
†Electronic supplementary information (ESI) available. See DOI: 10.1039/c8sc01423j
References
- Gehrmann J., Alewood P. F., Craik D. J. J. Mol. Biol. 1998;278:401–415. doi: 10.1006/jmbi.1998.1701. [DOI] [PubMed] [Google Scholar]
- Colgrave M. L., Craik D. J. Biochemistry. 2004;43:5965–5975. doi: 10.1021/bi049711q. [DOI] [PubMed] [Google Scholar]
- Price-Carter M., Hull M. S., Goldenberg D. P. Biochemistry. 1998;37:9851–9861. doi: 10.1021/bi9803978. [DOI] [PubMed] [Google Scholar]
- Hogg P. J. Trends Biochem. Sci. 2003;28:210–214. doi: 10.1016/S0968-0004(03)00057-4. [DOI] [PubMed] [Google Scholar]
- Clarke J., Fersht A. R. Biochemistry. 1993;32:4322–4329. doi: 10.1021/bi00067a022. [DOI] [PubMed] [Google Scholar]
- Betz S. F. Protein Sci. 1993;2:1551–1558. doi: 10.1002/pro.5560021002. [DOI] [PMC free article] [PubMed] [Google Scholar]
- Schmidt B., Ho L., Hogg P. J. Biochemistry. 2006;45:7429–7433. doi: 10.1021/bi0603064. [DOI] [PubMed] [Google Scholar]
- Richardson J. S. Adv. Protein Chem. 1981;34:167–339. doi: 10.1016/s0065-3233(08)60520-3. [DOI] [PubMed] [Google Scholar]
- Harrison P. M., Sternberg M. J. J. Mol. Biol. 1996;264:603–623. doi: 10.1006/jmbi.1996.0664. [DOI] [PubMed] [Google Scholar]
- Ozhogina O. A., Bominaar E. L. J. Struct. Biol. 2009;168:223–233. doi: 10.1016/j.jsb.2009.06.003. [DOI] [PMC free article] [PubMed] [Google Scholar]
- Haworth N. L., Feng L. L., Wouters M. A. J. Bioinf. Comput. Biol. 2006;4:155–168. doi: 10.1142/s0219720006001734. [DOI] [PubMed] [Google Scholar]
- Srinivasan N., Sowdhamini R., Ramakrishnan C., Balaram P. Int. J. Pept. Res. Ther. 1990;36:147–155. doi: 10.1111/j.1399-3011.1990.tb00958.x. [DOI] [PubMed] [Google Scholar]
- Wüthrich K. J. Biol. Chem. 1990;265:22059–22062. [PubMed] [Google Scholar]
- Kaas Q., Yu R., Jin A.-H., Dutertre S., Craik D. J. Nucleic Acids Res. 2012;40:325–330. doi: 10.1093/nar/gkr886. [DOI] [PMC free article] [PubMed] [Google Scholar]
- Pardi A., Billeter M., Wüthrich K. J. Mol. Biol. 1984;180:741–751. doi: 10.1016/0022-2836(84)90035-4. [DOI] [PubMed] [Google Scholar]
- Clore G. M., Gronenborn A. M. Protein Eng., Des. Sel. 1987;1:275–288. doi: 10.1093/protein/1.4.275. [DOI] [PubMed] [Google Scholar]
- Rosengren K. J., Daly N. L., Plan M. R., Waine C., Craik D. J. J. Biol. Chem. 2003;278:8606–8616. doi: 10.1074/jbc.M211147200. [DOI] [PubMed] [Google Scholar]
- Shen Y., Bax A. J. Biomol. NMR. 2007;38:289–302. doi: 10.1007/s10858-007-9166-6. [DOI] [PubMed] [Google Scholar]
- Cheung M.-S., Maguire M. L., Stevens T. J., Broadhurst R. W. J. Magn. Reson. 2010;202:223–233. doi: 10.1016/j.jmr.2009.11.008. [DOI] [PubMed] [Google Scholar]
- Karplus M. J. Am. Chem. Soc. 1963;85:2870–2871. [Google Scholar]
- Haasnoot C., de Leeuw F. A., Altona C. Tetrahedron. 1980;36:2783–2792. [Google Scholar]
- Wagner G. Prog. Nucl. Magn. Reson. Spectrosc. 1990;22:101–139. [Google Scholar]
- Takeda M., Terauchi T., Kainosho M. J. Biomol. NMR. 2012;52:127–139. doi: 10.1007/s10858-011-9587-0. [DOI] [PubMed] [Google Scholar]
- Spera S., Bax A. J. Am. Chem. Soc. 1991;113:5490–5492. [Google Scholar]
- Saitô H. Magn. Reson. Chem. 1986;24:835–852. [Google Scholar]
- Wishart D. S., Sykes B. D., Richards F. M. J. Mol. Biol. 1991;222:311–333. doi: 10.1016/0022-2836(91)90214-q. [DOI] [PubMed] [Google Scholar]
- Shen Y., Bax A. J. Biomol. NMR. 2013;56:227–241. doi: 10.1007/s10858-013-9741-y. [DOI] [PMC free article] [PubMed] [Google Scholar]
- Berjanskii M. V., Neal S., Wishart D. S. Nucleic Acids Res. 2006;34:W63–W69. doi: 10.1093/nar/gkl341. [DOI] [PMC free article] [PubMed] [Google Scholar]
- Craik D. J., Daly N. L., Bond T., Waine C. J. Mol. Biol. 1999;294:1327–1336. doi: 10.1006/jmbi.1999.3383. [DOI] [PubMed] [Google Scholar]
- Güntert P. Methods Mol. Biol. 2004;278:353–378. doi: 10.1385/1-59259-809-9:353. [DOI] [PubMed] [Google Scholar]
- Brünger A. T., Adams P. D., Clore G. M., DeLano W. L., Gros P., Grosse-Kunstleve R. W., Jiang J.-S., Kuszewski J., Nilges M., Pannu N. S. Acta Crystallogr., Sect. D: Biol. Crystallogr. 1998;54:905–921. doi: 10.1107/s0907444998003254. [DOI] [PubMed] [Google Scholar]
- Linge J. P., Williams M. A., Spronk C. A., Bonvin A. M., Nilges M. Proteins: Struct., Funct., Bioinf. 2003;50:496–506. doi: 10.1002/prot.10299. [DOI] [PubMed] [Google Scholar]
- MacArthur M. W., Thornton J. M. Proteins: Struct., Funct., Bioinf. 1993;17:232–251. doi: 10.1002/prot.340170303. [DOI] [PubMed] [Google Scholar]
- De Dios A. C., Pearson J. G., Oldfield E. Science. 1993;260:1491. doi: 10.1126/science.8502992. [DOI] [PubMed] [Google Scholar]
- Shen Y., Bax A. J. Biomol. NMR. 2010;48:13–22. doi: 10.1007/s10858-010-9433-9. [DOI] [PMC free article] [PubMed] [Google Scholar]
- Berman H. M., Westbrook J., Feng Z., Gilliland G., Bhat T. N., Weissig H., Shindyalov I. N., Bourne P. E. Nucleic Acids Res. 2000;28:235–242. doi: 10.1093/nar/28.1.235. [DOI] [PMC free article] [PubMed] [Google Scholar]
- Zimmermann O., Hansmann U. H. Bioinformatics. 2006;22:3009–3015. doi: 10.1093/bioinformatics/btl489. [DOI] [PubMed] [Google Scholar]
- Touw W. G., Baakman C., Black J., te Beek T. A., Krieger E., Joosten R. P., Vriend G. Nucleic Acids Res. 2014;43:D364–D368. doi: 10.1093/nar/gku1028. [DOI] [PMC free article] [PubMed] [Google Scholar]
- Shen Y., Delaglio F., Cornilescu G., Bax A. J. Biomol. NMR. 2009;44:213–223. doi: 10.1007/s10858-009-9333-z. [DOI] [PMC free article] [PubMed] [Google Scholar]
- Kountouris P., Hirst J. D. BMC Bioinf. 2009;10:1. doi: 10.1186/1471-2105-10-437. [DOI] [PMC free article] [PubMed] [Google Scholar]
- Sun J., Wang J., Xiong D., Hu J., Liu R. Sci. Rep. 2016;6:34044. doi: 10.1038/srep34044. [DOI] [PMC free article] [PubMed] [Google Scholar]
- Islam M. N., Iqbal S., Katebi A. R., Hoque M. T. J. Theor. Biol. 2016;389:60–71. doi: 10.1016/j.jtbi.2015.10.015. [DOI] [PubMed] [Google Scholar]
- Kieslich C. A., Smadbeck J., Khoury G. A., Floudas C. A. J. Chem. Inf. Model. 2016;56:455–461. doi: 10.1021/acs.jcim.5b00566. [DOI] [PubMed] [Google Scholar]
- Pedregosa F., Varoquaux G., Gramfort A., Michel V., Thirion B., Grisel O., Blondel M., Prettenhofer P., Weiss R., Dubourg V. J. Mach. Learn. Res. 2011;12:2825–2830. [Google Scholar]
- Schölkopf B. and Smola A. J., Learning with Kernels, MIT press, 2002. [Google Scholar]
- Chawla N. V., Bowyer K. W., Hall L. O., Kegelmeyer W. P. J. Artif. Intell. Res. 2002;16:321–357. [Google Scholar]
- Tomek I. IEEE Transactions on System, Man and Cybernetics. 1976:448–452. [Google Scholar]
- Hsu C.-W., Chang C.-C. and Lin C.-J., A practical guide to support vector classification, Dep. of Computer Sci., National Taiwan University, Taiwan, 2003. [Google Scholar]
- Matthews B. W. Biochim. Biophys. Acta, Protein Struct. 1975;405:442–451. doi: 10.1016/0005-2795(75)90109-9. [DOI] [PubMed] [Google Scholar]
- Darby N. J. and Creighton T. E., Protein structure, Oxford University Press, USA, 1993. [Google Scholar]
- Aboye T. L., Strömstedt A. A., Gunasekera S., Bruhn J. G., El-Seedi H., Rosengren K. J., Göransson U. ChemBioChem. 2015;16:1068–1077. doi: 10.1002/cbic.201402704. [DOI] [PubMed] [Google Scholar]
- Carstens B. B., Rosengren K. J., Gunasekera S., Schempp S., Bohlin L., Dahlström M., Clark R. J., Göransson U. J. Nat. Prod. 2015;78:1886–1893. doi: 10.1021/acs.jnatprod.5b00210. [DOI] [PubMed] [Google Scholar]
- Kwon S., Bosmans F., Kaas Q., Cheneval O., Conibear A. C., Rosengren K. J., Wang C. K., Schroeder C. I., Craik D. J. Biotechnol. Bioeng. 2016;13:2202–2212. doi: 10.1002/bit.25993. [DOI] [PMC free article] [PubMed] [Google Scholar]
- Davis I. W., Leaver-Fay A., Chen V. B., Block J. N., Kapral G. J., Wang X., Murray L. W., Arendall W. B., Snoeyink J., Richardson J. S. Nucleic Acids Res. 2007;35:W375–W383. doi: 10.1093/nar/gkm216. [DOI] [PMC free article] [PubMed] [Google Scholar]
- Chen V. B., Arendall W. B., Headd J. J., Keedy D. A., Immormino R. M., Kapral G. J., Murray L. W., Richardson J. S., Richardson D. C. Acta Crystallogr., Sect. D: Biol. Crystallogr. 2010;66:12–21. doi: 10.1107/S0907444909042073. [DOI] [PMC free article] [PubMed] [Google Scholar]
- Koradi R., Billeter M., Wüthrich K. J. Mol. Graphics. 1996;14:51–55. doi: 10.1016/0263-7855(96)00009-4. [DOI] [PubMed] [Google Scholar]
- Henriques S. T., Deplazes E., Lawrence N., Cheneval O., Chaousis S., Inserra M., Thongyoo P., King G. F., Mark A. E., Vetter I. J. Biol. Chem. 2016;291:17049–17065. doi: 10.1074/jbc.M116.729095. [DOI] [PMC free article] [PubMed] [Google Scholar]
- Deuis J. R., Dekan Z., Wingerd J. S., Smith J. J., Munasinghe N. R., Bhola R. F., Imlach W. L., Herzig V., Armstrong D. A., Rosengren K. J., Bosmans F., Waxman S. G., Dib-Hajj S. D., Escoubas P., Minett M. S., Christie M. J., King G. F., Alewood P. F., Lewis R. J., Wood J. N., Vetter I. Sci. Rep. 2017;7:40883. doi: 10.1038/srep40883. [DOI] [PMC free article] [PubMed] [Google Scholar]
- Sauter C., Otálora F., Gavira J. A., Vidal O., Giegé R., García-Ruiz J. M. Acta Crystallogr., Sect. D: Biol. Crystallogr. 2001;57:1119–1126. doi: 10.1107/s0907444901008873. [DOI] [PubMed] [Google Scholar]
- Schwalbe H., Grimshaw S. B., Spencer A., Buck M., Boyd J., Dobson C. M., Redfield C., Smith L. J. Protein Sci. 2001;10:677–688. doi: 10.1110/ps.43301. [DOI] [PMC free article] [PubMed] [Google Scholar]
- Zweckstetter M., Bax A. J. Am. Chem. Soc. 2000;122:3791–3792. [Google Scholar]
- Olivera B. M., Gray W. R., Zeikus R., McIntosh J. M., Varga J., Rivier J., De Santos V., Cruz L. J. Science. 1985;230:1338–1343. doi: 10.1126/science.4071055. [DOI] [PubMed] [Google Scholar]
- Goto M., Swanson L. W., Canteras N. S. J. Comp. Neurol. 2001;438:86–122. doi: 10.1002/cne.1303. [DOI] [PubMed] [Google Scholar]
- Krause A., Neitz S., Mägert H.-J., Schulz A., Forssmann W.-G., Schulz-Knappe P., Adermann K. FEBS Lett. 2000;480:147–150. doi: 10.1016/s0014-5793(00)01920-7. [DOI] [PubMed] [Google Scholar]
- Olivera B. M., Rivier J., Clark C., Ramilo C. A., Corpuz G. P., Abogadie F. C., Mena E. E., Hillyard D., Cruz L. Science. 1990;249:257–263. doi: 10.1126/science.2165278. [DOI] [PubMed] [Google Scholar]
- Wang C. K., Craik D. J. Nat. Chem. Biol. 2018;14:417. doi: 10.1038/s41589-018-0039-y. [DOI] [PubMed] [Google Scholar]
- Franke B., Mylne J., Rosengren K. Nat. Prod. Rep. 2018;35:137–146. doi: 10.1039/c7np00066a. [DOI] [PubMed] [Google Scholar]
- Vlieghe P., Lisowski V., Martinez J., Khrestchatisky M. Drug Discovery Today. 2010;15:40–56. doi: 10.1016/j.drudis.2009.10.009. [DOI] [PubMed] [Google Scholar]
Associated Data
This section collects any data citations, data availability statements, or supplementary materials included in this article.