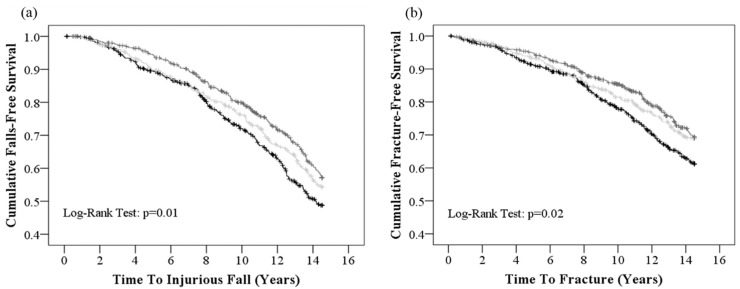
Figure 1.
Kaplan-Meier survival curves for vegetable diversity categories for (a) injurious falls and (b) fractures over 14.5 years. Low (≤3 number/d), moderate (4 number/d), and high (≥5 number/d) vegetable diversity categories are represented by the black, light grey, and grey lines, respectively.

