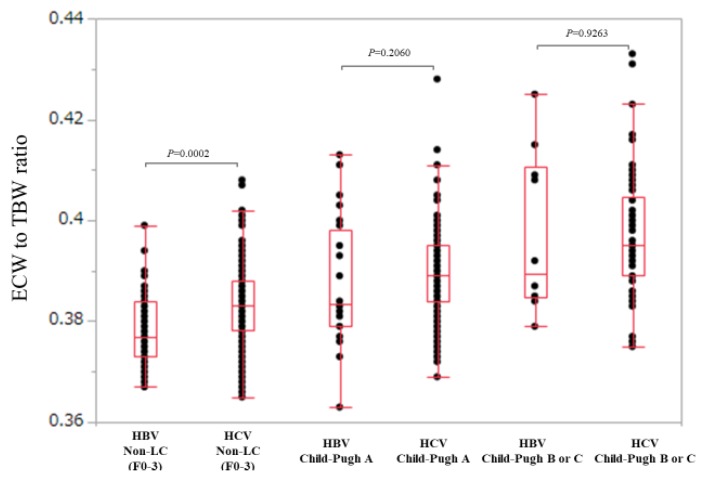
Figure 4.
Comparison of ECW/TBW in the HBV group and the HCV group according to liver fibrosis stage (non-LC, Child-Pugh A and Child-Pugh B or C). In non-LC patients, ECW/TBW in the HCV group (n = 176) was significantly higher than that in the HBV group (n = 47) (median (range): 0.377 (0.367–0.399) in the HBV group and 0.383 (0.365–0.408) in the HCV group, p = 0.0002). In Child-Pugh A patients, ECW/TBW in the HCV group (n = 198) was not significantly higher than that in the HBV group (n = 28) (median (range): 0.380 (0.363–0.413) in the HBV group and 0.390 (0.369-0.428) in the HCV group, p = 0.2060). In Child-Pugh B or C patients, ECW/TBW in the HCV group (n = 66) was not significantly higher than that in the HBV group (n = 10) (median (range): 0.390 (0.379–0.425) in the HBV group and 0.395 (0.375–0.433) in the HCV group, p = 0.9263).

