Figure 1.
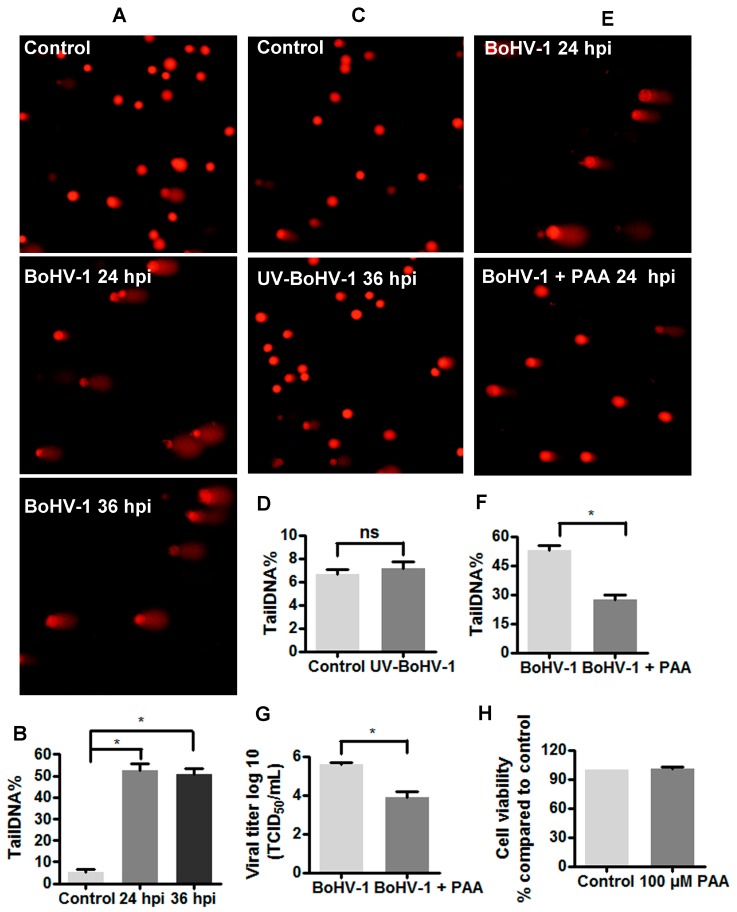
The detection of DNA damage in BoHV-1 infected MDBK cells. (A) MDBK cells were infected with BoHV-1 (MOI = 0.1), and at indicated time points the cell cultures were collected to measure DNA damage in individual cells with comet assay. The images were acquired under a fluorescence microscope. Results were of three independent experiments (Magnification ×200). (B) Three hundred cells randomly selected from each sample were used for the calculation of tailDNA% by software CASP. Values represented three independent experiments. *, significant differences (P < 0.05) in tailDNA%, as determined by a Student t test. (C) MDBK cells were infected with UV-inactivated BoHV-1 (MOI = 0.1). After infection for 36 h, the cells were collected and subjected to comet assay. The images were acquired under a fluorescence microscope. Results were of three independent experiments (Magnification ×200). (D,F) Three hundred cells randomly selected from each sample were used for the calculation of TailDNA% by software CASP. Values represented three independent experiments. *, significant differences (P < 0.05) in tailDNA%, as determined by a Student t test. (E) MDBK cells were infected with BoHV-1 (MOI = 0.1), along with phosphonoacetic acid (PAA) treatment (100 μM). At 24 h after infection, comet assay was performed to detect DNA damage in individual cells, the images were acquired under a fluorescence microscope. Results were of three independent experiments (Magnification ×200). (G) MDBK cells in 24-wells plates were infected with BoHV-1 (MOI = 0.1) and treated with PAA treatment (100 μM) or DMSO control for 24 h. The virus titer was determined in MDBK cells. Data represent three independent experiments. Significance was assessed with the Student t test (*, P < 0.05). (H) The cytotoxicity of PAA treated MDBK cells for 24 h was analyzed by Trypan-blue exclusion test. Data represent three independent experiments.

