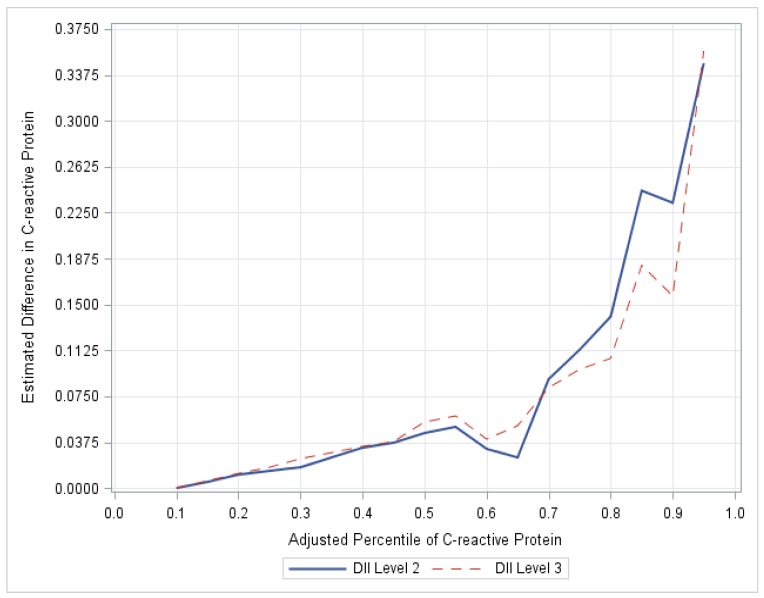
Figure 1.
Plot of regression coefficients (C-DII and CRP). The magnitude of the differences in CRP increases at the upper percentiles up to the 85th percentile. CRP for children in C-DII group 2 as compared to C-DII group 1 at the 85th percentile is over 5 times the difference in CRP at the median, NHANES, 2005–2012.To reinforce the validity of our study, a logistic regression was performed using dichotomized CRP as the dependent variable (designated as high risk if CRP ≥ 0.50 mg/L or low risk <0.50 mg/dL) using a median cut-point. The odds of a CRP value ≥ 0.50 mg/L were obtained for those in C-DII level 3 compared to level 1, controlling for sex, age, race, asthma, BMI, and infections.

