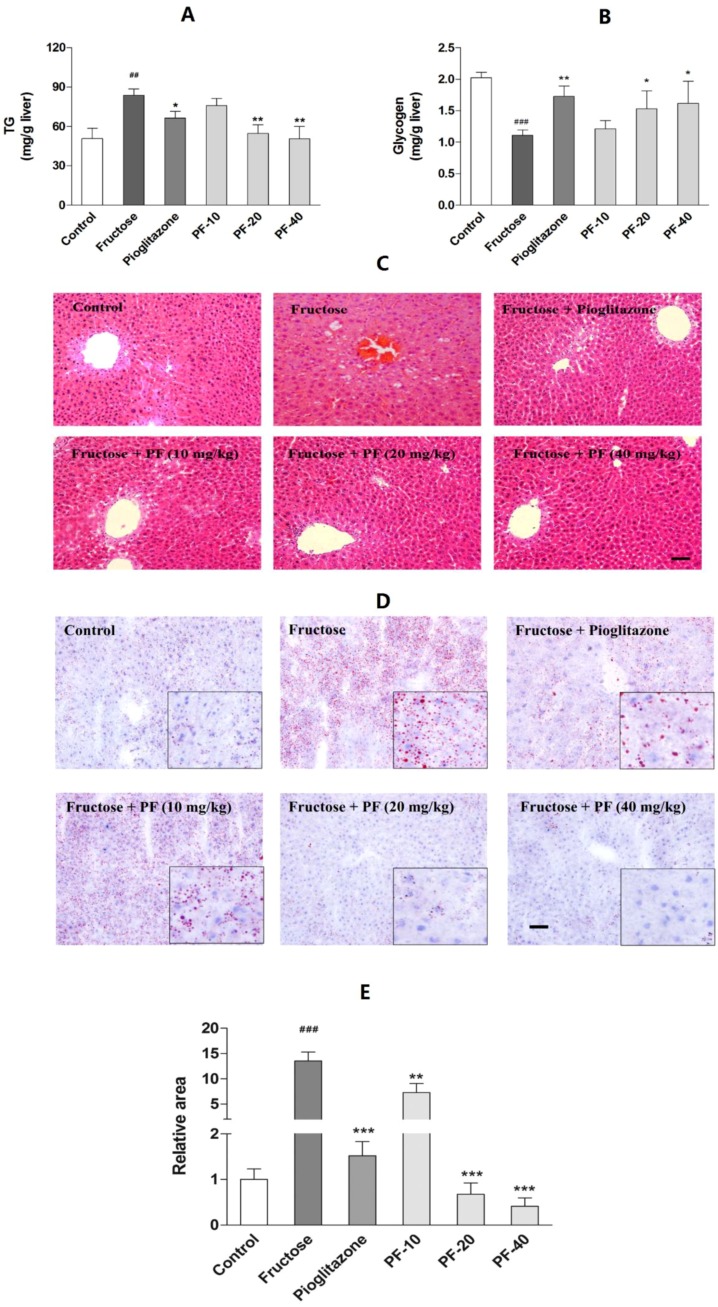
Figure 3.
Effects of paeoniflorin on the hepatic lipids and glycogen contents. (A) Hepatic lipids contents. (B) Hepatic glycogen contents. (C) HE staining (200 ×). (D) Oil-red O staining (200 ×). Insets from the images are magnified five times in order to highlight the lipid-staining morphology. (E) Relative area of Oil-red O staining. Data were expressed as the mean ± SEM. (n = 8). Data was analyzed by one-way ANOVA followed by Dunnett’s post hoc test. ## p < 0.01 and ### p < 0.001 vs. control group. * p < 0.05, ** p < 0.01 and *** p < 0.001 vs. fructose group. PF-10: 10 mg/kg of paeoniflorin; PF-20: 20 mg/kg of paeoniflorin; PF-40: 40 mg/kg of paeoniflorin. The scale bar represents a length of 50 μm.

