

Abstract
Background:
People with diabetes need to monitor their blood sugar levels constantly and attend health centers regularly for checkups. The aim of this study is to provide a healthcare system for mobile blood glucose and bilirubin monitoring.
Methods:
It includes a sensor for noninvasive blood glucose and bilirubin measurement using near-infrared spectroscopy and optical method, respectively, communicating with a smartphone.
Results:
It was observed that by increasing the glucose concentration, the output voltage of the sensor increases in transmittance mode and decreases in reflectance mode. Moreover, it was observed that by increasing the bilirubin concentration, the output voltage of sensor decreases in transmittance mode and increases in reflectance mode. In the collected data there was good correlations between voltage and concentration and their relationship were approximately linear. Therefore, it is possible to use noninvasive methods to predict the glucose or bilirubin concentration. In vivo experiments for glucose were carried out with 19 persons in training phase, and five persons were used for testing the model. The glucose behavior model was built into the mobile application. The average glucose concentrations from the transmittance and reflectance mode were obtained. The average percentage error was 8.27 and root mean square error was 18.52 mg/dL.
Conclusions:
From this research, it can be inferred that the noninvasive optical methods implemented on wireless sensors and smartphones could form a system that can be used at any time and any place in the future as an alternative to traditional invasive blood glucose and bilirubin measurement methods.
Keywords: Android apps, diabetes, mobile medical care, near-infrared spectroscopy, noninvasive blood bilirubin monitoring, noninvasive blood glucose monitoring, optical methods, telemedicine, wireless sensors
Introduction
Diabetes is a metabolic disorder. In people with diabetes, blood glucose fluctuates from its normal range (90–140 mg/dl). Insulin is a hormone that is produced in the body to balance blood glucose levels.[1] In diabetic patients, body does not have enough insulin or the existing insulin is unable to properly perform its duty. This resistance causes the blood sugar levels to increase.[2] The diabetic population around the world is on the rise, due to poor diet, obesity, and lack of physical activity. According to the International Diabetes Federation, 382 million people had diabetes in 2013. This figure is alarming; with this rate, the number of people with diabetes will reach to 592 million by 2035.[1] People with diabetes have to keep a balance between the three important aspects of diet, exercise, and medication in their daily lives. Therefore, continuous monitoring of blood glucose is crucial for the treatment of diabetes.[2] Control of blood glucose, lipids, and blood pressure with lifestyle change can improve the patient's condition with diabetes.[3] Uncontrolled hyperglycemia (high blood sugar level) increases the risk of long-term complications such as coronary heart disease, stroke, microvascular disorder, leading to blindness, amputations, and nephropathy and peripheral neuropathy with loss of functional status and emotional disorders. On the other hand, hypoglycemia (low blood sugar level) could cause convulsions, coma, arrhythmia, and cardiac failure.[4] Therefore, controlling the blood glucose is very important. There are various methods to measure blood glucose. Glucose sensors are divided into two categories of (i) point sample glucose sensors and (ii) continuous glucose sensors. Point sample glucose sensors are carried out by finger prick glucometer or urine dipstick. However, continuous glucose monitoring is divided into three categories of invasive, minimally invasive, and noninvasive. Microdialysis and intravenous implantable are two kinds of invasive sensors. Micropore or microneedle is a minimally invasive glucose sensor.[5] Noninvasive methods offer painless and safe alternative for measuring blood sugar.[6] Noninvasive glucose sensors are divided into two categories of transdermal and optical sensors. Impedance spectroscopy and skin suction blister technique are two kinds of transdermal sensors. Optical sensors include various types such as near-infrared (NIR) spectroscopy, mid-infrared spectroscopy, fluorescence, Raman spectroscopy, and thermal infrared.[5] In this study, the NIR spectroscopy method is used that will be introduced in the following.
NIR spectroscopy measures the change in light intensity when a light beam with 750–2500 nm wavelength is transmitted and reflected on the 1–100-mm thick skin tissue.[7] With the recent advances in the field of microelectronics, NIR spectroscopy has become a popular method for monitoring many physiological parameters since this method provides a simple, affordable, safe, and comfortable measurement.[8] Three bands exist in the NIR range: (i) the combination overtone band (2000–2500 nm), (ii) the first overtone band (1400–2000 nm), and (ii) the second or higher overtone band (750–1400 nm).[8]
The incident light on the body is partially absorbed and partially scattered, due to its interaction with the chemical components within the tissue. According to the light transport theory, attenuation of light in the tissue is described by Eq. 1 where I is the reflected light intensity, I0 the incident light intensity, μeff the effective attenuation coefficient, and d the optical path length in the tissue.[9]
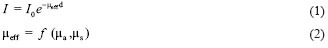
According to Eq. 2, μeff can be expressed as a function of μa and μs, where μa is the absorption coefficient corresponding to water displacement in tissue and μs is the scattering coefficient which relates to diameter and refractive index of scattering centers in the tissue.[9] Increase in glucose concentration decreases these coefficients and shortens the optical path, which consequently increases the light intensity.[10] Figure 1 shows the effect of glucose concentration on amount of absorption and optical path. More glucose causes decrease in scattering coefficient, decrease in absorption, decrease in optical path, and increase in light intensity compared with less glucose.[1]
Figure 1.
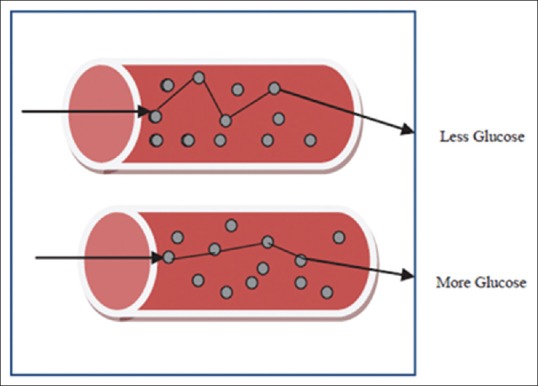
The effect of glucose concentration on amount of absorption and optical path[1]
Glucose concentration could be estimated by variations of light intensity transmitted or reflected through tissue containing glucose. Transmission or reflection of the light can be measured by appropriate detectors.[9] In NIR method, light can penetrate the skin up to 1–100 mm. This approach is also very cost-effective.[8] In this method, the glucose can be measured from different parts of the body such as tongue, oral mucosa, lip, earlobe, finger, forearm, and cheek.[8,9] However, due to high error rate, the NIR method has still a long path to become the mainstream technique to measure the glucose at home.[8]
Second part of the article introduces another optical method to diagnose jaundice. It measures the blood bilirubin using 457–473 nm wavelength light. In jaundice, body produces high amount of bilirubin that cannot be excreted from the intestine and the skin and eyes turn yellow.[11] Many babies have jaundice after birth. These conditions are usually due to a problem in the immature infant's liver. A large number of bilirubin pigments can cause neurological disorders, irreparable neurologic dysfunction, and even death.[12] Jaundice needs immediate care and treatment if the concentration of serum bilirubin exceeds 10 mg/dL.[13] Early diagnosis of jaundice can be carried out by three methods: (1) the Kramer's rule, (2) an invasive blood test, and (3) noninvasive optical techniques. Kramer's rule or visual inspection assessment is based on the yellowness of skin. In the invasive technique, blood samples are needed to check the concentration of bilirubin. However, the noninvasive technique has less pain and fewer traumas to the baby.[11] In this research, a noninvasive technique incorporating the concept of absorption and reflection of light and Lambert law is used. The Lambert law states that the value of output light depends on the path length that the input light caries out through a liquid containing bilirubin. In Eq. 3, the input light is I0 and the output light is I. Bilirubin absorbs certain wavelength of the light.[14] Figure 2 shows the Lambert law of absorption light.
Figure 2.
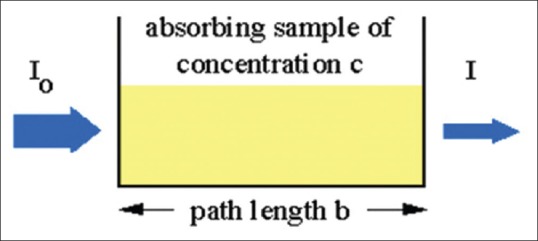
Lambert law of absorption light[14]
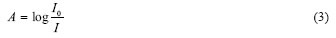
The light emits to a sample with an appropriate wavelength which is absorbed by the bilirubin. Therefore, the output light intensity will be lower than the input.[14] The study also provides a mobile application for the provision of telemedicine services. Telemedicine provides the necessary technology to care for patient at distance and to communicate between the caregivers and the patients.[15] Mobile phones have become our means of daily transactions for communication, shopping, and even access to health-related information. In fact, mobile phones have become a tool to communicate with people and the world around them. Mobile phone-based telemedicine has been established as an effective approach for the exchange of information and provides feedback between patients and their caregivers.[16]
In this research, a noninvasive mobile system based on optical methods have been designed and evaluated to measure the blood glucose and bilirubin. The user interface of the system is a smartphone application to communicate with the optical sensor and to display the results. This application can send the necessary information and alarm to the physician and the patient's family to provide medical services.
This paper is organized as follows:
In Literature Review Section, a review on NIR spectroscopy and bilirubin optical diagnostic researches is carried out
Methods Section explains the methodology and includes both hardware and Android application development
In Results Section, the results of tests on the solution and on the body are reported
The conclusions are inferred in the last session.
Literature Review
In this section, a literature review on measuring blood glucose using NIR spectroscopy and measuring bilirubin using optical method has been presented. Müller et al. in 1997 used NIR diffuse reflectance spectra method in the range of 800–1350 nm to measure glucose from finger. The cross-validation root mean square error of prediction (RMSEP) obtained is from 1.02 mmol/L (18.4 mg/dL) to 1.88 mmol/L (33.8 mg/dL).[17] Danzer et al. in 1998 used NIR diffuse reflectance with partial least squares (PLS) regression and analysis of radial basis function (RBF) neural network. They used 800–1350 nm NIR light and measured glucose from the middle finger. The RMSEP obtained is 2.0 mmol/L (36 mg/dL).[18] Araujo-Andrade et al. in 2004 used NIR diffuse reflectance method which consisted of a light source, a fiber optical measuring head, and an NIR spectrometer. The NIR light with a wavelength of 900–1700 nm was used, and the measurement is carried out from the finger. In this study, the correlation coefficient values obtained are lower than 0.744 and RMSEP values obtained are higher than 0.89 mmol/L (16 mg/dL).[19] Xu et al. in 2005 reported an optical measurement condition reproduction technique to deal with the difference in measuring locations and contact pressures. Their proposed system consists of light-emitting diodes (LEDs) for lighting, fiber probe, spectrometer, CCD camera, three-dimensional servo device, and a brocket. They used NIR diffuse reflectance spectra in the range of 1100–1800 nm to measure glucose from palm. The obtained RMSEP ranges from 0.8 to 1.1 mmol/L (15–20 mg/dL), and the correlation coefficient is greater than 0.8.[20] Guevara and González in 2010 jointed NIR (700–1000 nm) and impedance spectroscopy (1–200 MHz). They measured glucose from the forearm and tested technique on 10 nondiabetic individuals under controlled temperature and humidity conditions. The RMSEP obtained was 1.2488 mmol/L (21.96 mg/dL).[21] Srivastava et al. in 2013 proposed an optical noninvasive methods to measure the blood glucose by a 940-nm infrared light emitted as the input signal on the finger. The output signal could be digitized, amplified, and processed in a microchip with a special algorithm designed to detect blood glucose levels. However, the proposed method has not been evaluated. This paper concludes that noninvasive blood glucose measurements in the near future can be a good alternative to market glucometers.[22] Pavithra et al. in 2014 investigated the development of noninvasive methods for measuring blood glucose and hemoglobin using occlusion-NIR spectroscopy. The circuit consists of two NIR sensors using an 870-nm beam for detecting hemoglobin and a 1000-nm beam for detecting glucose. In this study, the device is tested on peoples with different glucose and hemoglobin levels. The minimum photodiode voltage was same for all participants, but maximum photodiode voltage changed in the range of 3–3.8 V.[23] Yadav et al. in 2014 also tried to create a system for continuous and noninvasive blood glucose measurements. This study focused on the development of a noninvasive sensor of blood glucose measurement using continuous wave from the NIR transmitter. The proposed system of this paper used an infrared transmitter at 940 nm. In this system, the glucose sensor is connected to the person's arm. The system was tested in two stages of in vitro and in vivo. In vitro experiment showed decrease in transmittance with increase in glucose concentration in aqueous solution. In these experiments optically measured signal and actual glucose concentrations had strong correlation. For in vivo experiments, The blood glucose level of seven nondiabetic individuals aged 25–35 years before and after consuming food was measured using NIR glucose sensor and available glucometers in the market. It measured diffused reflectance spectra of the forearm. The signal amplitude decreased after meal comparing with before meal.[1] Guo et al. in 2015 presented a new noninvasive blood glucose monitoring method based on four NIR spectra and double artificial neural network analysis. They used 820, 875, 945, and 1050 nm wavelengths and have recorded the transmission photoplethysmogram signal for four fingers simultaneously. After collecting and preproccessing data, a module creates an estimation model that utilizes the wavelet transform and artificial neural network to create this model. Experiments showed that the RMSE of the prediction is between 0.97 and 6.69 mg/dL and the average of RMSE is 3.80 mg/dL.[24] Tamilselvi and Ramkumar in 2015 proposed a framework for noninvasive blood glucose measurement using NIR spectroscopy with 940-nm wavelength. At the start of experiment, the Global Positioning System module sends the user's position coordinates with the message to the physician. A Global System for Mobile modem is used to send a message through any commercially available SIM card. However, the proposed method has not been evaluated.[25] Pande and Joshi in 2015 in their article presented a circuit for noninvasive measurement of the glucose. They concluded that the transmitter with 1450-nm wavelength is more suitable.[26] Bobade and Patil in 2016 presented a noninvasive method for measuring blood glucose in diabetics and nondiabetics. In this study, the light with a wavelength of 940 nm is emitted to the patient's finger. The transmitted light is measured. After processing the received signal, the results are displayed on the liquid-crystal display (LCD) while being able to send them to the Android app by Bluetooth. Experiments are carried out with 48 samples in two phases of fasting and nonfasting states. The results indicate that there is a correlation between the intensity level after the transmission and the glucose level. However, the method has not been evaluated.[27]
The second part of literature review is assigned for the bilirubin measurement. Baharuddin et al. in 2010 presented a cost-effective and portable bilirubin measurement device. In the proposed system, the visible light in the range of 380–760 nm has been emitted to the blood serum and the reflected light has been measured. The sample which is a yellow liquid with different concentration has been placed in a black box. The outputs of system consisted of LCD display, red and green LED, and a buzzer to show normal, mild, and critical conditions. The output voltage of the device decreased with increasing bilirubin concentrations. The method has not been evaluated on the body.[28] Penhaker et al. presented an article in 2013 in which they described the design of an electronic device for measuring bilirubin by optical method. They used two LEDs with the wavelengths of 455 and 575. The concentration of bilirubin was found from the difference in their absorbance. The first LED corresponded mainly to the bilirubin content and the second to the oxyhemoglobin content. The proposed circuit was a dual-channel circuit. Each of the channels included an LED, an analog circuit for signal processing, and an analog-to-digital converter. The data from both channels were sent to the PC and processed by the LabView software (National Instruments). In the test phase, the ABL 835 was used to measure bilirubin as a reference. The test was performed on seven subjects from 3 days to 42 years of age. The error level in measurements reached 3.95%.[29] Osman et al. presented a noninvasive method for bilirubin measurement in 2014. In this research, light with a wavelength of 455 nm is transmitted to the sample. To prepare sample, the Sprague–Dawley (SD) rat's skin is shaved and soaked for 3 min at different artificial bilirubin standard solution (ABSS) concentrations. The reflected light was received by the photodiode, and the output voltage was measured by the voltmeter. In the next step, the relationship between the received voltage and the ABSS concentration was obtained using the MATLAB (MathWorks, Inc) software. The output voltage decreased when the concentration of ABSS increases. In the final circuit, the received voltage by the photodiode was sent to the Arduino and has been processed to determine the bilirubin concentration. The digitized signal by Arduino was sent to the PIC microcontroller. At this stage, the digital signal was processed and the bilirubin level was displayed on the LCD. The degree of jaundice was also determined by the LED. The method has not been evaluated.[12] Ali et al. in 2015 presented an optical technique for detecting jaundice without using a blood test. In their technique, the blue light was emitted to the sample and the light reflected was captured by the photodiode. In this research, the mock skin of SD rat has been shaved and soaked into fix calibrated bilirubin concentrations and was used to obtain a relationship between the device voltage and the bilirubin concentration. The reflected light produced a voltage. This voltage was processed by the Arduino, and the result was displayed on the LCD. Arduino was communicated with the Visual Basic software (Microsoft) to store results in the SQLyog database. Results were displayed on the website. The doctor and nurses could monitor the babies jaundice level through online system.[11]
In this paper, in addition to combining devices for measuring glucose and bilirubin, both transmittance and reflectance modes have been investigated. Android application for processing and sending information has also been developed.
Methods
In this section, implementation of our proposed system for noninvasive glucose and bilirubin measurement using optical method is explained.
Hardware configuration
The NIR spectroscopy is used to measure the blood glucose, and an optical method incorporating the visible light is selected to measure the amount of bilirubin. The wavelength selection of light is very important for optical methods. As mentioned in Introduction Section, three bands exist in the NIR range; combination overtone band (2000–2500 nm), first overtone band (1400–2000 nm), and second or higher overtone band (750–1400 nm).[8]
Glucose has maximum absorption at wavelength of 939, 970, and 1197 nm in higher overtone regions; wavelength of 1408, 1536, 1688, and 1925 nm in the first overtone region; and wavelength of 2100, 2261, and 2326 nm in combination region.[1] In this study, NIR light with wavelength of 940, 1550, and 1650 nm is used to measure glucose. The wavelengths 1550 and 1650 nm have maximum absorption of glucose. Although glucose absorption at wavelength 940 nm is lower compared to the first overtone and combination overtone, it has minimum optical signal attenuation by other components such as water. Therefore, the intended depth of penetration could be achieved at this wavelength.[1] An infrared receiver in the range of 800–1700 nm was used to receive the optical signal. In the same circuit, another LED for bilirubin measurement is added. The bilirubin will absorb wavelength of light between 457 nm and 473 nm.[11] Therefore, in this study, light with a wavelength of 470 nm was used to measure bilirubin. Furthermore, an optical receiver in the range of 330–720 nm was proposed to receive an optical signal.
The circuit for our proposed noninvasive blood glucose and bilirubin monitoring system is shown in Figure 3.
Figure 3.

The proposed system for non-invasive blood glucose and bilirubin measurement
In our system, we propose a suitable microcontroller, LEDs, transmitter and receiver, and wireless and mobile capabilities. The AVR ATMega32 microcontroller is used to control the transmitters and the receiver which are connected to Port D pins of this microcontroller. The Pande and Joshi[22] circuit is added for filtering, amplification, and signal isolation. This circuit includes a 1 μF capacitor that is a couplage capacitor and remove DC [Box A, Figure 3]. Then, an op-amp creates a low-pass filter to remove the high-frequency noise and the probable leakage currents [Box B, Figure 3]. In the next step, the second 1 μF capacitor with 68 kΩ resistance creates a high-pass filter to remove the low-frequency noise [Box C, Figure 3]. The second op-amp amplifies the signal and it has created a low-pass filter to probable leakage currents [Box D, Figure 3]. Finally, the transistor decreases the result on the loading effect of microcontroller. It can isolate the circuit output from the microcontroller circuit [Box E, Figure 3].
The circuit output is connected to pin A0 which are analog ports. Microcontroller converts the analog signal to digital and carries out the processing. The microcontroller calculates the average voltages received from the circuit caused by the radiation of each 940, 1550, and 1650 nm transmitters. The average voltage as the sensor output is shown on the LCD and will be sent through the Bluetooth to mobile application. Micro-programming is carried out using C Language. Figure 4 states snippet of the microcontroller code. Figure 4a shows the code for turning on the LEDs, analog to digital converter reading, turning off LEDs, and converting voltage to a number within the range of 0–5 V. Figure 4b shows the code for representing the voltage values on LCD and sending them via serial port. A rechargeable battery with 9 V or 12 V is used to supply the circuit voltage. An L7805CV regulator is used to obtain the 5 V voltage. An LF33CV regulator is added to obtain the 3.3 V voltage because the Bluetooth module works with this voltage.
Figure 4.
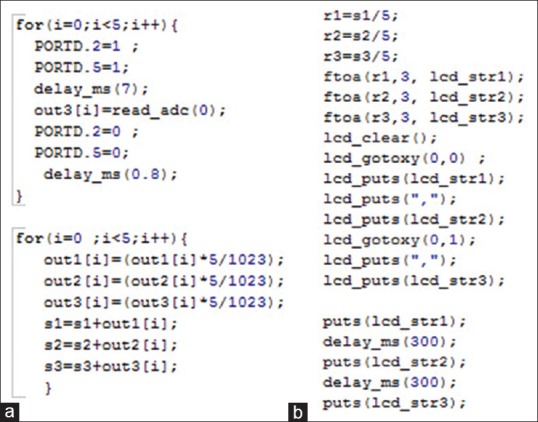
Some pieces of microcontroller code. (a) the code for turning on the LEDs, ADC reading, turning off LEDs, and converting voltage to a number within the range of 0–5 V; (b) the code for representing the voltage values on LCD and sending them via serial port
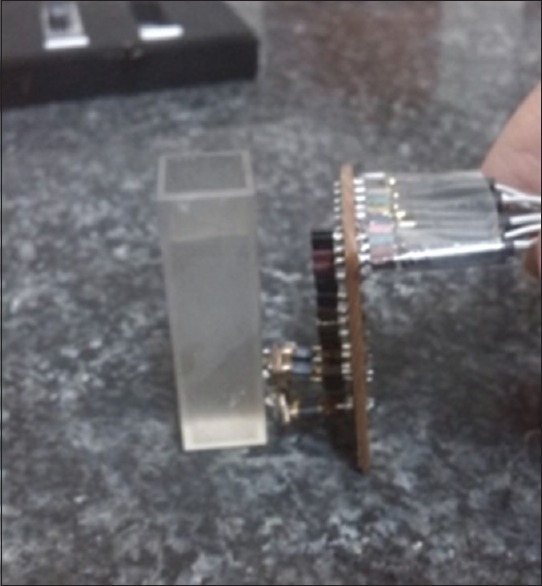
In this paper, both transmittance and reflectance modes are checked to measure the blood glucose and bilirubin. The printed circuit board to measure blood glucose in the transmittance and reflectance mode is shown in Figures 5 and 6.
Figure 5.
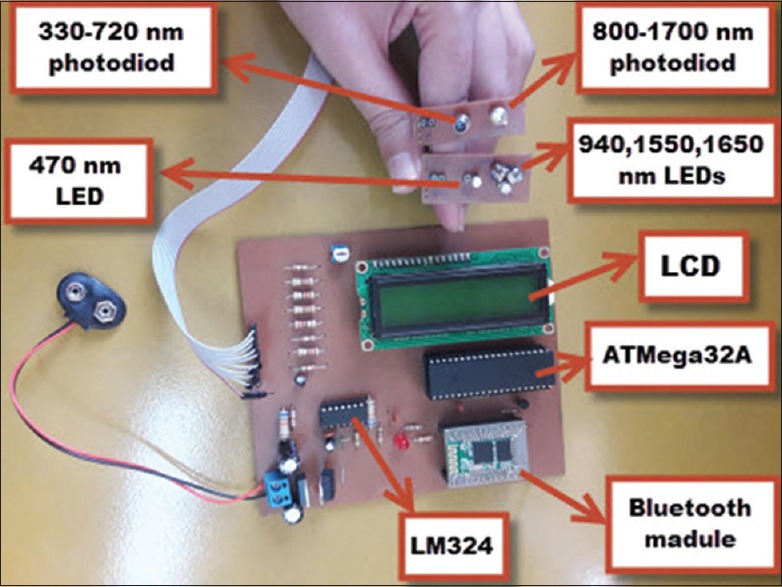
The printed circuit board to measure the blood glucose and bilirubin in transmittance mode
Figure 6.
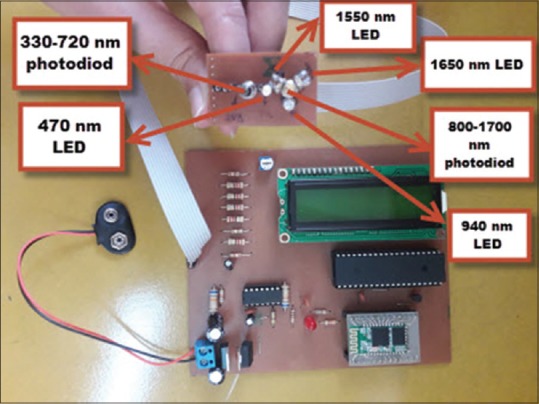
The printed circuit board to measure the blood glucose and bilirubin in reflectance mode
Android application development for smartphone
In this study, an Android application is designed for the communication between sensor and smartphone user interface via Bluetooth transreceiver. SQLite database is used to store the user profiles and the measured glucose and bilirubin values. This application receives processes and records the information from the sensors. The result is sent to the doctor or family via e-mail or SMS through the Android app. It also presents the graph of blood glucose and bilirubin changes on the user interface. The application's operation is shown in Figure 7.
Figure 7.

The application operation
The function of each page of application is discussed below. Figure 8 shows the application pages.
Figure 8.
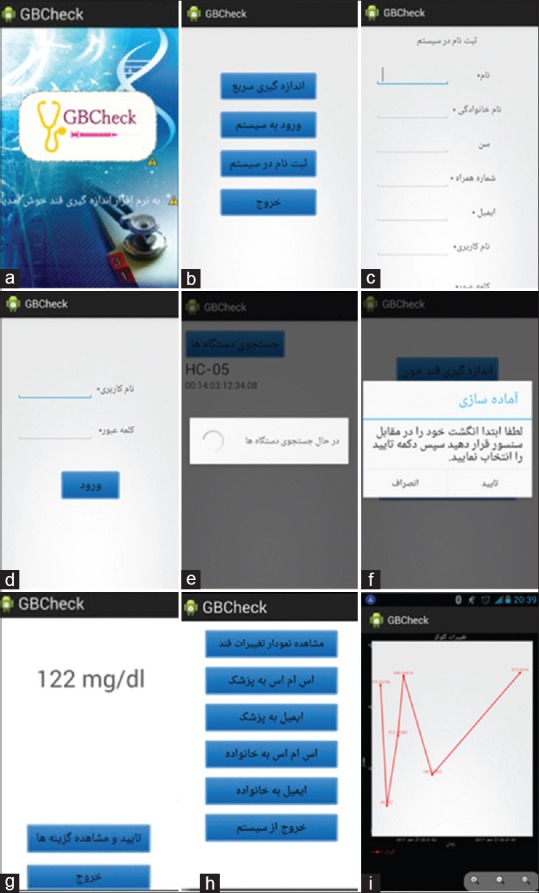
The application pages. (a) Start page of the application; (b) The second page of the application; (c) Sign up screen; (d) Sign in screen; (e) Search devices screen; (f) The select procedures screen; (g) The result screen; (h) The options page; (i) The screen for drawing glucose or bilirubin chart
Figure 8a shows the start page of the application. Figure 8b shows the second page of the application. There are four buttons on this page: fast measurement, sign in, sign up, and exit. If you select fast measurement, there is a possibility to measure without sign in. Sign up screen is showed in Figure 8c. Personal information and his/her physician and family member's detail must be entered. Figure 8d shows the sign in screen. The user can log in using his username and password. Figure 8e shows search devices screen. All the Bluetooth devices near the phone will be listed. Figure 8f shows the select procedures screen. The user can select the glucose, bilirubin, or glucose and bilirubin measurement combination. When the specific measurement is selected, the user is instructed to place his/her finger on the sensor. Figure 8g shows the result screen. There are two buttons in this screen for viewing the options and exiting the application. If the user presses view option, Figure 8h is illustrated. There are some buttons in the option selection screen. These buttons include (i) viewing the glucose or bilirubin chart, (ii) sending SMS or e-mail to doctor, (iii) sending SMS or E-mail to family, and (iv) logging out. Figure 8 (i) shows the screen for drawing glucose or bilirubin chart.
Results
In this study, two types of tests have been conducted to evaluate the system: (1) in vitro experiments on the glucose solution and (2) in vivo experiments on the human body. In the following, each of these tests will be described.
In vitro experiments
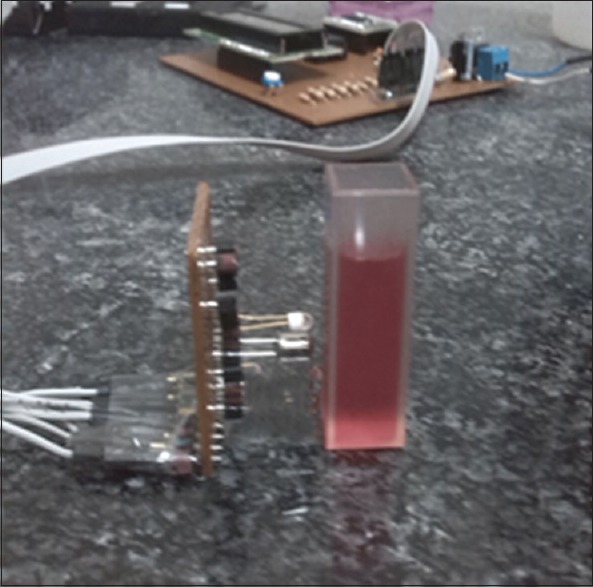
At this stage, 22 solutions with different glucose concentrations in the range of 0–800 mg/dL were obtained by dissolving glucose or dextrose monohydrate powder in distilled water. Moreover, 15 solutions with different concentration in the range of 2–30 ml/dL were obtained from dissolving methyl red powder in acetic acid to test bilirubin. The range of wavelength peak absorption in this solution is similar to the real bilirubin serum, and it provides a good alternative to the bilirubin serum. After preparing all the desired concentrations, each solution was poured to a cuvette. Cuvette is a container used for spectroscopic experiments, in which a beam of light is passed through the sample to measure the absorbance or transmittance. Experiments were conducted in transmittance and reflectance mode in the darkroom to decrease other beams of light. A power supply of 9 V voltage was used to provide the circuit's input voltage. The test was repeated twice for each solution, and the output voltage was recorded. In transmittance mode, the cuvette containing the solution was placed between the transmitters and receiver. Figures 9 and 10 display the test on glucose and the artificial bilirubin solutions in the transmittance mode.
Figure 9.
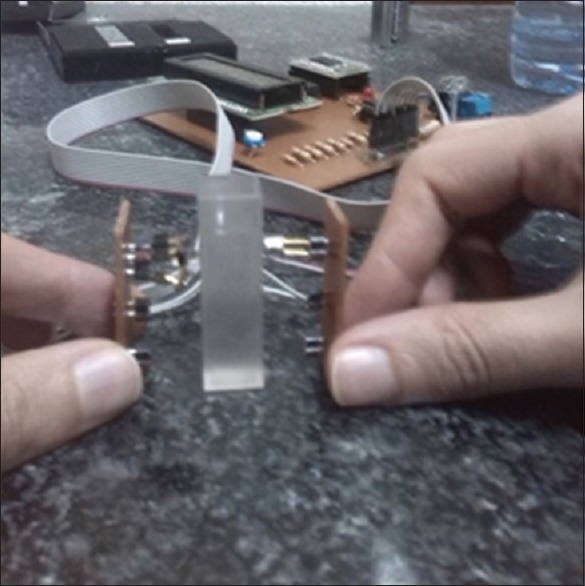
Test on glucose solution in transmittance mode
Figure 10.
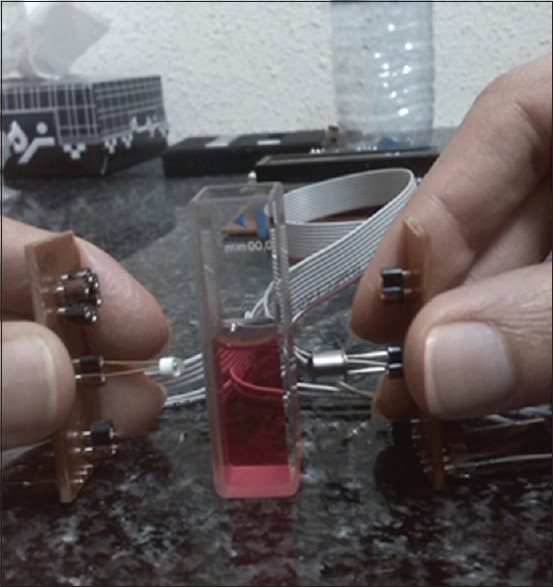
Test on artificial bilirubin solutions in transmittance mode
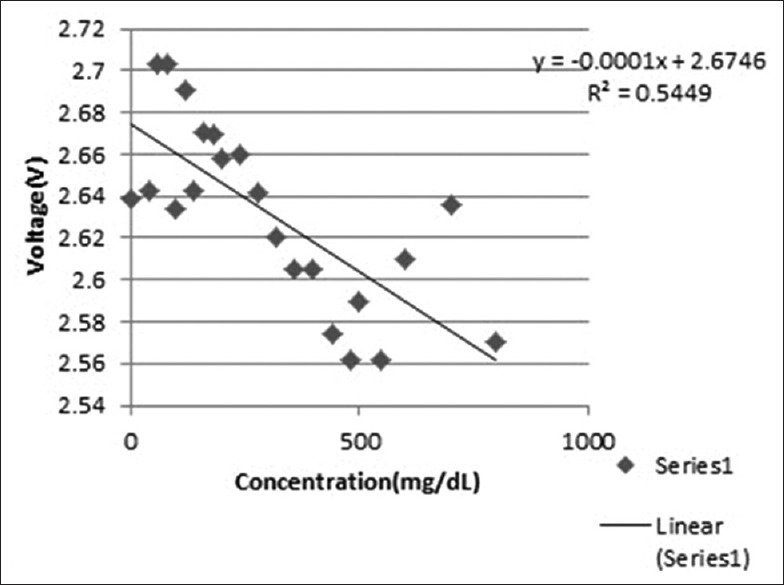
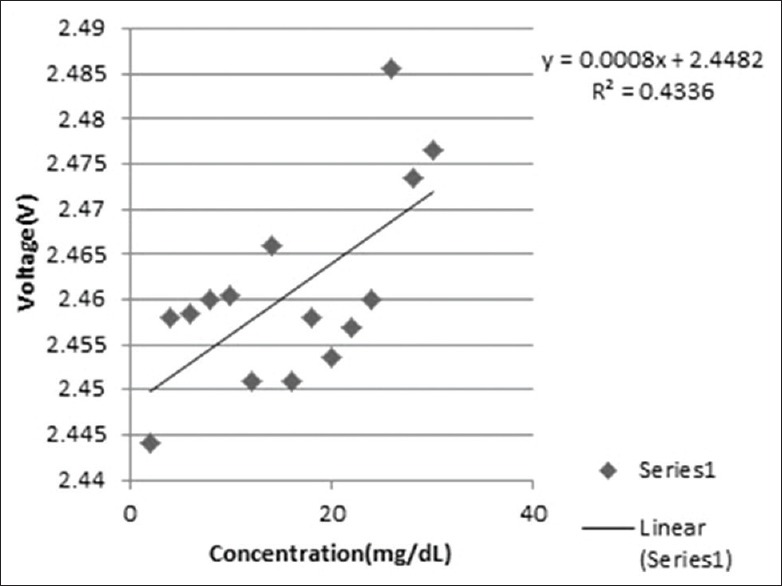
To obtain the relationship between the voltage and the solution's concentrations, a scatter diagram was drawn and the relationship were obtained by the linear regression. Figures 11 and 12 show the graphs. From the results, it can be inferred that the output voltage increases by increasing the concentration of the glucose solution and decreases by increasing the concentration of artificial bilirubin solutions in the transmittance mode.
Figure 11.
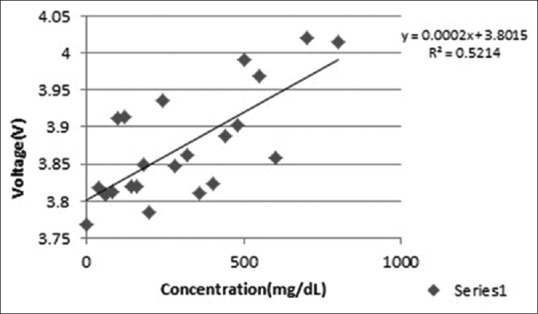
The relationship between the glucose solution concentration and the output voltage in transmittance mode
Figure 12.
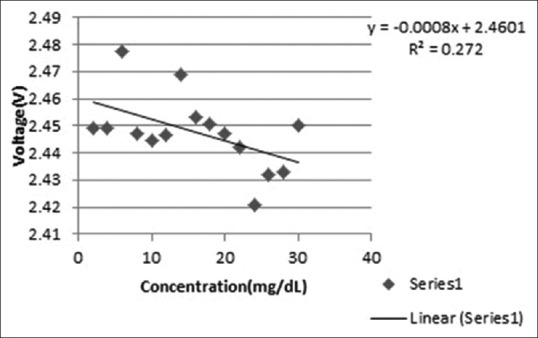
The relationship between the artificial bilirubin solution concentration and the output voltage in transmittance mode
In the reflectance mode, the transmitters and the receiver were placed on the one side and the cuvette on the other side, which is different from the transmittance mode. Here, we only measure the reflected light, but in transmittance mode, we measure the signal passed through the solution. Figures 13 and 14 display the experiment in the reflectance mode.
Figure 13.
Test on glucose solution in the reflectance mode
Figure 14.
Test on artificial bilirubin solution in the reflectance mode
To obtain the relationship between the voltage and the solution concentrations, a scatter diagram was drawn and the relationship was obtained by linear regression. Figure 15 and 16 show the graphs. It can be inferred from the results that the output voltage decreases by increasing the concentration of glucose solution and increases by increasing the concentration of artificial bilirubin solution in the reflectance mode.
Figure 15.
The relationship between the glucose solution concentration and the output voltage in the reflectance mode
Figure 16.
The relationship between the artificial bilirubin solution concentration and the output voltage in the reflectance mode
It was observed that the relationship between the concentration and the output voltage in the transmittance mode is the inverse of the relationship between the concentration and the output voltage in the reflectance mode. This is because, by increasing the transmitted light, the reflected light decreases. In the following section, the experiments performed on the body are mentioned. It was not possible to test jaundice on the baby's body, so these tests were carried out only for the blood glucose.
In vivo experiments
Next, the previous experiments were performed on the body. First, 19 samples were used as the training data to obtain the relationship between the sensor output voltage and the blood glucose concentration. Each person's blood glucose was measured using invasive blood glucose measurement (glucometer). We have used Clever Chek TD 4230 (MACROCITRA ARDANASEJATI) glucometer which is an invasive method to compare with our noninvasive device. Data collections were carried out anonymously with user's consent. In these experiments, finger was selected as a measurement location. Noninvasive blood glucose measurements from the skin surface have been investigated in different locations such as finger, palm, forearm, earlobe, cheek, and arms. The passage of blood in these areas is such that it reduces the errors. Occasionally, a small delay can cause a major complication, especially when the blood glucose is decreasing rapidly. This is because the capillary network in the finger has high density. There is no time lag, and changes affect this area at a rapid pace. Moreover, this is a hairless spot which makes the fingers the most appropriate place to measure the blood glucose.[8] The voltages obtained by the sensor in the transmittance and reflectance mode were recorded. In this section, for more detailed study of the LED transmitter's behavior, the sensor output voltage for each transmitter was also recorded in all experiments and measurement environment was dark. To test the sensor on the body, 9-V rechargeable battery was used. In transmittance mode, the finger is placed between the transmitter and the receiver. Figure 17 shows the appropriate body configuration for experiment's transmittance mode.
Figure 17.
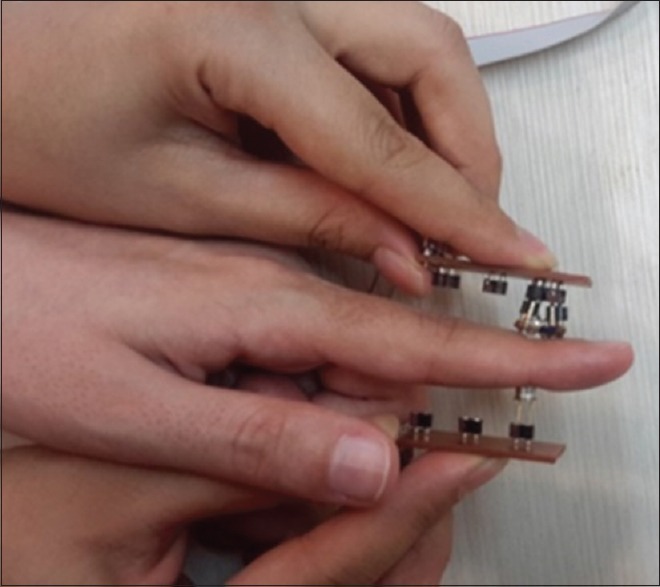
Finger's configuration on the transmittance mode
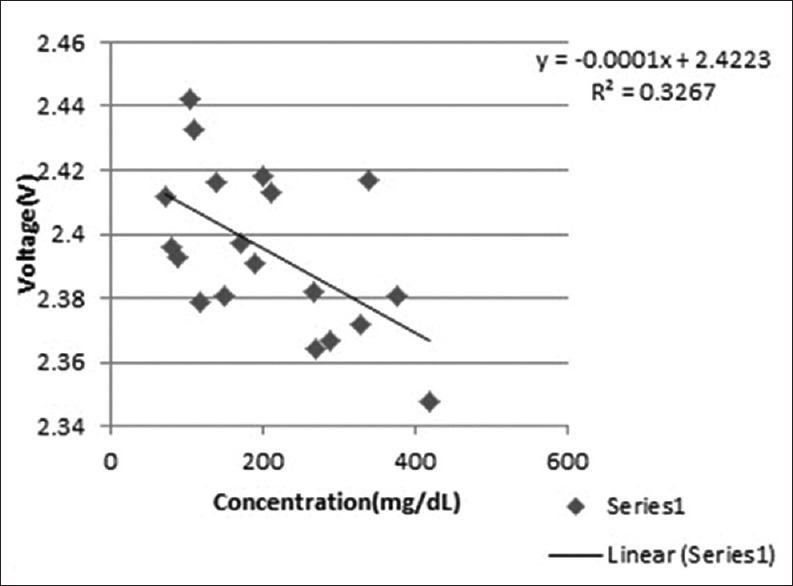
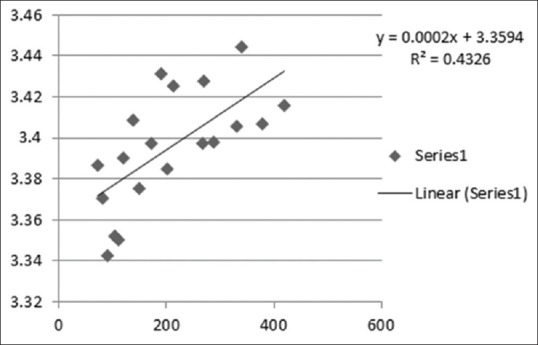
The blood glucose of 19 training data was measured using the glucometer. The sensor output voltage of sensor for these data was recorded. To obtain the relationship between the voltage and the glucose concentrations, scatter diagram was used by producing linear regression line. Figure 18 shows the relationship between the blood glucose concentration and the output voltage on the body in transmittance mode.
Figure 18.
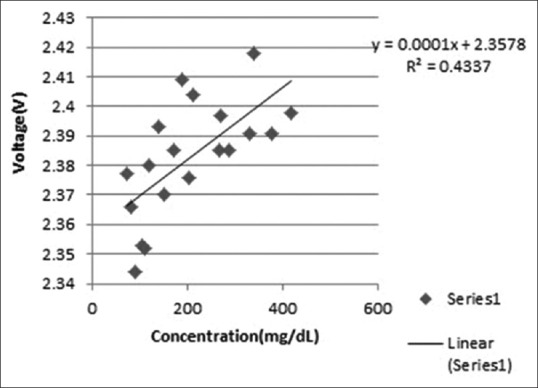
The relationship between the blood glucose concentration and the output voltage on the body in transmittance mode
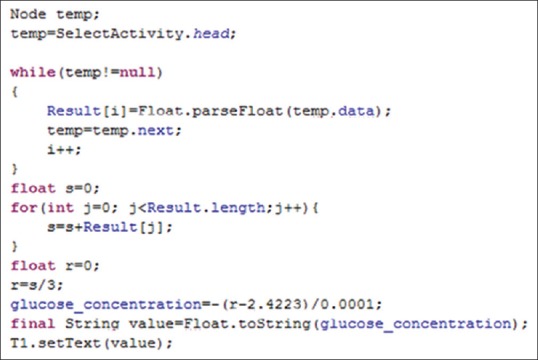
The obtained formula from Figure 11's linear regression was selected and entered in the Android application. The formula converts the voltage to its corresponding glucose concentration. Android code is shown in Figure 19.
Figure 19.
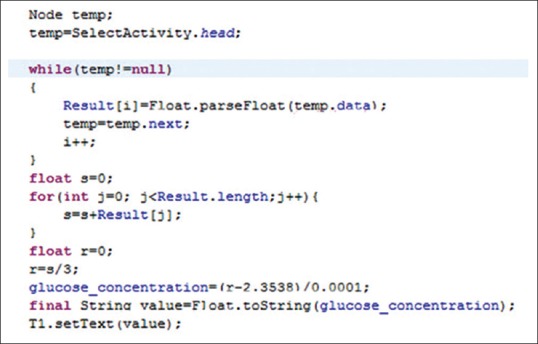
Android codes to convert voltage to glucose concentration in transmittance mode
Then, to evaluate the proposed device, five people's blood glucose was measured with the designed sensor in the transmittance mode. To study the behavior of each transmitter in transmittance mode, the scatter diagram was drawn and the relationship between the voltage and the concentration was obtained by the linear regression. Figure 20 shows diagrams and relationships for 940, 1550, and 1650 nm transmitter in the transmittance mode.
Figure 20.

The relationship between the glucose concentration and the output voltage for 940, 1550, 1650 nm transmitters in transmittance mode
To study the reflectance mode, the transmitters and the receiver were placed on the one side of the finger. Figure 21 shows the finger's configuration in the reflectance mode.
Figure 21.
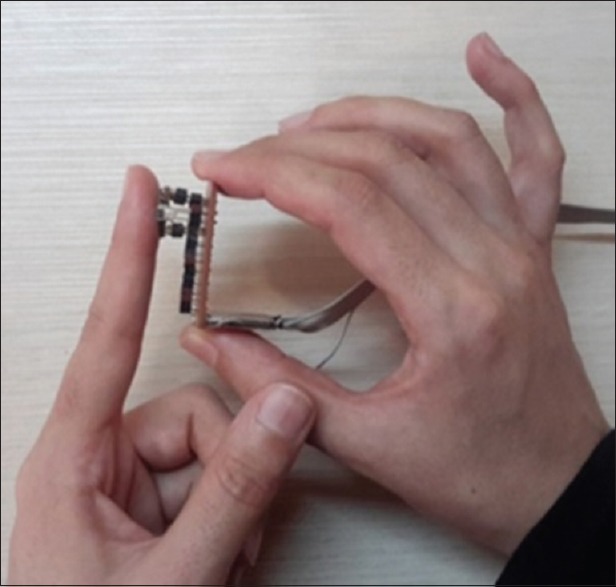
Test on the body in reflectance mode
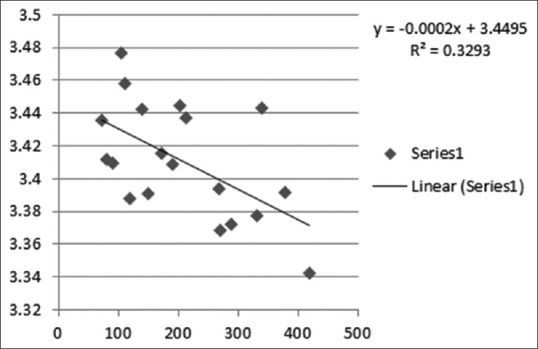
All the steps that have been executed in the transmit mode were repeated in the reflectance mode. Figure 22 shows the scatter diagram for 19 training data.
Figure 22.
The relationship between the blood glucose concentration and the output voltage on the body in reflectance mode
After entering the obtained regression formula to the Android software [Figure 23], the blood glucose of five test data was obtained. Figure 24 shows the diagrams and relationships obtained for the 940, 1550, and 1650 nm wavelengths in the reflectance mode.
Figure 23.
Android codes to convert the voltage to glucose concentration in reflectance mode
Figure 24.

The relationship between the glucose concentration and the output voltage for 940, 1550, and 1650 nm wavelengths transmitters in reflectance mode
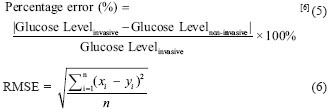
Another option that has been investigated here is the calculation of the final result's average obtained in the transmittance mode and the reflectance mode. It is shown in Eq. 4 where t is glucose concentration obtained from transmittance mode and r is glucose concentration obtained from reflectance mode. This will help reduce the impact of noise data. Table 1 represents the results obtained from the invasive and noninvasive methods. The percentage error was calculated using Eq. 5. The RMSE was calculated by Eq. 6, where xi is the estimated blood glucose by noninvasive method, yi is the measured glucose concentration by invasive method, and n is number of samples.
Table 1.
The average glucose obtained from the combination of the transmittance mode and the reflectance mode
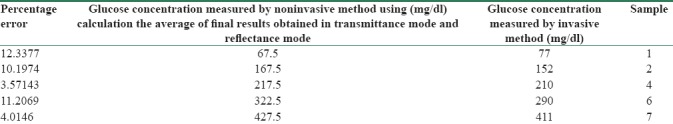
Average glucose concentration = average (t, r) (4)
It can be seen that the percentage error is between 3% and 12% on five people. The average percentage error is 8.27 and RMSE is 18.52 and the P value of the results is 0.12. Figure 25 shows the Clarke error grid analysis between the reference and measured blood glucose.
Figure 25.
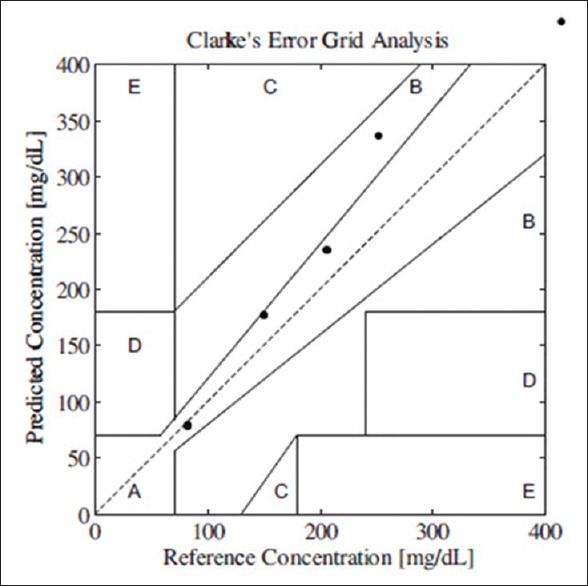
Clarke error grid analyses between reference and measured blood glucose
The error grid divides the plot into five regions of A, B, C, D, and E. According to Yadav et al.,[8] region C would lead to unnecessary treatment, region D indicates wrong detection of hypoglycemia or hyperglycemia, and zone E creates confusion. However, our samples mainly fall in region A, which are acceptable results, and one sample in region B that it will not lead to inappropriate results.
The effect of weighing the voltage values at different wavelengths is evaluated on the results. This is carried out by the spectral response diagram of the infrared receiver. The receiver absorbs wavelengths in the range of 800–1700 nm. Figure 26 shows the spectral response of the receiver that is extracted from its datasheet.[30]
Figure 26.
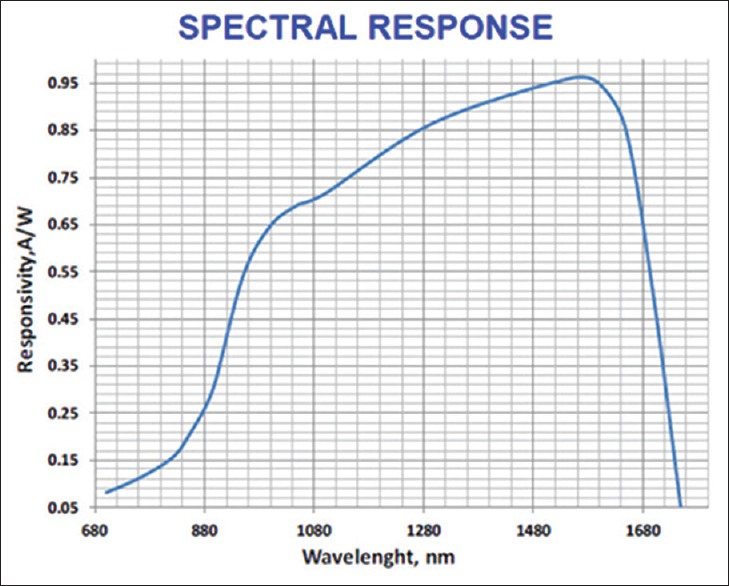
The spectral response of the receiver[30]
The receiver multiplies the actual signal received from each wavelength in numerical order according to Figure 26. If the values of the voltage obtained from each wavelength multiply by the inverse of this number, the actual values of the signal will be obtained. If the calculations are performed with these numbers, the results may be improved.
After applying the changes to the data, the scatter diagram was drawn for 19 training data in the transmittance mode. Then, the linear regression was used to determine the relationship between the glucose concentration and the voltage. Then, the blood glucose for five test data was calculated in the transmittance mode using the new formula. Figure 27 displays the relationship between the glucose concentration and the voltage after the weighing in the transmittance mode.
Figure 27.
Relationship between the blood glucose concentration and the output voltage on the body in transmittance mode after weighing
Furthermore, the scatter diagram was drawn for 19 training data in the reflectance mode. By linear regression, the relationship between the glucose concentration and the voltage was obtained. The blood glucose of five test data was calculated in the reflectance mode using the new formula. Figure 28 displays the relationship between the glucose concentration and the voltage after the weighing in the reflectance mode.
Figure 28.
Relationship between the blood glucose concentration and the output voltage on the body in reflectance mode after weighing
By calculating the average of results obtained in the transmittance and reflectance mode after weighing, the final results were obtained for the five test data [Table 2].
Table 2.
The average glucose obtained from the combination of the transmittance mode and the reflectance mode after weighing
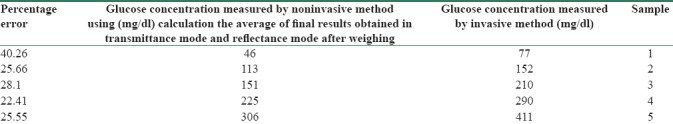
As you can see, the results are not improved. The average percentage error in this mode is 28.4 and RMSE is 65.12. This is because when the light passes through the body's tissue, the optical wavelength that receiver absorbs may vary with the transmitter's wavelength. Therefore, the possible changes due to the wavelength and wave velocity and the side effects of the testing case can cause errors. Consequently, by accepting this error, the results of the weighting are reported.
Glucose measurement could be affected by the intervention of physiological parameters such as variation in body temperature, chemical parameters, triglyceride and albumin levels, and intervention of environmental variations such as changes in temperature, humidity, carbon dioxide, and atmospheric pressure, which are the drawbacks of NIR spectroscopy.[8] In this research also, due to the low sensitivity of the receiver and because of their high expenses, each transmitter does not have a separate receiver. The patient's hand tremor, skin thickness, and not fully aligned transceivers could contribute to build up of errors.
Discussion
In this study, a mobile blood glucose and bilirubin monitoring system was developed. The system included a sensor to measure the blood glucose and bilirubin using NIR spectroscopy and optical method, respectively. An Android application is also developed to communicate with the sensors and provides the remote medical care.
To evaluate the system, in vivo and in vitro experiments were conducted and promising results were achieved. It was observed that the output voltage of noninvasive device increases by increasing the glucose concentration in the transmittance mode and decreases by increasing glucose concentration in the reflectance mode. Moreover, the output voltage of our noninvasive device decreases by increasing the artificial bilirubin solution concentration in transmittance mode and increases by increasing the artificial bilirubin solution concentration in reflectance mode. These data that present good correlation and their relationship were approximately linear. Therefore, it is possible to use noninvasive method to predict the glucose or bilirubin concentration.
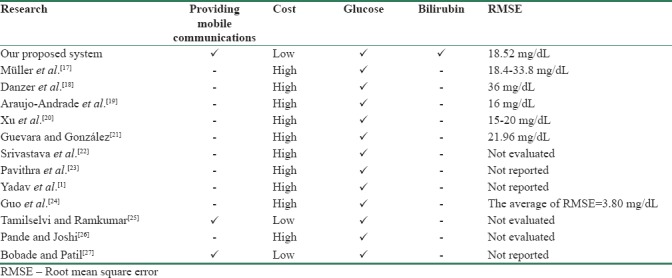
In vivo experiments for glucose were carried out with 19 persons in training phase and five persons were used for testing the data. The glucose behavior model was built into the mobile application. The average glucose concentrations from the transmittance and reflectance mode were obtained. The average percentage error was 8.27 and RMSE was 18.52 mg/dL and the P value of the results was 0.12. Comparing our results with the previous articles, the proposed method is satisfactory while having the advantage of being mobile which makes the system easily accessible anywhere at any time. It is, therefore, deduced that the noninvasive measurement of glucose and bilirubin can be an alternative for invasive glucose and bilirubin measurement methods in the future. Table 3 shows the comparison between the proposed system and previous articles.
Table 3.
The comparison between the proposed system and previous articles
For future works using different wavelength to delete the impact of other substances in the blood, using more sensitive receivers, transmitters with higher wavelength, weighing the result of different transmitters, and checking the effect of pulse width are some offers to improve the results.
Financial support and sponsorship
Nil.
Conflicts of interest
There are no conflicts of interest.
BIOGRAPHIES
Bahareh Javid obtained her BSc. in Information Technology Engineering from Shahrood University of Technology in 2012 and her MSc. in Information Technology Engineering (e-commerce) from University of Qom in 2016. Her research interests include Bioinformatics- Wearable Sensors - Data Mining - Artificial Intelligence.
Email: bahareh.javid@gmail.com

Dr. Faranak Fotouhi-Ghazvini has received her MEng degree in Telecommunication Engineering from King's College London (UK) in 2001 (1st class), and her PhD degree from Bradford University (UK), Department of Informatics in 2011. She is an Assistant professor at Department of Computer Engineering and Information Technology and the director of IOT and Smart Environments Research Group in University of Qom. Her research interests include IOT, Smart Home, Assistive Living and Deep Learning.
Email: f-fotouhi@qom.ac.ir

Fahime Sadat Zakeri obtained her MSc. in Biomedical Engineering from Iran University of Science and Technology in 2009 and her PhD in Biomedical Engineering from Tehran University in 2018. She currently lectures in University of Qom. Her research interests include Bioinformatics, Image processing, Machine Learning.
Email: zakerifahimeh@gmail.com
References
- 1.Yadav J, Rani A, Singh V, Murari BM. Noida, India: IEEE; Near-infrared LED based non-invasive blood glucose sensor. 2014 International Conference on Signal Processing and Integrated Networks (SPIN) [Google Scholar]
- 2.Zhou F, Yang HI, Álamo JM, Wong JS, Chang CK. Berlin, Heidelberg: Springer; 2010. Mobile personal health care system for patients with diabetes. International Conference on Smart Homes and Health Telematics. [Google Scholar]
- 3.Quinn CC, Gruber-Baldini AL, Shardell M, Weed K, Clough SS, Peeples M, et al. Mobile diabetes intervention study: Testing a personalized treatment/behavioral communication intervention for blood glucose control. Contemp Clin Trials. 2009;30:334–46. doi: 10.1016/j.cct.2009.02.004. [DOI] [PubMed] [Google Scholar]
- 4.Krushinitskaya O. Vestfold University College; 2012. Osmotic Sensor for Blood Glucose Monitoring Applications. [Google Scholar]
- 5.Oliver NS, Toumazou C, Cass AE, Johnston DG. Glucose sensors: A review of current and emerging technology. Diabet Med. 2009;26:197–210. doi: 10.1111/j.1464-5491.2008.02642.x. [DOI] [PubMed] [Google Scholar]
- 6.Buda RA. Universiti Teknologi Malaysia; 2014. A Portable Non-Invasive Blood Glucose Monitoring Device. [Google Scholar]
- 7.Vashist SK. Non-invasive glucose monitoring technology in diabetes management: A review. Anal Chim Acta. 2012;750:16–27. doi: 10.1016/j.aca.2012.03.043. [DOI] [PubMed] [Google Scholar]
- 8.Yadav J, Rani A, Singh V, Murari BM. Prospects and limitations of non-invasive blood glucose monitoring using near-infrared spectroscopy. Biomed Signal Proc Control. 2015;18:214–27. [Google Scholar]
- 9.Tura A, Maran A, Pacini G. Non-invasive glucose monitoring: Assessment of technologies and devices according to quantitative criteria. Diabetes Res Clin Pract. 2007;77:16–40. doi: 10.1016/j.diabres.2006.10.027. [DOI] [PubMed] [Google Scholar]
- 10.Govada A, Renumadhavi C, Ramesh K. Non-invasive blood glucose measurement. Int J Adv Res Comput Commun Eng. 2014;3:5122–5. [Google Scholar]
- 11.Ali N, Muji S, Joret A, Amirulah R, Podari N, Risep ND. Optical technique for jaundice detection. ARPN J Eng Appl Sci. 2006;10:9929–33. [Google Scholar]
- 12.Osman Z, Ahmad A, Muharam A. Kuala Lumpur, Malaysia: IEEE; 2014. Rapid prototyping of neonatal jaundice detector using skin optics theory. 2014 IEEE Conference on Biomedical Engineering and Sciences (IECBES) [Google Scholar]
- 13.Kudavelly S, Keswarpu P, Balakrishnan S. Binjiang, China: IEEE; 2011. A simple and accurate method for estimating bilirubin from blood. 2011 IEEE Instrumentation and Measurement Technology Conference (I2MTC) [Google Scholar]
- 14.Ali N, editor A Review of Non_Invasive Jaundice detection using Optical Technique in Neonates. Conference in Advances in Computing, Electronics and Electrical Technology-CEET. 2014 [Google Scholar]
- 15.Ng H, Sim M, Tan CM, Wong C. Wireless technologies for telemedicine. BT Technol J. 2006;24:130–7. [Google Scholar]
- 16.Goyal S, Morita P, Lewis GF, Yu C, Seto E, Cafazzo JA, et al. The systematic design of a behavioural mobile health application for the self-management of type 2 diabetes. Can J Diabetes. 2016;40:95–104. doi: 10.1016/j.jcjd.2015.06.007. [DOI] [PubMed] [Google Scholar]
- 17.Müller UA, Mertes B, Fischbacher C, Jageman KU, Danzer K. Non-invasive blood glucose monitoring by means of near infrared spectroscopy: Methods for improving the reliability of the calibration models. Int J Artif Organs. 1997;20:285–90. [PubMed] [Google Scholar]
- 18.Danzer K, Fischbacher C, Jagemann K, Reichelt K. Near-infrared diffuse reflection spectroscopy for non-invasive blood-glucose monitoring. LEOS Newslett. 1998;12:9. [Google Scholar]
- 19.Araujo-Andrade C, Ruiz F, Martínez-Mendoza J, Terrones H. Guanajuato, Gto. (Mexico): AIP; 2004. Non-invasive in vivo blood glucose levels prediction using near infrared spectroscopy. AIP Conference Proceedings. [Google Scholar]
- 20.Xu K, Qiu Q, Jiang J, Yang X. Non-invasive glucose sensing with near-infrared spectroscopy enhanced by optical measurement conditions reproduction technique. Optics Lasers Eng. 2005;43:1096–106. [Google Scholar]
- 21.Guevara E, González F. Joint optical-electrical technique for noninvasive glucose monitoring. Rev Mex Fis. 2010;56:430–4. [Google Scholar]
- 22.Srivastava A, Chowdhury MK, Sharma S, Sharma N. Blood glucose monitoring using non invasive optical method: Design limitations and challenges. Int J Adv Res Electr Electron Instrum Eng. 2013;2:615–20. [Google Scholar]
- 23.Pavithra A, Karan DM, Kumar DA, Anu Shalin P. Non invasive technique to measure glucose and haemoglobin level in blood using NIR-occlusion spectroscopy. Int J Sci Res Manag. 2014;2:756–62. [Google Scholar]
- 24.Guo D, Shang Y, Peng R, Yong S, Wang X. Noninvasive blood glucose measurement based on NIR spectrums and double ANN analysis. J Biosci Med. 2015;3:42. [Google Scholar]
- 25.Tamilselvi M, Ramkumar G, editors . Madurai, India: IEEE; 2015. Non-invasive tracking and monitoring glucose content using near infrared spectroscopy. Computational Intelligence and Computing Research (ICCIC). 2015 IEEE International Conference. [Google Scholar]
- 26.Pande MC, Joshi A. Non-invasive blood glucose measurement. Int J Comput Eng Res. 2015;5:26–8. [Google Scholar]
- 27.Bobade CD, Patil MS. Non-invasive blood glucose level monitoring system for diabetic patients using near-infrared spectroscopy. Am J Comput Sci Inf Technol. 2016;4 [Google Scholar]
- 28.Baharuddin H, Sulong MS, Joret A, Ab Rahman T, Ismail N. Malaysia: 2010. Bile pigments detection via IR sensor. 3rd Engineering Conference on Advancement in Mechanical and Manufacturing for Sustainable Environment; pp. 1–3. [Google Scholar]
- 29.Penhaker M, Kasik V, Hrvolová B. Advanced bilirubin measurement by a photometric method. Elektronika Elektrotechnika. 2013;19:47–50. [Google Scholar]
- 30.InGaAs Photodetector PRELIMINARY SD012-151-011. [Last accessed on 2018 Apr 20]. Available from: http://lunainc.com/wp-content/uploads/2016/06/012151011.pdf .