Abstract
In June 2013, a change to the liver waitlist priority algorithm was implemented. Under Share-35, regional candidates with MELD≥35 receive higher priority than local candidates with MELD<35. We compared liver distribution and mortality in the first 12 months of Share-35 to an equivalent time period before. Under Share-35, new listings with MELD≥35 increased slightly from 752 (9.2% of listings) to 820 (9.7%, p=0.3), but the proportion of deceased-donor liver transplants (DDLTs) allocated to recipients with MELD≥35 increased from 23.1% to 30.1% (p<0.001). The proportion of regional shares increased from 18.9% to 30.4% (p<0.001). Sharing of exports was less clustered at only a handful of centers (Gini coefficient decreased from 0.49 to 0.34), but there was no evidence of change in CIT (p=0.8). Total adult DDLT volume increased from 4133 to 4369, and adjusted odds of discard decreased by 14% (p=0.03). Waitlist mortality decreased by 30% among patients with baseline MELD>30 (SHR=0.70, p<0.001) with no change for patients with lower baseline MELD (p=0.9). Post-transplant length-of-stay (p=0.2) and post-transplant mortality (p=0.9) remained unchanged. In the first 12 months, Share-35 was associated with more transplants, fewer discards, and lower waitlist mortality, but not at the expense of CIT or early post-transplant outcomes.
INTRODUCTION
On June 18, 2013, the Organ Procurement and Transplantation Network (OPTN) in the United States implemented Share-35, a change to the allocation system for deceased donor livers (1, 2). Prior to Share-35, most deceased donor livers were offered first to waitlist candidates in the local Donation Service Area (DSA) where the liver became available for transplant ("local candidates"); only livers refused by all local candidates with Model for End-Stage Liver Disease (MELD) ≥15 were offered to candidates listed in other DSAs in the OPTN Region ("regional candidates"). Under Share-35, deceased donor livers are offered first to all candidates in the Region with MELD of 35 or higher, regardless of DSA, before being offered to other local candidates and then regional candidates.
Although simulations suggested that such an allocation system would lead to a decrease in overall waitlist mortality (1), the change was controversial. By increasing the number of regionally shared livers, Share-35 had the potential to increase travel distance and therefore cold ischemia time (CIT), as well as to lower liver availability in some parts of the country, increasing the number of waitlist deaths. Moreover, there was no guarantee that the decline in mortality predicted by the simulation would actually occur.
To better understand the effects of this policy change, we conducted a national study of listing practices, liver distribution, transport distance, estimated transport time, CIT, transplant rates, discard rates, waitlist mortality, and early post-transplant outcomes (length of stay (LOS) and mortality) before and after implementation of Share-35.
METHODS
Data source
This study used data from the Scientific Registry of Transplant Recipients (SRTR). The SRTR data system includes data on all donor, wait-listed candidates, and transplant recipients in the US, submitted by the members of the OPTN, and has been described elsewhere (3). The Health Resources and Services Administration (HRSA), U.S. Department of Health and Human Services provides oversight to the activities of the OPTN and SRTR contractors.
Study population
We compared a population of new and prevalent adult liver waitlist candidates and deceased donor liver transplant recipients from June 18, 2012 – June 17, 2013 (12 months prior to implementation of Share-35, denoted "pre-Share35") to a population from June 18, 2013 – June 17, 2014 (12 months following implementation of Share-35, denoted "post-Share35").
Listing practices
For patients whose initial listing occurred during the study period (excluding patients who were inactive at listing), we compared allocation MELD (AMELD, that is, the higher of lab MELD or exception points) (4) pre-Share35 vs. post-Share35 using a rank-sum test. We compared the proportion of patients who were inactive at listing pre-Share35 vs. post-Share35 using a χ2 test.
Liver utilization
We compared the discard rate of adult deceased donor livers pre-Share35 and post-Share35 using a χ2 test. To ensure that any changes in discard rate were not a result of changes in the donor pool, we compared liver Donor Risk Index (DRI) pre-Share35 and post-Share35 using a t-test (5), and calculated an adjusted odds ratio of discard using logistic regression. We also compared import status of transplanted livers (local, regional share, or national share) using a χ2 test. We calculated transport distance from donor hospital to recipient transplant center as the arc distance calculated with latitudes and longitudes, and compared travel distance and estimated transport time pre-Share35 to post-Share35 using linear regression on the log of each quantity to obtain a proportional difference (6).We compared CIT pre-Share35 to post-Share35 using a rank-sum test, excluding data on transplants on or after April 2014 since exploratory data analysis showed higher rates of missingness for CIT past this date. We graphed the proportion of transplanted livers that were regional or national shares for each decile of liver DRI, pre-Share35 and post-Share35, and used logistic regression to examine the association between DRI and odds of sharing.
AMELD at transplant
We compared the distribution of AMELD (4) at transplant pre-Share35 versus post-Share35 using a rank-sum test. We calculated the rate of liver transplantation at a given AMELD score, measured in transplants per person-year. We produced graphs of transplant rate for each AMELD value (transplants per person-year), separately for pre-Share35 and post-Share35. We calculated the effect of Share-35 on transplant rate using Poisson regression, adjusting for AMELD. We then repeated this analysis, stratifying by tercile of OPO organ availability (total organs recovered in an OPO pre-Share35 divided by total number of new waitlist registrants pre-Share35).
DSA-level effects
To assess DSA-level changes in liver distribution associated with Share-35, we produced a histogram of the change in transplant volume at each DSA. We used Lorenz curves (7, 8) to compare DSA-level inequality of liver imports and exports pre-Share35 and post-Share35. We computed each DSA's share of all transplants in the region (total transplant volume for each DSA divided by total volume in the region) pre- and post-Share35, and calculated the correlation coefficient between DSA share of all transplants pre- and post-Share35. For both the pre-Share35 and post-Share35 periods, we produced DSA-level maps of net import (total number of livers imported to the OPO minus total number of livers exported) and of rate of transplant among waitlist registrants, modeled by multilevel Poisson regression adjusted for patient AMELD at listing.
Waitlist mortality
Waitlist mortality is influenced by the competing risk of transplantation (9). In other words, changes in the rate of transplantation will affect the total number of deaths, even if the underlying health of waitlist registrants does not change. We graphed cumulative incidence of waitlist mortality, accounting for the competing risk of transplantation, using the technique of Coviello and Boggess (10). Date of listing was used as the time origin, with late entries for patients who patients who listed prior to the start of the pre-Share35 era. Dropout from the waitlist due to deteriorating condition was treated as equivalent to mortality. We also performed competing risks regression using the technique of Fine and Gray (11, 12). To account for possible differences in case mixture, we adjusted for baseline AMELD, that is, the first active AMELD recorded in each period (pre-Share35 or post-Share35) for each patient. We did not adjust for AMELD as a time-varying covariate: since allocation policy can affect AMELD progression (i.e. a patient's AMELD may increase because they failed to obtain a transplant due to allocation policy), post-baseline changes in MELD mediate, rather than confound, any association between Share-35 and waitlist mortality (13). To examine whether any association between Share-35 and waitlist mortality was modified by baseline MELD, we repeated the competing risks analysis with the population stratified by three categories of baseline AMELD (6–20, 21–30, and 31–40). We compared MELD at time of death pre- and post-Share35 using a ranksum test.
Early post-transplant outcomes
We compared post-transplant LOS and mortality pre-Share35 and post-Share35. In order to reduce the risk of bias due to delayed reporting, we analyzed LOS only of transplants on or before November 18, 2013, five months after the start of Share-35. We also excluded all LOS values exceeding 120 days, since patients who were transplanted on November 18, 2013 with LOS exceeding 120 days might not have LOS reported before the end of our study. We compared overall distribution of post-transplant LOS pre- and post-Share35 using a rank-sum test, and compared the proportion of patients with LOS exceeding 40 days (approximately the 95th percentile of overall LOS) using a χ2 test.
We also compared rates of 7-day retransplantation pre- and post-Share35 using a Χ2 test, and rates of post-transplant mortality using a log-rank test. In order to reduce the risk of reporting bias for post-transplant mortality, we included only outcomes of transplants on or before November 18, 2013 (seven months prior to end-of-followup in our dataset), and censored all patients on this date. As a sensitivity analysis, we compared ascertainment of deaths from our July 2014 dataset to an earlier SRTR dataset from March 2012. We found that 99% of death records from August 2011 as ascertained in the 2014 dataset also appeared in the 2012 dataset. In other words, death ascertainment 6.1–7 months prior to end-of-followup was 99%.
Reporting bias was not a concern for retransplantation, since transplants are reported immediately to UNOS. Retransplantation and post-transplant mortality analyses did not adjust for MELD at transplant because MELD at transplant would mediate, rather than confound, any association between Share-35 and post-transplant outcomes.
Overall mortality
We compared overall mortality, irrespective of transplantation, among waitlist registrants pre-Share35 and post-Share35. As with the post-transplant outcomes analysis, we censored all waitlist registrants at November 18, 2013 in order to reduce the risk of ascertainment bias. We used Poisson regression, adjusting for MELD at the start of each era (the earlier of June 18, 2012 or listing date for pre-Share35; the earlier of June 18, 2013 or listing date for post-Share35) and did not censor for transplantation. We did not adjust for time-varying MELD because changes in underlying health would mediate, rather than confound, any relationship between Share-35 and mortality.
Statistical Analysis
Confidence intervals are reported as per the method of Louis and Zeger (14). Analyses were performed using Stata 13.0/MP for Linux (College Station, Texas), R 3.0.2 (Vienna, Austria), and ArcGIS (Redlands, CA). As sensitivity analyses, we reproduced our analysis comparing the first 2.5 months of Share-35 (through September 1, 2013) the first 4.5 months of Share-35 (through December 1, 2013), and the first 9 months of Share-35 (through March 18, 2014) to equivalent pre-Share35 time periods.
RESULTS
Waitlist registrants
The number of new listings increased from 10,999 pre-Share35 to 11,430 post-Share35. Median (IQR) AMELD at listing among new registrants was 18 (12–23) pre-Share35 and 17 (12–23) post-Share35. There was no evidence of change in AMELD at listing from pre-Share35 to post-Share35 among active registrants (p=0.6). The number of patients listing at MELD 35 or above increased slightly but not statistically significantly, from 1015 of 10,999 listings pre-Share35 (9.2%) to 1113 of 11,430 listings post-Share35 (9.7%) (p=0.2). The proportion of patients who were inactive at listing was unchanged, at 446 out of 10,999 listings pre-Share35 (4.1%) and 445 out of 11,430 listings post-Share35 (3.9%) (p=0.5).
Discards
Pre-Share35, among adult deceased donor organs made available for transplant, there were 5251 liver transplants and 643 discards (10.9% discard rate). Post-Share35, there were 5602 transplants and 609 discards (9.8% rate) (p=0.046). There was no evidence of change in liver DRI from pre-Share35 to post-Share35 (median (IQR) pre-Share35=1.37 (1.13–1.64), post-Share35=1.37 (1.12–1.64), p=0.9). Adjusting for liver DRI, Share35 was associated with a 14% decrease in the odds of discard (adjusted OR= 0.78 0.88 0.99, p=0.04).
Regional sharing
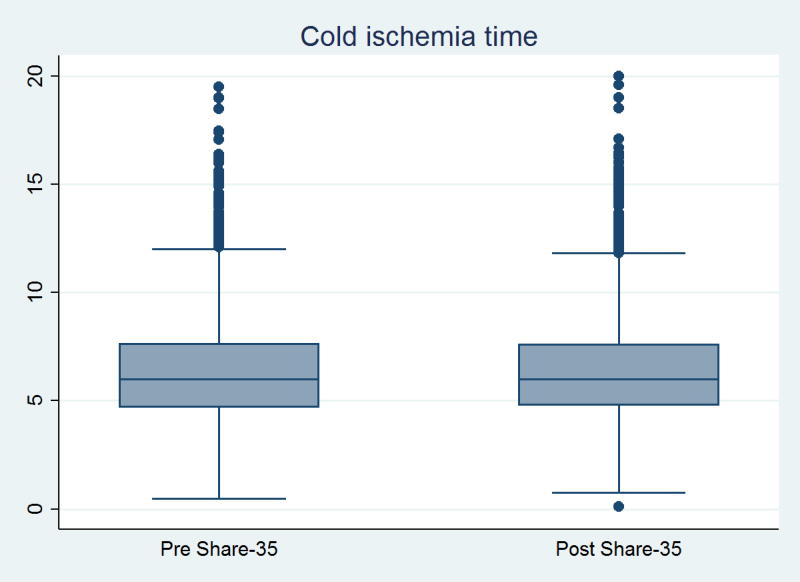
The number of deceased donor livers allocated locally decreased from 4329 pre-Share35 (77.9% of all transplants) to 3857 (65.6% of all transplants), while the number of regional shares increased from 1060 (19.1%) to 1805 (30.7%) (p<0.001) (Table 1). The proportion of transplants that were regional shares increased in every UNOS region except Region 9, which had regional sharing before Share-35 (1). The greatest increases came in Regions 4, 5, and 7 (Table 2). Pre-Share35, median (IQR) transport distance was 61 (8–180) miles, and median (IQR) estimated transport time was 1.29 (0.33–1.90) hours; 7.0% of transplants involved more than 500 miles of transport. Post-Share35, median (IQR) travel distance was 91 (12–238) miles, and median (IQR) estimated transport time was 1.66 (0.42–1.98) hours; 8.5% of transplants involved more than 500 miles of transport. Average travel distance increased by 37% (ratio=1.27 1.37 1.48, p<0.001), and average travel time increased by 17% (ratio = 1.12 1.17 1.22, p<0.001). However, there was no evidence of change in the distribution of CIT (median (IQR) pre-Share35 = 6.0 (4.7–7.7) hours vs. post-Share35 = 6.0 (4.8–7.7) hours, p=0.8) (Figure 1).
Table 1. Sharing of adult deceased donor liver transplants, before and after Share-35.
| Pre-Share35 (N=5557) |
Post-Share35 (N=5878) |
p-value | |
|---|---|---|---|
|
|
|
|
|
| Local | 4329 (77.9%) | 3857 (65.6%) | |
| Regional | 1060 (19.1%) | 1805 (30.7%) | <0.001 |
| National | 168 (3.0%) | 216 (3.7%) | |
| No MELD exception | 2605 (63.0%) | 2759 (63.1%) | |
| HCC exception | 742 (18.0%) | 719 (16.5%) | 0.1 |
| Non-HCC exception | 786 (19.0%) | 891 (20.4%) |
Table 2. Regional and national sharing, pre-and post-Share35, by UNOS region of transplant.
Regional sharing increased in 10 of the 11 UNOS regions. The greatest increases in regional sharing were in regions 4, 5, and 7, All regions had an increase in regional sharing, except Region 9, which had a single waitlist (full regional sharing) prior to the implementation of Share-35.
| UNOS region |
Pre-Share35 | Post-Share35 | ||
|---|---|---|---|---|
| % Regional | % National | % Regional | % National | |
|
|
|
|
|
|
| 1 | 4.4% | 22.4% | 5.3% | 18.4% |
| 2 | 9.8% | 2.1% | 25.6% | 3.0% |
| 3 | 27.5% | 0.8% | 32.1% | 3.1% |
| 4 | 4.7% | 0.9% | 26.1% | 0.6% |
| 5 | 21.9% | 1.7% | 49.8% | 2.2% |
| 6 | 6.3% | 0.0% | 11.4% | 0.0% |
| 7 | 5.3% | 5.3% | 29.2% | 4.5% |
| 8 | 22.4% | 2.2% | 25.1% | 1.2% |
| 9 | 37.2% | 10.0% | 33.3% | 11.1% |
| 10 | 24.1% | 3.1% | 32.8% | 7.5% |
| 11 | 26.7% | 1.1% | 27.4% | 0.9% |
Figure 1. Cold ischemia time, before and after implementation of Share-35.
Median (IQR) CIT was 6.0 (4.7–7.6) hours pre-Share35 and 6.0 (4.8–7.8) hours post-Share35. There was no statistically significant difference in CIT per ranksum test (p=0.8). For the sake of illustration, outlier points with > 20 hours CIT are omitted (N=30 pre-Share35, N=38 post-Share35).
Regional/national sharing, by DRI
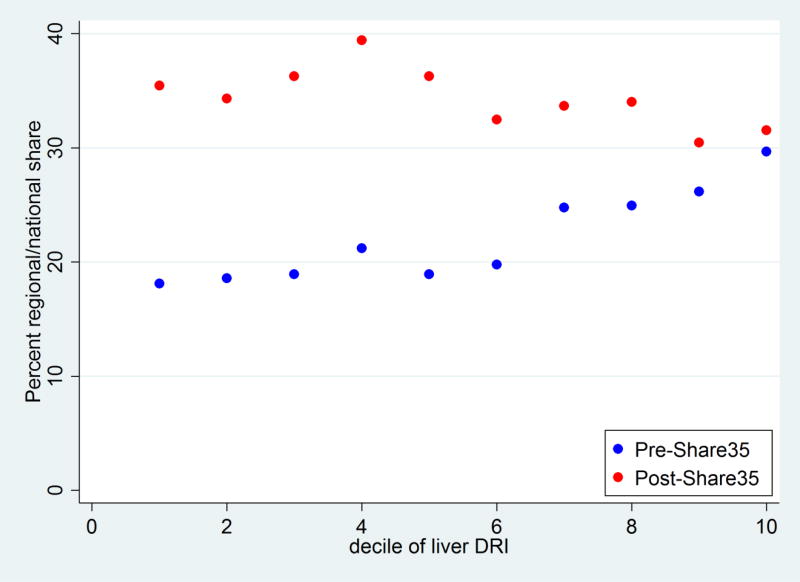
Pre-Share35, livers with a higher DRI were more likely to be regional or national shares (OR per unit of DRI = 1.52 1.82 2.20, p<0.001). Livers in the lowest decile of DRI had an 18.1% chance of being shared, while livers in the highest decile of DRI had a 29.7% chance of being shared (Figure 2). Post-Share35, livers with a higher DRI were less likely to be regional or national shares (OR per unit of DRI = 0.68 0.79 0.93, p<0.01). Livers in the lowest decile of DRI had a 35.5% chance of being shared, while livers in the highest decile had a 31.6% change of being shared (Figure 2).
Figure 2. Probability of regional or national share among transplanted livers, pre-Share35 and post-Share35.
Pre-Share35, livers with higher DRI were more likely to be shared (p<0.001). Post-Share35, livers with lower DRI were more likely to be shared (p<0.01), although the association was less strong.
AMELD at transplant
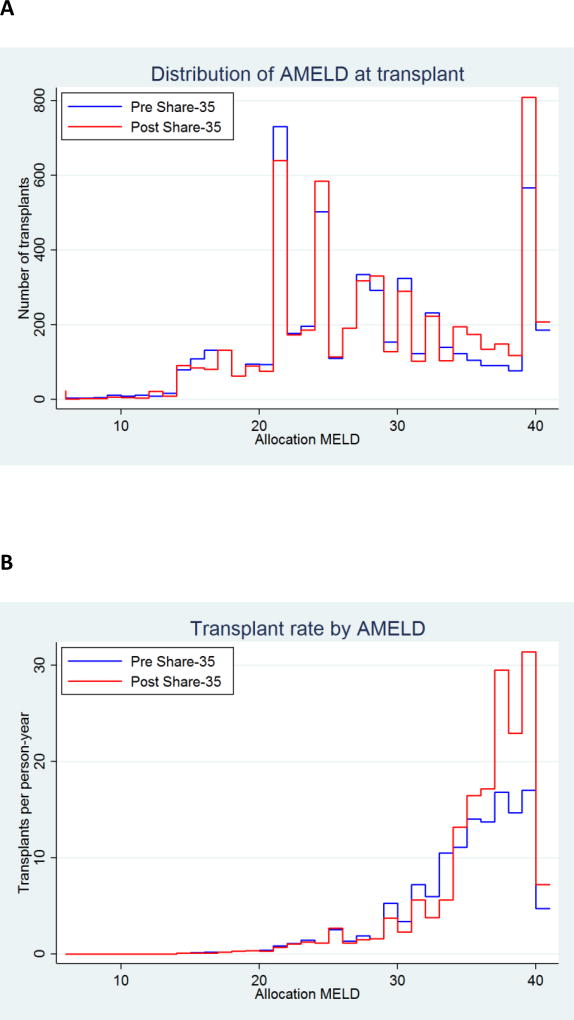
AMELD at transplant increased under Share35 (p<0.001) (Figure 3). The number of recipients with AMELD 31–34 decreased, offset by an increase in the number of recipients with AMELD ≥35 (Figure 3A). The proportion of transplant recipients with AMELD ≥35 increased from 22.3% to 30.5% (p<0.001). The rate of transplant increased among waitlist registrants with AMELD ≥35, particularly for registrants with AMELD 38–40 (Figure 3B).
Figure 3. Distribution of AMELD (allocation priority based on MELD or exception points) at transplantation, before and after implementation of Share 35.
Status 1 recipients are categorized as AMELD=41. (A) Number of transplants at each AMELD. Post-Share35, there were more total transplants, and more transplants with AMELD ≥35. AMELD at transplant increased under Share-35 (Wilcoxson rank-sum p=<0.001). The proportion of transplants with AMELD ≥35 increased from 22.3% to 30.5% (χ2 p=<0.001). (B) Rate of transplants for waitlist registrants at each AMELD score. Under Share-35, the transplant rate increased for AMELD ≥35, particularly for patients with AMELD ≥38.
Transplant rates and organ availability
Adjusting for AMELD, the rate of transplant per person-year decreased by 5% for patients with AMELD < 35 (IRR=0.91 0.95 0.99, p=0.01), but increased by 27% for patients with AMELD ≥ 35 (IRR=1.18 1.27 1.35, p<0.001). When stratified by tercile of OPO organ availability, change in transplant rate was not statistically significant for AMELD < 35 (IRR for low-availability, medium-availability, and high-availability OPOs = 0.88 0.94 1.00, 0.90 0.97 1.04, and 0.88 0.96 1.05 respectively). However, for AMELD ≥ 35, the transplant rate increased the most in OPOs with low organ availability while decreasing in OPOs with high organ availability (IRR for low-availability, medium-availability, and high-availability OPOs = 1.33 1.47 1.62, 1.14 1.27 1.41, and 0.31 0.36 0.43 respectively). In other words, the rate of transplant for candidates with the highest AMELD scores increased by 47% percent in OPOs with low organ availability, while decreasing by 64% in OPOs with high organ availability. Even after this change, compared to low-availability OPOs, the post-Share35 rate of transplants for candidates with the highest AMELD scores was 16% higher in medium-availability OPOs and 53% higher in high-availability OPOs and (IRR=1.05 1.16 1.28 and 1.33 1.53 1.76, respectively) when compared with their lower-availability OPO counterparts. In other words, after Share-35, rate of transplant for the sickest patients increased in low-availability OPOs and decreased in high-availability OPOs, but high-availability OPOs still had higher transplant rates after the policy change.
DSA-level effects: Volume
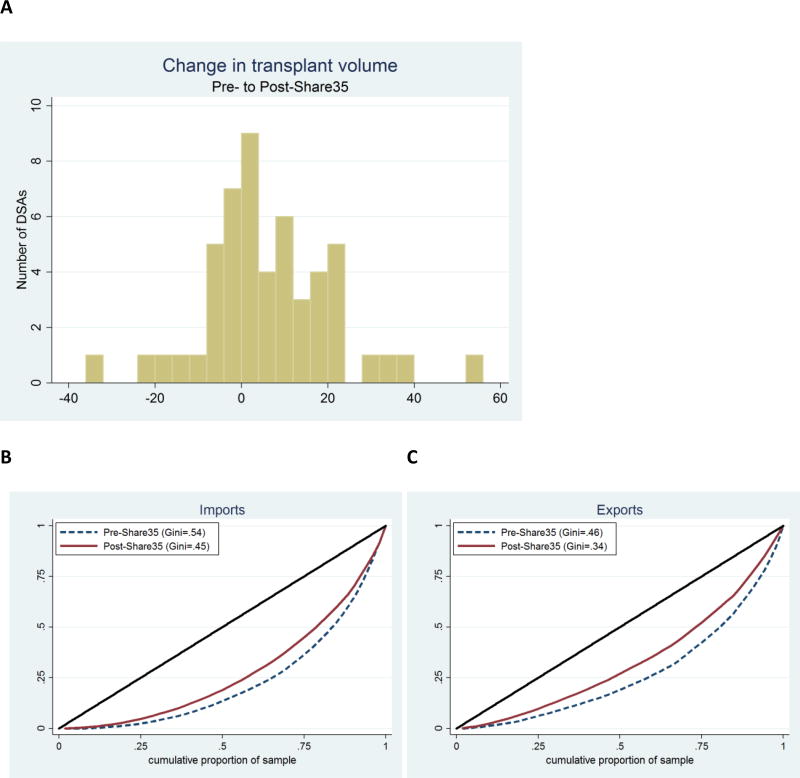
As compared to the pre-Share35 period, deceased donor liver transplant volume in the post-Share35 period increased in 32 DSAs, stayed the same in 3 DSAs, and decreased in 17 DSAs (Figure 4A). Volume decreased by more than 20% in only 2 DSAs, and increased by more than 20% in 6 DSAs. Median (IQR) change in volume was 4 (−2 to 15) transplants, consistent with the increase in number of transplants and decrease in discard rate associated with Share35.
Figure 4. DSA-level change in transplant volume and imports/exports.
(A) Histogram of DSA change in transplant volume from pre-Share35 to post-Share35. Compared to the pre-share35 period, in the post-Share35 period 32 DSAs had increased volume, three DSAs had the same volume, and 17 DSAs had decreased volume. (B) Lorenz curves of imports by DSA pre-Share35 and post-Share35. The curve for the post-Share35 period is closer to the diagonal line, indicating broader sharing of liver imports. (C) Lorenz curves of exports by DSA pre-Share35 and post-Share35. Similar to imports, the curve for the post-Share35 period is closer to the diagonal line, indicating broader distribution of liver exports.
DSA-level effects: Clustering
Liver imports were more broadly distributed among DSAs post-Share35 (pre-Share35 Gini coefficient = 0.54; post-Share35 Gini coefficient = 0.45, Figure 4B). In the pre-Share35 period, half of all imports were clustered among the top 9 importing OPOs; in the post-Share35 period, half of all imports were clustered among the top 12 importing OPOs. Similarly, exports were more broadly distributed among DSAs post-Share35 (pre-Share35 Gini=0.46; post-Share35 Gini=0.34, Figure 4C).
DSA-level effects: Sharing
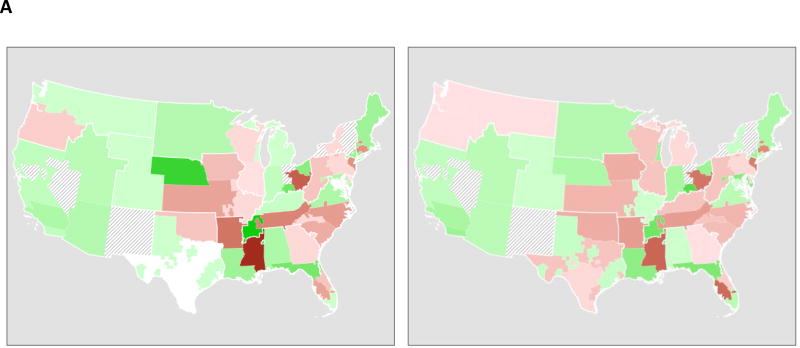
The proportion of transplants within a region that occurred within each DSA were almost entirely unchanged; correlation between each DSA's share of transplants within the region pre-Share35 and post-Share35 was 0.99. Geographical patterns of net import/export of livers (Figure 5A) were also largely unchanged.
Figure 5. DSA-level changes associated with Share-35.
(A) Net import or export for each DSA, pre-Share35 (left) and post-Share35 (right); green indicates net import (more imports than exports), and brown indicates net export; a darker shade indicates greater magnitude. Hash marks indicate DSAs with no transplant centers performing liver transplantation. Region 8 (Wyoming, Colorado, Nebraska, Kansas, Iowa, and Missouri) and Region 9 (New York) had some regional sharing prior to the implementation of Share-35. Net import and export were largely unchanged with the implementation of Share-35.
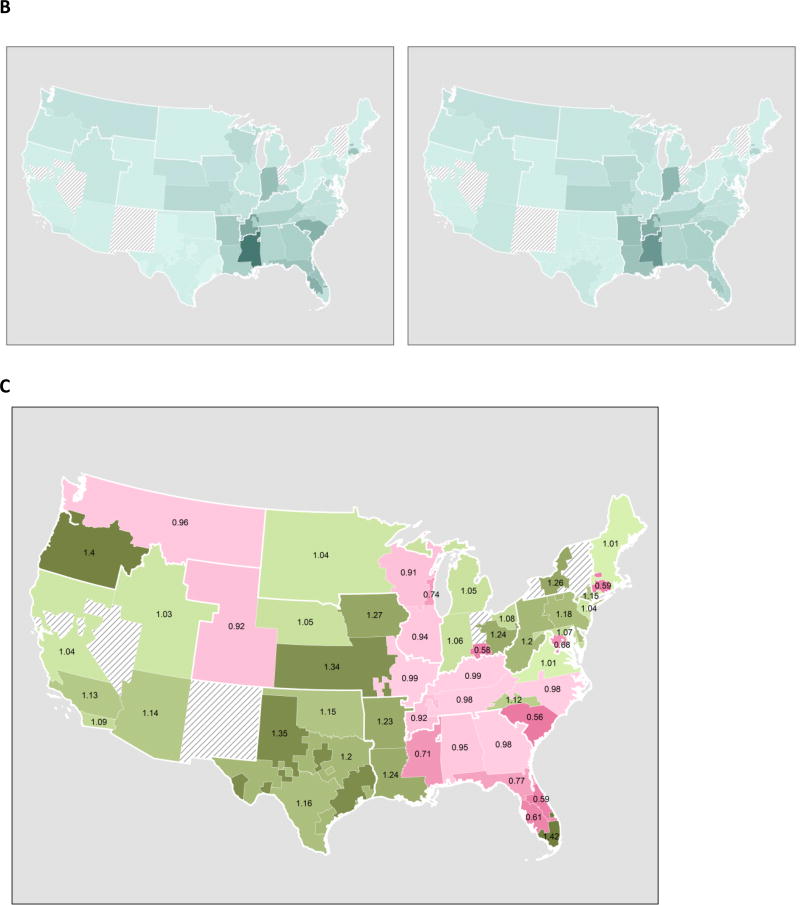
(B) Transplant rate per DSA, pre-Share35 (left) and post-Share35 (right); a darker shade indicates higher rate of transplant. Rates increased in (C) Ratio of transplant rate pre-Share35 and post-Share35 for each DSA; green indicates a higher MELD-adjusted transplant rate post-Share35, and berry indicates a lower transplant rate post-Share35.
DSA-level effects: Transplant rates
DSA-level transplant rates per person-year post-Share35 were similar to pre-Share35 rates (Figure 5B). However, the greatest declines in transplant rates were observed in DSAs with the highest pre-Share35 transplant rates, and the greatest increases in transplant rates were observed in DSAs with the lowest pre-Share35 transplant rates (Figure 5C).
Waitlist mortality
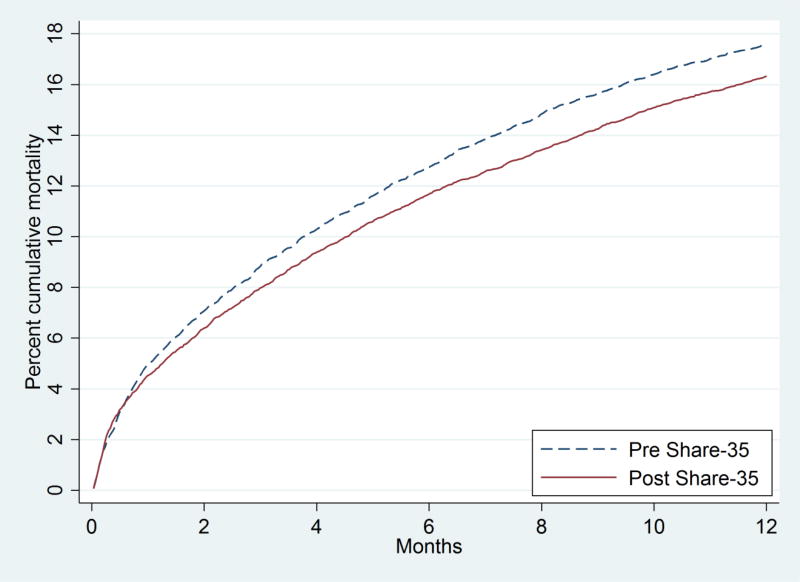
Overall there were 2804 deaths in the pre-Share35 period and 2700 deaths in the post-Share35 period. There was no change in the distribution of MELD at death associated with Share-35 (p=0.6). Crude mortality incidence was 0.201 deaths per person-year pre-Share35 and 0.194 deaths per person-year post-Share35. Accounting for the competing risk of transplantation, cumulative incidence of mortality 6 months after listing was 12.7% pre-Share35 and 11.7% post-Share35; cumulative incidence of mortality 12 months after listing was 17.6% pre-Share35 and 16.3% post-Share35 (Figure 6).
Figure 6. Early Waitlist mortality, before and after implementation of Share 35.
The survival curves account for the competing risk of transplantation. Removal from waitlist for deteriorating condition is treated as death. Adjusting for MELD at the start of each period, accounting for the competing risk of transplantation, cumulative incidence of mortality decreased by ten percent (SHR = 0.87 0.92 0.97, p=0.03). Overall there were 2804 deaths in the pre-Share35 period and 2700 deaths in the post-Share35 period.
Accounting for the competing risk of transplantation, and adjusting for AMELD at baseline, Share35 was associated with 8% overall lower waitlist mortality (subhazard ratio (SHR) 0.87 0.92 0.97, p=0.03). In analyses which were stratified by baseline AMELD, there was no evidence of a change in waitlist mortality for patients with baseline AMELD 6–20 (SHR 0.90 0.97 1.03, p=0.3) or with baseline AMELD 21–30 (SHR 0.88 0.99 1.12, p=0.9). However, among patients with baseline AMELD above 30, waitlist mortality decreased by 30% (SHR 0.59 0.70 0.83, p<0.001).
Early post-transplant outcomes
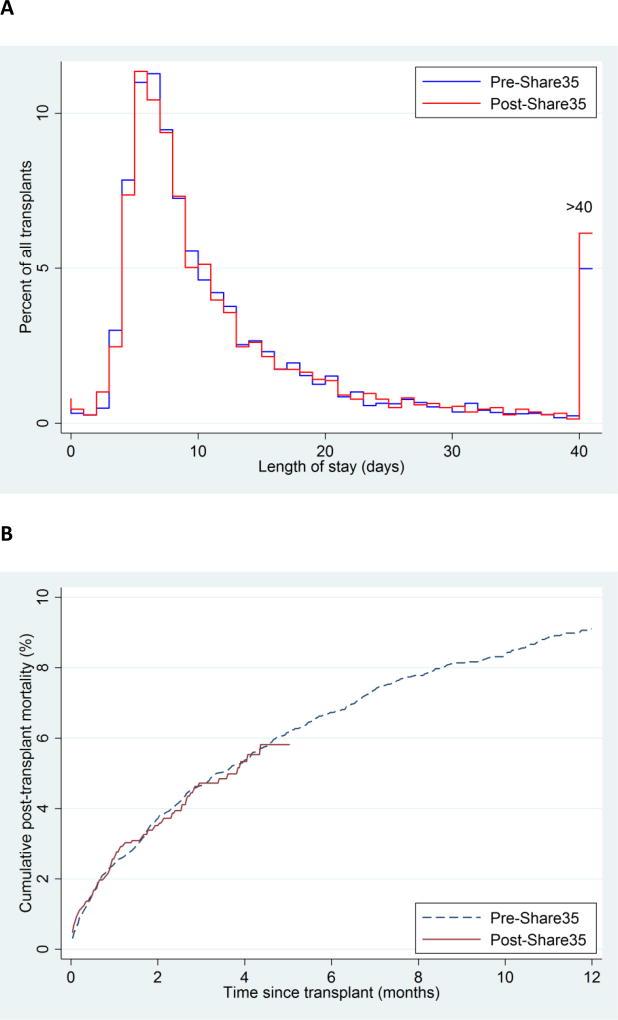
Median LOS after transplant was similar pre-Share35 (9, IQR 7–16) and post-Share35 (9, IQR 7–16) (p=0.2) (Figure 7A). There was no evidence in Share-35-associated change in rates of 7-day retransplantation (pre-Share35=32/5557 (0.6%), post-Share35=25/5878 (0.4%), p=0.3) or early post-transplant mortality (p=0.9) (Figure 7B). Pre-Share35, the crude post-transplant mortality rate in deaths per 100 person-years was 29.4 in the first month, 13.9 in months 2–3, and 9.7 in months 4–5. Post-Share35, the crude post-transplant mortality rate was 32.1 in the first month, 13.2 in months 2–3, and 7.3 in months 4–5.
Figure 7. Early post-transplant length-of-stay and mortality, before and after implementation of Share 35.
(A) Distribution of post-transplant length-of-stay (LOS) pre-Share35 and post-Share35. Median LOS after transplant was similar pre-Share35 (9, IQR 7–16) and post-Share35 (9, IQR 7–16) (p=0.2) (B) Cumulative post-transplant mortality pre-Share35 and post-Share35. There was no evidence of change in post-transplant mortality (p=0.9).
Overall mortality
The crude overall mortality rate among patients with end-stage liver disease, irrespective of transplant status, was 17.1 deaths per 100 person-years pre-Share35 and 15.4 deaths per 100 person-years post-Share35. Adjusting for baseline MELD, the mortality rate was 6% lower post-Share35 than pre-Share35; however, the difference was not statistically significant (adjusted incidence rate ratio 0.87 0.94 1.01, p=0.09).
Sensitivity analyses
Inferences regarding the decrease in discards, increase in regional share, unchanged CIT, increased AMELD at transplant, and decreased waitlist mortality were no different in sensitivity analyses of shorter pre-Share35 and post-Share35 time periods. Additionally, inferences regarding waitlist mortality were unchanged when we excluded Region 9 (which had full regional sharing prior to the implementation of Share-35) and Region 8 (which had regional sharing for MELD≥29 prior to the implementation of Share-35) (15).
DISCUSSION
In this national study of Share35 and its effect on DDLT waitlist registrants and recipients, we found a decrease in discard rate, an increase in regional exports, and broader sharing of imports and exports, with no evidence of a corresponding change in listing practices or CIT. As expected, transplant rates increased for patients with AMELD≥35, with a corresponding decrease in waitlist mortality by 30% for the sickest patients and by 8% overall, but no change in median LOS or early post-transplant mortality.
A change in allocation policy is always made in the face of uncertainty, and may lead to unintended consequences. The advent of the MELD era of transplantation was associated with a 10.2% increase in transplant rates and 3.5% decrease in waitlist mortality (16). However, the change was also associated with redirection of the highest-risk donor organs from the sickest patients in the pre-MELD era to less urgent patients in the post-MELD era (17). The granting of exception points to patients with HCC has historically advantaged these patients over other patients (4, 18), even in the face of reductions to MELD exception points for HCC (19). In the first 12 months of Share-35, the policy change seems to have accomplished broader sharing of imports and exports, without changes in listing practices, and with increases or minor decreases in transplant rates in most DSAs.
Our results should be understood in the context of unavoidable limitations of our study design. Most importantly, as with any study comparing two different time periods, our study is vulnerable to secular trends; we cannot be sure that the changes we observed were actually a result of Share-35. However, sensitivity analyses run on shorter pre-Share35 and post-Share35 time periods showed similar results, boosting confidence in our findings. Also, we are not aware of anything else in liver transplantation that would cause the simultaneous decrease in discard rates, changes in distribution of AMELD at transplant, broader sharing of imports and exports, and decrease in waitlist mortality rates that we observed. Furthermore, even if the effects we observed were caused by the Share-35 policy change, there is no guarantee that these trends will continue in the future. The composition of both the deceased donor organ pool and the liver waitlist are constantly changing. However, even if the effects of Share-35 are for some reason limited to our study period, the decreased in waitlist mortality represents success. Post-transplant outcomes are based on up to five months of followup time, to avoid ascertainment bias. It is too early to observe whether, or how, long-term post-transplant mortality may change following Share-35. However, the absence of increases in LOS, 7-day retransplant rate, or post-transplant mortality in the first few months of Share-35 is encouraging.
A clinical trial showing 30% decrease in mortality for the sickest patients associated with a new drug would be considered a breakthrough in the treatment of end-stage liver disease. In contrast to a clinical trial, our observational study offers less certainty that the intervention caused the observed outcome, due to unavoidable limitations of observational studies. Nevertheless, results from the first year of Share-35 are encouraging. The transplant community should continue developing novel strategies to make best use of valuable donor organs.
Acknowledgments
We would like to thank Dr. Kim Olthoff, Chair of the OPTN Liver and Intestinal Organ Transplantation Committee when Share-35 was implemented, for her advice and assistance with this study. Dr. Segev is supported by grant number K24DK101828 from the National Institute of Diabetes and Digestive and Kidney Diseases (NIDDK). This work was conducted under the support of the Minneapolis Medical Research Foundation, contractor for the Scientific Registry of Transplant Recipients, as a deliverable under contract no. HHSH250201000018C (US Department of Health and Human Services, Health Resources and Services Administration, Healthcare Systems Bureau, Division of Transplantation). As a US Government-sponsored work, there are no restrictions on its use. The views expressed herein are those of the authors and not necessarily those of the US Government.
Dr. David Mulligan was involved in implementation of Share-35; he did not participate in data analysis.
Abbreviations
- MELD
Model of End-stage Liver Disease
- DDLT
deceased donor liver transplants
- UNOS
the United Network for Organ Sharing (UNOS)
- OPO
organ procurement organization (OPO)
- CIT
cold ischemia time (CIT)
- SRTR
Scientific Registry of Transplant Recipients (SRTR)
- OPTN
Organ Procurement and Transplantation Network (OPTN)
- HRSA
Health Resources and Services Administration (HRSA)
- AMELD
allocation MELD
Footnotes
DISCLOSURE
The authors of this manuscript have no conflicts of interest to disclose as described by the American Journal of Transplantation.
References
- 1.Washburn K, Pomfret E, Roberts J. Liver allocation and distribution: possible next steps. Liver transplantation : official publication of the American Association for the Study of Liver Diseases and the International Liver Transplantation Society. 2011;17(9):1005–1012. doi: 10.1002/lt.22349. [DOI] [PubMed] [Google Scholar]
- 2.Wedd JP, Harper AM, Biggins SW. MELD score, allocation, and distribution in the United States. Clinical Liver Disease. 2013;2(4):148–151. doi: 10.1002/cld.233. [DOI] [PMC free article] [PubMed] [Google Scholar]
- 3.Leppke S, Leighton T, Zaun D, Chen SC, Skeans M, Israni AK, et al. Scientific Registry of Transplant Recipients: collecting, analyzing, and reporting data on transplantation in the United States. Transplant Rev (Orlando) 2013;27(2):50–56. doi: 10.1016/j.trre.2013.01.002. [DOI] [PubMed] [Google Scholar]
- 4.Massie AB, Caffo B, Gentry SE, Hall EC, Axelrod DA, Lentine KL, et al. MELD Exceptions and Rates of Waiting List Outcomes. American journal of transplantation : official journal of the American Society of Transplantation and the American Society of Transplant Surgeons. 2011;11(11):2362–2371. doi: 10.1111/j.1600-6143.2011.03735.x. [DOI] [PMC free article] [PubMed] [Google Scholar]
- 5.Feng S, Goodrich NP, Bragg-Gresham JL, Dykstra DM, Punch JD, DebRoy MA, et al. Characteristics associated with liver graft failure: the concept of a donor risk index. American journal of transplantation : official journal of the American Society of Transplantation and the American Society of Transplant Surgeons. 2006;6(4):783–790. doi: 10.1111/j.1600-6143.2006.01242.x. [DOI] [PubMed] [Google Scholar]
- 6.Gentry SE, Chow EK, Wickliffe CE, Massie AB, Leighton T, Segev DL. Impact of Broader Sharing on Transport Time for Deceased Donor Livers. Liver Transpl. 2014 doi: 10.1002/lt.23942. [DOI] [PMC free article] [PubMed] [Google Scholar]
- 7.Massie AB, Zeger SL, Montgomery RA, Segev DL. The effects of DonorNet 2007 on kidney distribution equity and efficiency. Am J Transplant. 2009;9(7):1550–1557. doi: 10.1111/j.1600-6143.2009.02670.x. [DOI] [PubMed] [Google Scholar]
- 8.Massie AB, Gentry SE, Montgomery RA, Bingaman AA, Segev DL. Center-level utilization of kidney paired donation. American journal of transplantation : official journal of the American Society of Transplantation and the American Society of Transplant Surgeons. 2013;13(5):1317–1322. doi: 10.1111/ajt.12189. [DOI] [PMC free article] [PubMed] [Google Scholar]
- 9.Putter H, Fiocco M, Geskus RB. Tutorial in biostatistics: competing risks and multi-state models. Statistics in medicine. 2007;26(11):2389–2430. doi: 10.1002/sim.2712. [DOI] [PubMed] [Google Scholar]
- 10.Coviello V, Boggess M. Cumulative incidence estimation in the presence of competing risks. Stata Journal. 2004;4(2):103–112. [Google Scholar]
- 11.Fine JP, Gray RJ. A proportional hazards model for the subdistribution of a competing risk. Journal of the American Statistical Association. 1999:496–509. [Google Scholar]
- 12.Kucirka LM, Grams ME, Lessler J, Hall EC, James N, Massie AB, et al. Association of race and age with survival among patients undergoing dialysis. JAMA. 2011;306(6):620–626. doi: 10.1001/jama.2011.1127. [DOI] [PMC free article] [PubMed] [Google Scholar]
- 13.Rothman KJ, Greenland S, Lash TL. Modern epidemiology. Lippincott Williams & Wilkins; 2008. [Google Scholar]
- 14.Louis TA, Zeger SL. Effective communication of standard errors and confidence intervals. Biostatistics. 2009;10(1):1–2. doi: 10.1093/biostatistics/kxn014. [DOI] [PMC free article] [PubMed] [Google Scholar]
- 15.Bittermann T, Makar G, Goldberg D. Exception point applications for 15 points: an unintended consequence of the share 15 policy. Liver Transpl. 2012;18(11):1302–1309. doi: 10.1002/lt.23537. [DOI] [PMC free article] [PubMed] [Google Scholar]
- 16.Freeman RB, Wiesner RH, Edwards E, Harper A, Merion R, Wolfe R, et al. Results of the first year of the new liver allocation plan. Liver Transpl. 2004;10(1):7–15. doi: 10.1002/lt.20024. [DOI] [PubMed] [Google Scholar]
- 17.Volk ML, Lok AS, Pelletier SJ, Ubel PA, Hayward RA. Impact of the model for end-stage liver disease allocation policy on the use of high-risk organs for liver transplantation. Gastroenterology. 2008;135(5):1568–1574. doi: 10.1053/j.gastro.2008.08.003. [DOI] [PubMed] [Google Scholar]
- 18.Washburn K, Edwards E, Harper A, Freeman R. Hepatocellular carcinoma patients are advantaged in the current liver transplant allocation system. Am J Transplant. 2010;10(7):1643–1648. doi: 10.1111/j.1600-6143.2010.03127.x. [DOI] [PubMed] [Google Scholar]
- 19.Freeman RB, Jr, Gish RG, Harper A, Davis GL, Vierling J, Lieblein L, et al. Model for end-stage liver disease (MELD) exception guidelines: results and recommendations from the MELD Exception Study Group and Conference (MESSAGE) for the approval of patients who need liver transplantation with diseases not considered by the standard MELD formula. Liver transplantation : official publication of the American Association for the Study of Liver Diseases and the International Liver Transplantation Society. 2006;12(12 Suppl 3):S128–136. doi: 10.1002/lt.20979. [DOI] [PubMed] [Google Scholar]


