 Emodin is a natural anthraquinone derivative that occurs in many Chinese medicinal herbs.
Abstract
Emodin is a natural anthraquinone derivative that occurs in many Chinese medicinal herbs. It might induce liver damage, but the mechanism is not clear. In this research, seven groups of Sprague-Dawley (SD) rats with three doses of emodin were used. The liver injury was examined by analyzing biochemical indexes and histopathology. Altered proteins between the control group (CG) and the liver injury group were determined by proteomic technology. The results showed that emodin causes liver injury in a time- and dose-dependent manner. In the high-dosage 1-week group (HG1), glyceraldehyde-3-phosphate dehydrogenase (GAPDH) was downregulated, and the activity of malate dehydrogenase (MDH) was inhibited by emodin. These might cause the inhibition of FADH or NADH/NADPH transport from the cytoplasm to mitochondria. The WB results showed that the inhibition of FADH/NADPH transport induced a high activity of caspase-9 and caspase-3, and the expressions of cytochrome c (Cyt C), caspase-9 and caspase-3 were high in HG1, which might lead to mitochondrial apoptosis pathway activation. In addition, whatever the HG1 or low-dose group (LG), the effects of emodin on mitochondria were observed. Overall, for the first time, we showed that emodin inhibited proton transport and induced the activation of the mitochondrial apoptosis pathway, which might be the reason for liver injury.
Introduction
Evaluating the safety of traditional medicinal herbs and their major active constituents is critical for the widespread usage of these herbs. Rhubarb (Rheum palmatum) is one of the oldest and best-known traditional Chinese medicines, which was first recorded in the Chinese Classical Materia Medica.1 Emodin (3-methyl-1,6,8-trihydroxyanthraquninone) is one of the main anthraquinones found in the root and rhizome of Rhubarb, which is commonly used as a traditional medicinal herb for the treatment of liver and kidney diseases in many Asian countries.2,3 Although emodin at low doses improves hepatic fibrosis,4 some studies have reported contradictory findings showing that emodin at high doses is hepatotoxic to normal rats.5 Emodin (30 μM) leads to apoptosis in a time-dependent manner, as determined by morphological changes in L-02 cells.6 Emodin can also directly inhibit the activity of a number of enzymes or act synergistically with other agents to decrease the activity of CK2, PKC, and PI3K.7,8 The US National Toxicology Program showed that emodin exposure resulted in increased incidences of nephropathy and hepatotoxicity in mice.9 Some researchers found that emodin possesses genotoxic and DNA-damaging properties by stabilizing TopoII-DNA cleavage complexes and inhibiting ATP hydrolysis.10 However, the mechanism of emodin-induced liver injuries remains to be elucidated, and the risk factors of hepatotoxicity are not well defined. Studies investigating the effects of the hepatotoxicity of emodin are necessary.
Proteins play an important role in a variety of cellular functions, but oxidative damage reduces the function of critical proteins.11 Traditional physiological and biochemical methods cannot determine the molecular mechanisms underlying this phenomenon. Proteomics approaches are being increasingly applied in different areas on the premise that the identification of specific changes in protein expression in response to a particular challenge can elucidate the underlying molecular pathways.12–14 Recently, mass spectrometry-based proteomics has been widely used to determine the modes of action and mechanisms involved in drug- or chemical-induced toxicity.15–22 Candidate biomarkers for the earlier detection of geniposide-induced hepatotoxicity were identified using a label-free quantitative proteomics approach on a geniposide overdose-induced liver injury in a rat model.23 In order to understand the antioxidant mechanism induced by dietary emodin in Megalobrama amblycephala liver, a comparative proteomic analysis was performed to investigate the proteome alteration under emodin administration;24 a proteomic study using 2-D DIGE revealed that aloe-emodin affected multiple proteins associated with oxidative stress, cell cycle arrest, antimetastasis, and hepatitis C virus replication.25
Due to the superior comprehensiveness of proteomics and its powerful quantitative approach, the new field of toxic proteomics offers a unique opportunity to probe the mechanism of hepatotoxicity at an early stage.26–31 In this work, we applied a label-free quantitative proteomics approach to emodin-induced liver injury in a rat model to investigate the mechanism of emodin-induced hepatotoxicity.
Materials and methods
Chemicals and reagents
Emodin, with over 98% purity (by HPLC), was obtained from Zelong Biochemical Science and Technology Co., Ltd (Nanjing, China). The cell and tissue lysis buffer was obtained from Beyotime (Shanghai, China). The cocktail protease inhibitor was obtained from Roche (Mannheim, Germany). Formic acid (FA) was purchased from Acros (Morris plains, NJ, USA). HPLC-grade acetonitrile (ACN) and methanol were obtained from Thermo Fisher Scientific (MA, USA). N′,N′-Bis-methyleneacrylamide, sodium dodecyl sulfate (SDS), ethylene diaminetetraacetic acid (EDTA), tris(hydroxymethyl) aminomethane, and TEMED were obtained from Sigma-Aldrich Co. (Beijing, China). All the other chemicals were analytical grade. The deionized water (R > 18.2 MΩ) used for all the experiments was purified by using a Millipore purification system (MA, USA).
Animal study
Forty-eight male Sprague-Dawley (SD) rats (Vital River Laboratories, Beijing, China), 9 weeks of age, were administered a high-dose of emodin (1500 mg kg–1 daily, 100 times the clinical equivalent of rhubarb), a medium-dose of emodin (500 mg kg–1 daily, 33 times the clinical equivalent of rhubarb), a low-dose of emodin (150 mg kg–1 daily, 10 times the clinical equivalent of rhubarb) or saline (control) for four consecutive weeks. Every dose was divided into four groups: the control group (CG), the low-dosage group (LG), the medium-dosage group (MG), and the high-dosage group (HG). In addition, in order to track liver injury caused by a high dose of emodin, the high-dose group was further divided into four groups: the high-dose 1-week group (HG1), the high-dose 2-week group (HG2), the high-dose 3-week group (HG3), and the high-dose 4-week group (HG4), and each HG was administered for one week, two weeks, three weeks and four weeks, separately. And then all the rats were sacrificed, and the plasma samples were collected and frozen at –80 °C for the analysis. The liver tissues were harvested after washing out the blood by perfusion with saline and frozen at –80 °C. Alanine transaminase (ALT) and aspartate transaminase (AST) levels in the plasma were determined by an enzymatic assay (TBA-40FR, Toshiba, Japan). All the animal experiments were approved by the Committee on Animal Care and Use of Institute of Chinese Materia Medica, China Academy of Chinese Medical Sciences. And the study complied with all institutional and national guidelines, as per the Chinese Association for Laboratory Animal Sciences: Ethical Conduct for Research Involving Animals (CALAS 2017), the protocol was approved by Animal Ethical and Welfare Committee of CACMS.
Histopathology
The liver samples were stained with hematoxylin and eosin (H&E). After fixation, the livers were embedded in paraffin and sectioned at 5 μm intervals. The tissue sections were dehydrated in serial ethanol and repeatedly washed with decreasing concentrations of ethanol prior to eosin staining. The samples were mounted, and their morphologies were examined by pathologists and imaged via microscopy (DMI6000 B microscope, Leica, Wetzlar, Germany).
Residues of emodin in the liver
For the residues of emodin in the liver analysis, the rat livers were homogenized in the cell and tissue lysis buffer containing a cocktail protease inhibitor (Sceintz-48, Sceintz, Ningbo, China). Then, the mixtures were centrifuged at 10 000g, 4 °C for 15 min to separate the insoluble material. Methanol was mixed with the centrifugal supernatant and centrifuged at 10 000g, 4 °C for 15 min in order to wipe off proteins that were dissolved in the centrifugal supernatant. The retentates were concentrated until the volume was less than 1 mL. And then these samples were separated by a 13 min gradient elution at a flow rate of 1 mL min–1 with an Agilent1260 HPLC system. The analytical column was an Agilent Poroshell 120 EC-C18 (50 mm × 4.6 mm, 5 μm). Mobile phase A consisted of methanol, and mobile phase B consisted of water with 0.1% formic acid. The elution gradient was 0–1.5 min 10% A and 90% B, 1.5–1.6 min 30% A and 70% B, 1.6–4 min 70% A and 30% B, 4–8 min 80% A and 20% B, and 8–13 min 95% A and 5% B.
Protein preparation and proteomics analysis
The rat livers were homogenized in the cell and tissue lysis buffer containing the cocktail protease inhibitor (Sceintz-48, Ningbo, China). The mixtures were centrifuged at 8000g, 4 °C for 15 min to separate the insoluble material. Cold acetone (4 °C) was mixed with the supernatant and centrifuged at 10 000g, 4 °C for 20 min in order to precipitate the protein and the supernatant was discarded. Then, 8 M urea was added into the sediment to dissolve the sediment. Equal amounts of the proteins from the different group samples (approximately 30 μg) were separated by SDS-PAGE. The gel bands of interest were excised from the gel, reduced with 25 mM dithiotreitol, and alkylated with 55 mM iodoacetamide. In-gel digestion was then carried out with sequencing-grade modified trypsin in 50 mM ammonium bicarbonate at 37 °C overnight. The peptides were extracted twice with 0.1% trifluoroacetic acid in a 50% acetonitrile aqueous solution for 30 min. The extracts were then centrifuged in a speed vac to reduce the volume. The tryptic peptides were redissolved in 20 μL of 0.1% FA (formic acid). Equal amounts of proteins from the rat livers were combined and analyzed by LC-MS/MS.
For the LC-MS/MS analysis, the peptides were separated by a 60 min gradient elution at a flow rate of 0.250 μL min–1 with a Thermo-Dionex Ultimate 3000 HPLC system, which was directly interfaced with a Thermo LTQ-Orbitrap Velospro mass spectrometer. The analytical column was a homemade fused silica capillary column (75 μm ID, 150 mm length; Upchurch, Oak Harbor, WA) packed with C-18 resin (300 A, 5 μm; Varian, Lexington, MA). Mobile phase A consisted of 0.1% formic acid, and mobile phase B consisted of 100% acetonitrile and 0.1% formic acid. An LTQ-Orbitrap mass spectrometer was operated in the data-dependent acquisition mode using Xcalibur 2.0.7 software, and there is a single full-scan mass spectrum in the Orbitrap (400–1800m/z, 30 000 resolution) followed by 20 data-dependent MS/MS scans in an ion trap at 35% normalized collision energy (CID).
The MS/MS spectra from each LC-MS/MS run were searched against the Rattus norvegicus database using the Proteome Discoverer (Version 1.4) searching algorithm. The search criteria were as follows: full tryptic specificity was required; two missed cleavages were allowed; carbamidomethylation was set as fixed modification; oxidation (M) was set as variable modification; the precursor ion mass tolerance was 10 ppm for all the MS acquired in the Orbitrap mass analyzer; and the fragment ion mass tolerance was 0.8 Da for all the MS2 spectra acquired in the LTQ. A high confidence score filter (FDR < 1%) was used to select the “hit” peptides, and their corresponding MS/MS spectra were manually inspected.
Western blotting
The rat livers were homogenized in the cell and tissue lysis buffer containing the cocktail protease inhibitor (Sceintz-48, Ningbo, China). The mixture was centrifuged at 8000g, 4 °C for 15 min to separate the insoluble material. Equal amounts of the proteins were separated on a 12% SDS-PAGE gel, and the proteins were transferred to a PVDF transfer membrane. The western blot analysis followed a standard procedure. Heat shock protein 70 (HSP 70) antibodies were obtained from Abcom (Cambridge, UK), and GADPH and β-actin were obtained from Bioss (Beijing, China). The HRP-labeled goat anti-mouse IgG antibody was obtained from Beyotime (Shanghai, China).
Detection of caspase-3 and caspase-9 activities
The activities of caspase-3 and caspase-9 were detected by caspase-3 and caspase-9 activity assay kits (Beyotime institute of biotechnology, Shanghai, China), operated according to the manufacturer's instructions. The absorption values were recorded at 405 nm by using a microplate reader (Infinite 200 PRO Nano Quant, Tecan, Swiss).
Detection of the activities of succinate dehydrogenase (SDH) and MDH
The liver samples were homogenized in the cell and tissue lysis buffer containing the cocktail protease inhibitor (Sceintz-48, Ningbo, China). The mixtures were centrifuged at 8000g, 4 °C for 15 min to separate the insoluble material and stored at –80 °C for later use. Equal amounts of the samples were used to detect the activities of SDH and MDH using an enzymatic determination kit (Nanjing Jiancheng).
Statistical analysis
The statistical analysis was carried out with GraphPad Prism 6.0 software using two-sided unpaired t-tests. P values of <0.05 were considered significant.
Results and discussion
Emodin-induced liver injury in a rat model
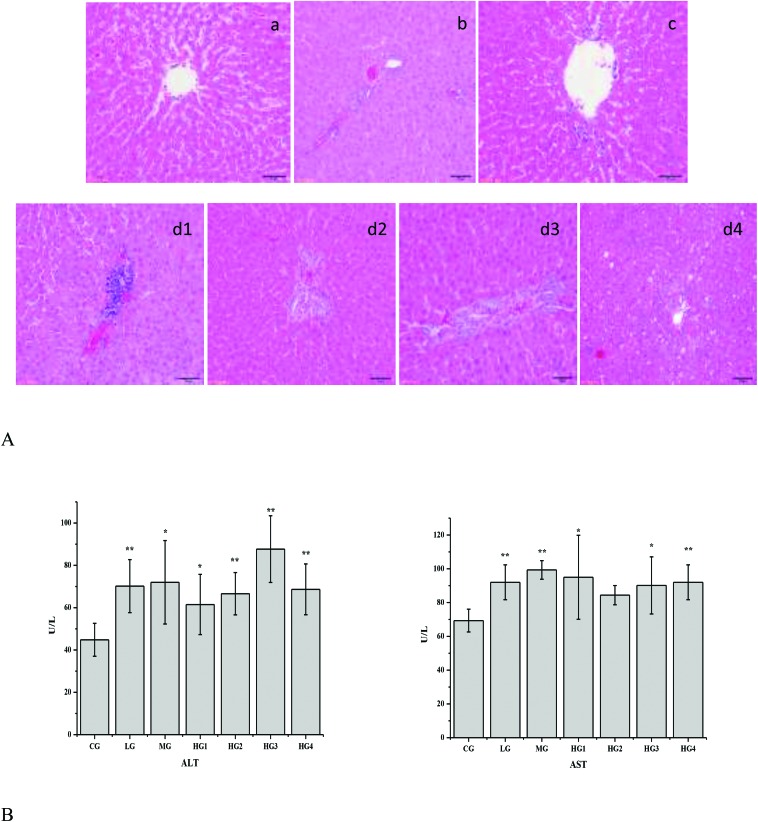
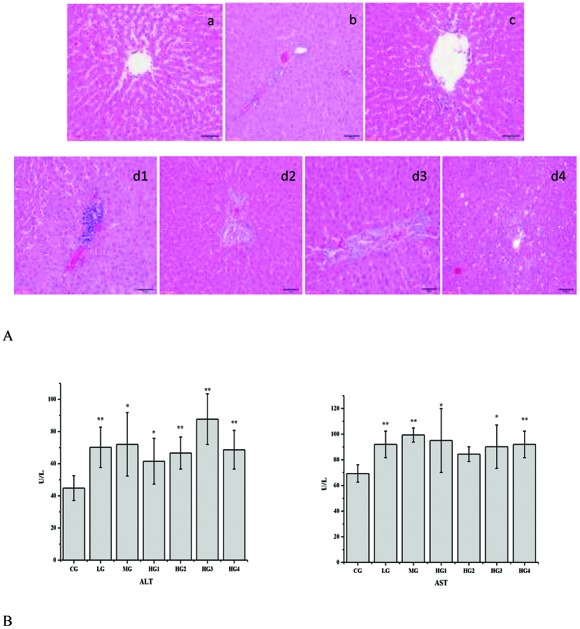
Various in vitro activities of emodin, such as antioxidation,32,33 anti-inflammatory,34,35 anti-angiogenesis36,37 and apoptosis inducing,38–42 have been reported, but the effects of emodin remained an unanswered question for the lack of understanding of the metabolism and pharmacokinetics of emodin in vivo. To understand whether emodin is safe, a series of experiments were designed. To study the change in liver-specific proteins in the liver, rats were orally administered with different doses of emodin for four consecutive weeks. As shown in Fig. 1A, the histological staining of the liver tissue sections revealed that as the dose of emodin increased, the liver tissue damage increased gradually, and it occurred in a time- and dose-dependent manner. There was slight inflammation in the LG (Fig. 1A and b), and compared with the LG, the inflammation in the MG was more serious (Fig. 1A and c). There was liver damage in the HG (Fig. 1A, d1, d2, d3, and d4), and as the time went on from one week to four weeks, the liver damage became serious gradually, from inflammation to fat vacuoles, except for HG2. The blood ALT and AST levels showed the same changes (Fig. 1B). These results suggested that emodin has the possibility to induce liver injury in rats.
Fig. 1. Metabolic changes of different doses of emodin in the rat liver. A, Histological confirmation of the liver. Sections of the liver tissues were stained with hematoxylin–eosin and were examined by pathologists. a, control group; b, low dose group; c, middle dose group; d1, high dose in 1-week group; d2, high dose in 2-week group; d3, high dose in 3-week group; d4, high dose in 4-week group. B, Blood ALT and AST levels. The results are plotted as the mean ± standard error (n = 3). Comparisons with the CG, LG, MG, HG1, HG2, HG3 and HG4 were performed, and the results were analyzed by a one-way analysis of variance. * for P value <0.05, **for P value <0.01.
Residues of emodin in the liver
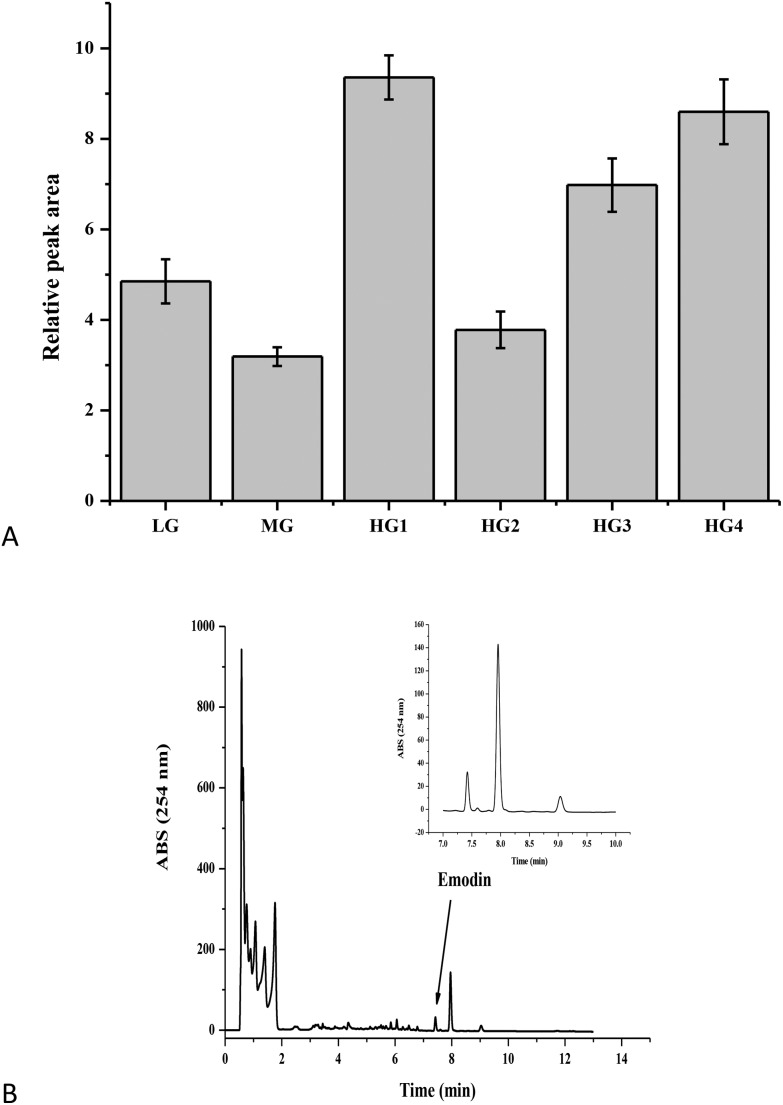
To understand whether emodin could induce liver injury, the residues of emodin in the liver were detected by HPLC. The result showed that after 24 h of fasting, there was still emodin in livers (Fig. 2A), especially in the HG. In the HG1, there was 2.52 ± 0.32 μg g–1 tissue of emodin in the rat livers (Fig. 2B), and the residues of emodin also had a dose-dependent relationship. These findings suggested that emodin in the liver requires a longer time to be eliminated, and emodin has potential hepatotoxicity. Moreover, in the HG2, there was a certain degree of recovery of the liver damage caused by the body stress response, which might be caused by the protein changes in the HG1. Therefore, this paper focused on the variation in the protein levels of the high dose oral administered emodin in one week to elucidate the mechanism of liver injury induced by emodin.
Fig. 2. The emodin residues in the rat liver by HPLC. A. The emodin residues in the rat liver in the LG, MG, HG1, HG2, HG3 and HG4. B. The emodin residues in the rat liver of the HG1 by HPLC.
Identification of the differentially expressed proteins between the control and emodin rat livers
To investigate the mechanism of liver injury caused by emodin at the protein level, a proteomic analysis was carried out on the CG and the HG1. Equal amounts of the proteins from the CG and the HG1 were loaded and separated by SDS-PAGE. The differentially expressed proteins were identified and quantified using label-free methods. The experiments were repeated three times, and 1900 proteins were identified for each sample. Based on the t-test, 97 proteins were differentially expressed between the CG and the HG1, of which 70 proteins were significantly upregulated (p value <0.05) and 27 proteins were significantly downregulated (p value <0.05) (Tables S1 and S2†).
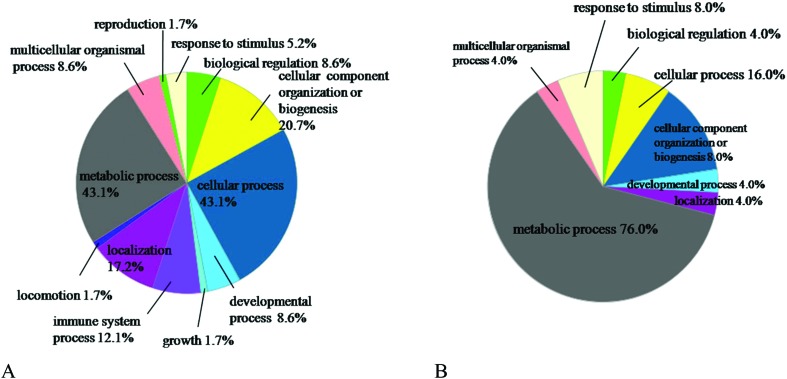
To understand the biological relevance of the differential proteins, Gene Ontology (GO) was used to categorize the proteins according to their molecular functions and biological processes. The annotations of the gene lists are summarized via a pie chart using the PANTHER bioinformatics platform (; http://www.pantherdb.org/) as shown in Fig. 3. Ninety-seven proteins were classified into several significant groups of biological processes, including metabolic processes, cellular processes, cellular compartment organization, and the immune system.
Fig. 3. Proteomic analysis of differentially expressed proteins in HG1. A, GO analysis of the upregulated proteins in HG1. B, GO analysis of the downregulated proteins in the HG1.
In the upregulated proteins, 7 proteins were upregulated 20 times (Table S3†), which were extremely related to emodin metabolism. In addition, among the 27 downregulated proteins, 19 proteins were associated with the metabolic process, which was the dominant difference between the HG1 and the CG. We also found that 6 electron transfer proteins were downregulated in the emodin rat livers, in which 4 proteins were GAPDH related proteins (Table S4†), suggesting that the transport of FADH from the cytoplasm to mitochondria was decreased in the rat liver of the HG1. Additionally, among the upregulated proteins, 8 proteins are associated with the oxidation–reduction process (Table S5†), which suggested that the cells in rat livers were obliterating the emodin; 4 proteins were heat shock protein (HSP) family proteins (Table S6†). HSP70 proteins protect cells against oxidative damage, which is either due to necrosis or apoptosis,43 and HSP70 proteins are also potent regulators of inflammation because of their ability to prevent the activation of the NF-κB pathway.44 Therefore, we speculate that the highly expressed HSP70 proteins caused the residue of emodin to present a significant decline in the HG2.
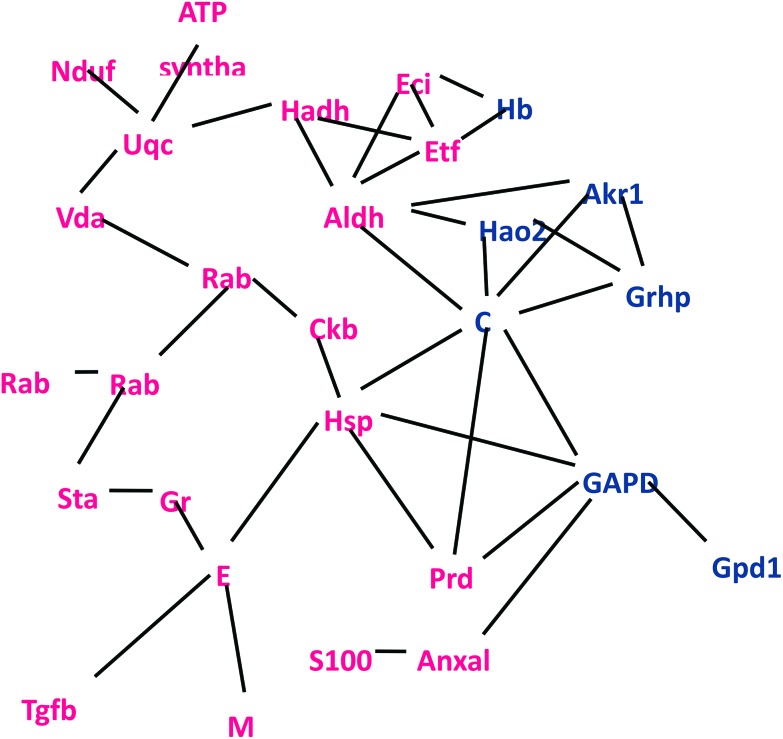
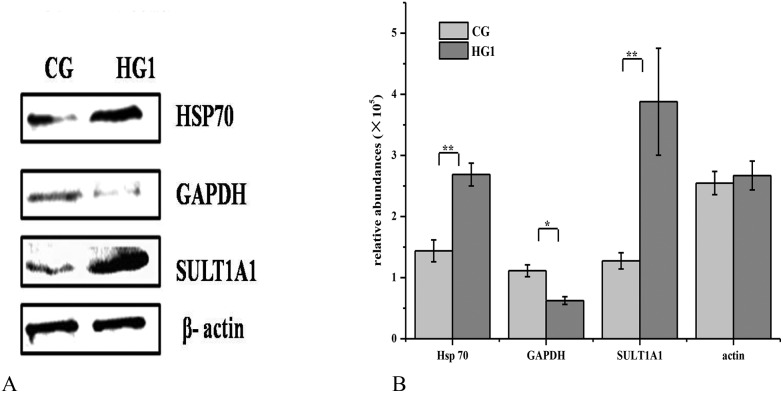
To further understand the relationship between the differentially expressed proteins, a network of these proteins was investigated by STRING (https://string-db.org/), and the results were consistent with the GO results. Most of the differentially expressed proteins were related to metabolic processes (Fig. 4). The expression of SULT 1A1 was increased 70-fold, which is one of the important enzymes involved the phase II metabolism in the liver, SULT 1A1 could make the small molecules or drugs be removed in time by increasing their water solubility,45 and it might be the important metabolic enzyme of emodin. The results were further confirmed by western blot analysis (Fig. 5).
Fig. 4. Network interaction of the altered proteins identified in the HG1. In the network, each node represents a protein; the nodes in red and blue represent the up and downregulated proteins, respectively.
Fig. 5. Confirmation of the differentially expressed proteins by western blotting. A. Differentially expressed proteins by western blotting; B. the relative abundances of the proteins. * for P value <0.05, ** for P value <0.01.
Detection of MDH and SDH activity
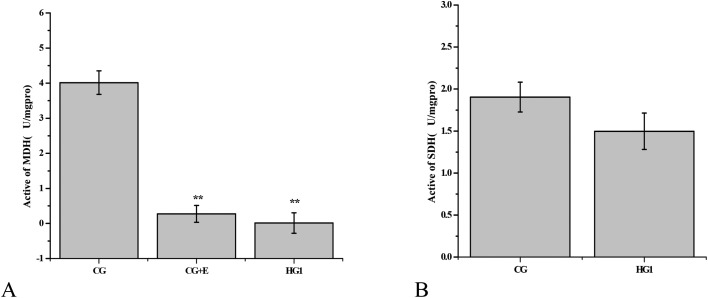
There are two shuttle mechanisms in the cell: transport of FADH or NADPH from the cytoplasm to mitochondria separately, GAPDH and MDH are the key enzymes of the two shuttle mechanism.29,30,46,47 The inhibition of these enzymes could affect the function of mitochondria. And in proteomic analysis, emodin inhibited the expression of GAPDH, to inspect whether emodin affects the shuttle of FADH/NADPH, and the malate dehydrogenase (MDH) and succinate dehydrogenase (SDH) activity in the liver tissue was detected using enzyme activity test kits.29,30 The results showed that emodin in the HG1 had a significant inhibitory effect on the activity of MDH, but there was no significant change in SDH compared with the CG (Fig. 6). To further prove that emodin had a inhibitory effect on MDH, the tissue samples of the CG were added to emodin, according to the residual amount of emodin in the HG1, and the MDH activity was detected in the CG again, which indicated that emodin inhibited the activity of MDH.
Fig. 6. Inhibitory effect of emodin on the enzyme activity of MDH. A, Comparison of the MDH activity in the liver tissue between the HG1 (h1, h2, h3) and the CG (c1, c2, c3). c13, c23 and c33 are that 3 μg g–1 tissue of emodin was added to the CG, which amounts to the amount of residual liver tissue in the emodin group of the HG1. B, Changes of the SDH activity between the HG1 (h1, h2, h3) and the CG (c1, c2, c3). ** for P value <0.01.
Emodin-induced apoptosis via the caspase family
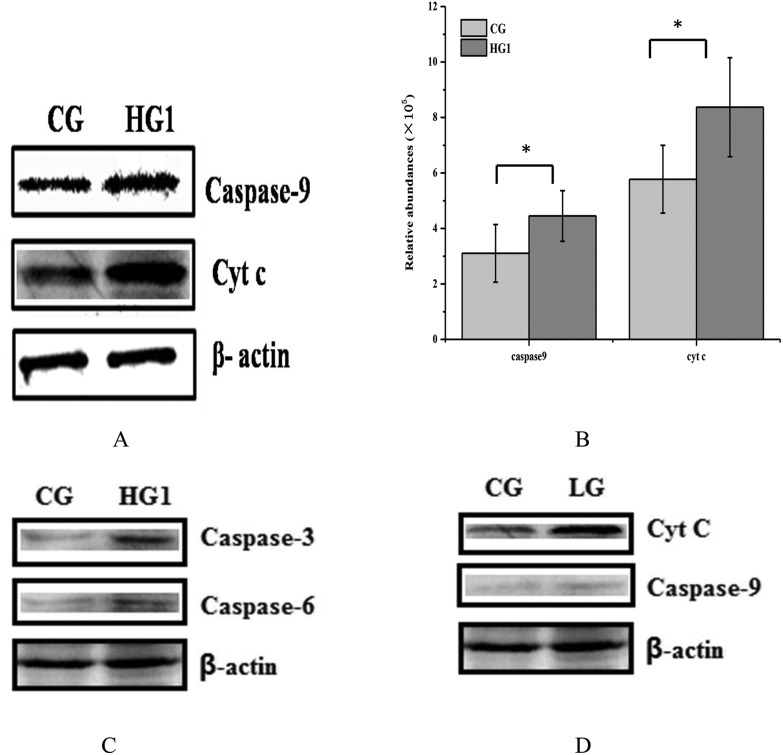
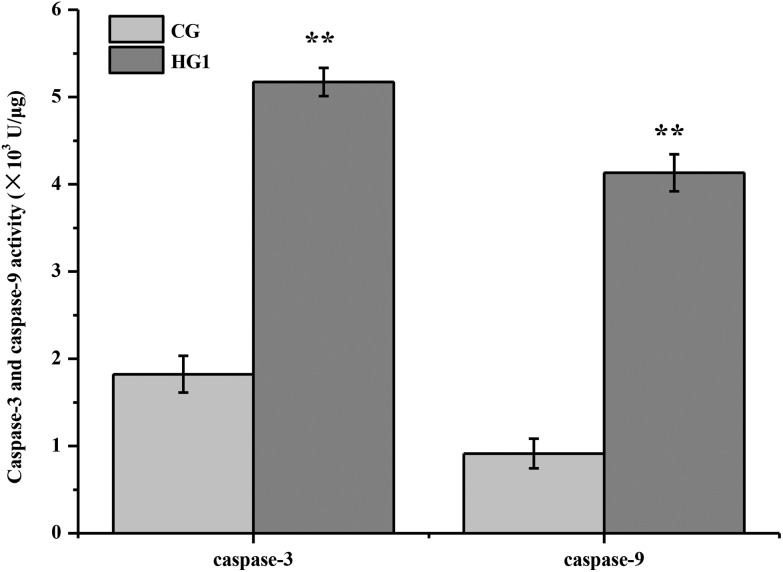
Mitochondria are important organelles in cells, which are in charge of supplying the energy to cells. Cells can convert nutrients into usable substances in the cytoplasm; one of them is FADH/NADPH, which could provide protons to mitochondria. If the enzymes of FADH/NADPH transport are inhibited, the function of mitochondria might be affected, the expression of cytochrome c (Cyt C) might be increased in mitochondria, inducing the mitochondrial apoptosis.50–53 To verify whether the inhibitory effect of emodin on FADH or NADH/NADPH transport induced apoptosis, the contents and the activities of Cyt C, caspase-9, caspase-3 and caspase-6 in the CG and HG1 were examined by WB and the enzyme activity detection kit (Fig. 7A–C and 8). The results showed that, although the caspase-6 changes between CG and HG1 were not obvious, the expression of Cyt C was increased. The expression and activities of caspase-9 and caspase-3 were both increased in the HG1, which suggested that the liver damage was caused by the mitochondrial apoptotic pathway.31,48–50
Fig. 7. Confirmation of the expression of CytC, caspase-9, caspase-3 and caspase-6 in CG, HG1 and LG by western blotting. A. The content of Cyt C and caspase-9 in the CG and HG1. B. The gray value of Cyt C and caspase-9 in the CG and HG1. C. The content of caspase-3 and caspase-6 in the CG and HG1. D. The content of Cyt C and caspase-9 in the CG and LG (the rats were administered 150 mg kg–1 d–1 of emodin for 4 weeks).* for P value <0.05.
Fig. 8. Caspase-3 and caspase-9 activity in CG and HG1. The data of treatments were calibrated with the control values, values were all expressed as means ± SD (n > 3), similar results were obtained. **P < 0.01 versus CG.
To shed light on whether emodin causes mitochondrial damage in the LG, the levels of Cyt C, caspase-9, caspase-3 and caspase-6 were also determined in the rat liver by WB, and the results showed that when it was administered for 1 week, the levels of Cyt C and caspase-3, 6, and 9 were not significantly different compared to the CG (data not shown), but in 4 weeks, the content of Cyt C had a high expression, and caspase-9 showed no difference compared with the CG (Fig. 7D). Therefore, it did not matter if it was a high or low dose, emodin showed potential hepatotoxicity.
Conclusion
In this study, we aimed to investigate the mechanism of liver injury by emodin at the protein level. The excessive emodin accumulated in the liver cells, which inhibited FADH or NADH/NADPH transport, leading to mitochondrial apoptosis pathway activation. Moreover, it did not matter if the dose was high or low, emodin also affected the function of the mitochondria, this might be the reason for liver injury induced by emodin.
Conflicts of interest
There are no conflicts of interest.
Supplementary Material
Acknowledgments
This work was supported by the National Natural Science Foundation of China (No. 81573839 and 81703948) and the National Science and Technology Major Project of China (No. 2014ZX09304307); we thank Dr Jin Li and The Center of Biomedical Analysis, Tsinghua University for the help.
Footnotes
†Electronic supplementary information (ESI) available. See DOI: 10.1039/c7tx00307b
References
- Vargas F., Diaz Y., Carbonell K. Pharm. Biol. 2004;42:342–348. [Google Scholar]
- Liang H., Wang L., Lan J. Central Plains Med. J. 2006;16:34–35. [Google Scholar]
- Wang Y., Zhang W., Wang L. J. Tradit. Chin. Med. 2010;10:010. [Google Scholar]
- Zhan Y., Li D., Wei H., Wang Z., Huang X., Lu H. Chin. Med. J. 2000;113:599–601. [PubMed] [Google Scholar]
- Yi J., Yang J., He R., Gao F., Sang H., Tang X., Richard D. Y. Cancer Res. 2004;64:108–116. doi: 10.1158/0008-5472.can-2820-2. [DOI] [PubMed] [Google Scholar]
- Li C. L., Ma J., Zheng L., Li H. J., Li P. J. Pharm. Biomed. Anal. 2012;71:71–78. doi: 10.1016/j.jpba.2012.07.031. [DOI] [PubMed] [Google Scholar]
- National toxicology Program Natl. Toxicol. Program Tech. Rep. Ser. 2001;493:1–278. [PubMed] [Google Scholar]
- Li Y., Luan Y., Qi X., Li M., Gong L., Xue X., Yao J. Toxicol. Sci. 2010;118:435–443. doi: 10.1093/toxsci/kfq282. [DOI] [PubMed] [Google Scholar]
- Shieh D. E., Chen Y. Y., Yen M. H., Chiang L. C., Lin C. C. Life Sci. 2004;74:2279–2290. doi: 10.1016/j.lfs.2003.09.060. [DOI] [PubMed] [Google Scholar]
- Huang Q., Lu G., Shen H. M., Chung M. C., Ong C. N. Med. Res. Rev. 2007;27:609–630. doi: 10.1002/med.20094. [DOI] [PubMed] [Google Scholar]
- Martin S. A. M., Cash P., Blaney S., Houlihan D. F. Fish Physiol. Biochem. 2001;24:259–270. [Google Scholar]
- Vilhelmsson O. T., Martin S. A., Médale F., Kaushik S. J., Houlihan D. F. Br. J. Nutr. 2004;92:71–80. doi: 10.1079/BJN20041176. [DOI] [PubMed] [Google Scholar]
- Brunt J., Hansen R., Jamieson D. J., Austin B. Vet. Immunol. Immunopathol. 2008;121:199–205. doi: 10.1016/j.vetimm.2007.09.010. [DOI] [PubMed] [Google Scholar]
- Sissener N. H., Martin S. A., Cash P., Hevrøy E. M., Sanden M., Hemre G. I. Mar. Biotechnol. 2010;12:273–281. doi: 10.1007/s10126-009-9214-1. [DOI] [PubMed] [Google Scholar]
- Amacher D. E., Adler R., Herath A., Townsend R. R. Clin. Chem. 2005;51:1796–1803. doi: 10.1373/clinchem.2005.049908. [DOI] [PubMed] [Google Scholar]
- Groebe K., Hayess K., Klemm-Manns M., Schwall G., Wozny W., Steemans M., Peters A. K., Sastri C., Jaeckel P., Stegmann W., Zengerling H., Schopf R., Poznanovic S., Stummann T. C., Seiler A., Spielmann H., Schrattenholz A. J. Proteome Res. 2010;9:5727–5738. doi: 10.1021/pr100514e. [DOI] [PubMed] [Google Scholar]
- Pan T. L., Wang P. W., Chen C. C., Fang J. Y., Sintupisut N. Proteomics. 2012;12:477–489. doi: 10.1002/pmic.201100055. [DOI] [PubMed] [Google Scholar]
- Cho Y. E., Kim S. H., Baek M. C. Electrophoresis. 2012;33:2806–2817. doi: 10.1002/elps.201200193. [DOI] [PubMed] [Google Scholar]
- Verma N., Pink M., Rettenmeier A. W., Schmitz-Spanke S. Proteomics. 2012;12:1731–1755. doi: 10.1002/pmic.201100466. [DOI] [PubMed] [Google Scholar]
- Lee Y. H., Goh W. W. B., Ng C. K., Raida M., Wong L., Lin Q., Boelsterli U. A., Chung M. C. J. Proteome Res. 2013;12:2933–2945. doi: 10.1021/pr400219s. [DOI] [PMC free article] [PubMed] [Google Scholar]
- Tan F., Jin Y., Liu W., Quan X., Chen J., Liang Z. Environ. Sci. Technol. 2012;46:12170–12177. doi: 10.1021/es3027715. [DOI] [PubMed] [Google Scholar]
- Verma N., Pink M., Rettenmeier A. W., Schmitz-Spanke S. B. J. Proteomics. 2013;85:53–64. doi: 10.1016/j.jprot.2013.04.016. [DOI] [PubMed] [Google Scholar]
- Wei J., Zhang F., Zhang Y. J. Proteome Res. 2014;13:5724–5733. doi: 10.1021/pr5007119. [DOI] [PubMed] [Google Scholar]
- Song C., Liu B., Xie J. Sci. Rep. 2017;7:40356. doi: 10.1038/srep40356. [DOI] [PMC free article] [PubMed] [Google Scholar]
- Lu G. D., Shen H. M., Ong C. N. Proteomics: Clin. Appl. 2007;1:410–419. doi: 10.1002/prca.200600798. [DOI] [PubMed] [Google Scholar]
- Van Summeren A., Renes J., van Delft J. H., Kleinjans J. C., Mariman E. C. Toxicol. in Vitro. 2012;26:373–385. doi: 10.1016/j.tiv.2012.01.012. [DOI] [PubMed] [Google Scholar]
- Cho Y. E., Singh T. S., Lee H. C., Moon P. G., Lee J. E., Lee M. H., Choi E. C., Chen Y. J., Kim S. H., Baek M. C. Mol. Cell. Proteomics. 2012;11:M111–010884. doi: 10.1074/mcp.M111.010884. [DOI] [PMC free article] [PubMed] [Google Scholar]
- Cho Y. E., Moon P. G., Lee J. E., Singh T. S., Kang W., Lee H. C., Lee M. H., Kim S. H., Baek M. C. Proteomics. 2013;13:1257–1275. doi: 10.1002/pmic.201200368. [DOI] [PubMed] [Google Scholar]
- Banaszak L. J., Bradshaw R. A. Enzymes. 1975;11:369–396. [Google Scholar]
- Minarik P., Tomaskova N., Kollarova M., Antalik M. Gen. Physiol. Biophys. 1975;21:257–266. [PubMed] [Google Scholar]
- Green D. R., Reed J. C. Science. 1998;281:1309–1311. doi: 10.1126/science.281.5381.1309. [DOI] [PubMed] [Google Scholar]
- Huang S. S., Yeh S. F., Hong C. Y. J. Nat. Prod. 1995;58:1365–1371. doi: 10.1021/np50123a005. [DOI] [PubMed] [Google Scholar]
- Vargas F., Diaz Y., Carbonell K. Pharm. Biol. 2004;42:342–348. [Google Scholar]
- Li H. L., Chen H. L., Li H., Zhang K. L., Chen X. Y., Wang X. W., Qing Y. K., Liu J. Int. J. Mol. Med. 2005;16:41–47. [PubMed] [Google Scholar]
- Wu Y., Tu X., Lin G., Xia H., Huang H., Wan J., Cheng Z., Liu M., Chen G., Zhang H., Fu J. Life Sci. 2007;81:1332–1338. doi: 10.1016/j.lfs.2007.08.040. [DOI] [PubMed] [Google Scholar]
- Lu Y., Zhang J., Qian J. Cancer Biother. Radiopharm. 2008;23:222–228. doi: 10.1089/cbr.2007.0425. [DOI] [PubMed] [Google Scholar]
- He Z. H., He M. F., Ma S. C., But P. P. H. J. Ethnopharmacol. 2009;121:313–317. doi: 10.1016/j.jep.2008.11.008. [DOI] [PubMed] [Google Scholar]
- Huang Q., Shen H. M., Ong C. N. Biochem. Pharmacol. 2004;68:361–371. doi: 10.1016/j.bcp.2004.03.032. [DOI] [PubMed] [Google Scholar]
- Huang Q., Shen H. M., Shui G., Wenk M. R., Ong C. N. Cancer Res. 2006;66:5807–5815. doi: 10.1158/0008-5472.CAN-06-0077. [DOI] [PubMed] [Google Scholar]
- Huang Q., Lu G., Shen H. M., Chung M. C., Ong C. N. Med. Res. Rev. 2007;27:609–630. doi: 10.1002/med.20094. [DOI] [PubMed] [Google Scholar]
- Srinivas G., Babykutty S., Sathiadevan P. P., Srinivas P. Med. Res. Rev. 2007;27:591–608. doi: 10.1002/med.20095. [DOI] [PubMed] [Google Scholar]
- Su Y. T., Chang H. L., Shyue S. K., Hsu S. L. Biochem. Pharmacol. 2005;70:229–241. doi: 10.1016/j.bcp.2005.04.026. [DOI] [PubMed] [Google Scholar]
- Ravagnan L., Gurbuxani S., Susin S. A., Maisse C., Daugas E., Zamzami N., Kroemer G. Nat. Cell Biol. 2001;3:839–843. doi: 10.1038/ncb0901-839. [DOI] [PubMed] [Google Scholar]
- Shi Y., Tu Z., Tang D., Zhang H., Liu M., Wang K., Xiao X. Shock. 2006;26:277–284. doi: 10.1097/01.shk.0000223134.17877.ad. [DOI] [PubMed] [Google Scholar]
- Gamage N., Barnett A., Hempel N., Duggleby R. G., Windmill K. F., Martin J. L., McManus M. E. Toxicol. Sci. 2005;90:5–22. doi: 10.1093/toxsci/kfj061. [DOI] [PubMed] [Google Scholar]
- Seidler N. W., GAPDH: biological properties and diversity, Springer Science & Business Media, 2012, vol. 985. [Google Scholar]
- Seidler N. W., Basic biology of GAPDH. In GAPDH: Biological Properties and Diversity, Springer Netherlands, 2013, pp. 1–36. [Google Scholar]
- Vaux D. L., Korsmeyer S. J. Cell. 1999;96:245–254. doi: 10.1016/s0092-8674(00)80564-4. [DOI] [PubMed] [Google Scholar]
- Nicholson D. W. Cell Death Differ. 1999;6:1028–1042. doi: 10.1038/sj.cdd.4400598. [DOI] [PubMed] [Google Scholar]
- Slee E. A., Harte M. T., Kluck R. M., Wolf B. B., Casiano C. A., Newmeyer D. D., Green D. R. J. Cell Biol. 1999;144:281–292. doi: 10.1083/jcb.144.2.281. [DOI] [PMC free article] [PubMed] [Google Scholar]
- Chen H., Wei W., Guo Y., Liu A., Tong H., Wang Z., Tan W., Liu J., Lin S. Oncol. Rep. 2011;25:1253–1261. doi: 10.3892/or.2011.1174. [DOI] [PubMed] [Google Scholar]
- Lin S., Lai W., Ho C., Yu F., Chen G., Yang J., Liu K., Lin M., Wu P., Fan M., Chung J. G. Anticancer Res. 2009;29:327–335. [PubMed] [Google Scholar]
- Cheng X., Du Y., Huang L., Jing Z., Zheng Z. Chin.-Ger. J. Clin. Oncol. 2008;7:213–216. [Google Scholar]
Associated Data
This section collects any data citations, data availability statements, or supplementary materials included in this article.


