 In recent years, nanotechnology has been proven to offer promising biomedical applications for in vivo diagnostics and drug delivery, stressing the importance of thoroughly investigating the biocompatibility of potentially translatable nanoparticles (NPs).
Abstract
In recent years, nanotechnology has been proven to offer promising biomedical applications for in vivo diagnostics and drug delivery, stressing the importance of thoroughly investigating the biocompatibility of potentially translatable nanoparticles (NPs). Herein, we report the cellular responses of uncoated chitosan NPs (CS NPs) and hyaluronic acid-coated chitosan NPs (HA-CS NPs) when introduced into Chinese hamster ovary cells (CHO-K1) in a dose-dependent manner (2.5, 0.25, 0.025, 0.0025, and 0.00025 mg mL–1) at two time points (24 and 48 h). MTS assay, cell proliferation, showed a decrease in the viability of cells when treated with 0.25 and 2.5 mg mL–1 CS NPs. When exposed to high doses of CS NPs, the lactate dehydrogenase (LDH) enzyme started to leak out of the cells and the cellular levels of mitochondrial potentials were significantly reduced accompanied by a high production of intracellular reactive oxygen species (ROS). Our study provides molecular evidence of the biocompatibility offered by HA-CS NPs, through ROS scavenging capabilities rescuing cells from the oxidative stress, showing no observed cellular stress and thereby revealing the promising effect of anionic hyaluronic acid to significantly reduce the cytotoxicity of CS NPs. Our findings are important to accelerate the translation and utilization of HA-CS NPs in drug delivery, demonstrating the pronounced effect of surface modifications on modulating the biological responses.
Introduction
Chitosan, a cationic glycosaminoglycan polysaccharide, has attracted much interest because it is possibly the only polycation of a natural (renewable) origin that offers a relatively low toxicity.1,2 Due to its availability and benign nature, chitosan has found applications in numerous fields such as agriculture and food processing,3 biochemistry,4 and biomedicine.5,6 Various chitosan-based nanomaterials have been developed, and often employed for nano-drug delivery.7,8 With the wide use of nanomaterials,9–11 it is essential to thoroughly explore their toxicity and immunogenicity before being adopted for in vivo medical use.
The relatively high positive charge density of chitosan along with its rapid agglomeration at physiological pH could ultimately result in its cytotoxicity due to membrane damage (lower than most polycations, yet significant), unselective protein adsorption, and therefore unspecific cellular uptake.12,13 A potential solution to overcome these drawbacks and eventually make chitosan-based nanomaterials effective in nano-drug delivery is their complexation/decoration with anionic macromolecules, such as alginate, poly(γ)-glutamic acid (PGA), glycosaminoglycans (GAGs), heparin/heparin sulphate and hyaluronic acid (HA).14–17 The latter has in particular shown promise to confer biocompatibility and receptor-targeting abilities (internalization via CD44) in view of in vivo applications. Indeed, HA-based nanomaterials have been frequently used for the modification of drug carriers.6,18,19 To the best of our knowledge, no parallel evaluations have been done to explore the potential of polyanion addition, despite its effects in terms of charge density, size, and surface modification, which are major determinants of cellular responses.20,21
In this study, we have focused on a toxicological comparison that signifies the influence of HA coating via the side-by-side investigation of the effects of chitosan nanoparticles and HA-decorated chitosan nanoparticles (CS and HA-CS NPs, respectively) on cytotoxicity, cell membrane integrity, oxidative stress, mitochondrial activity, and inflammatory activation of Chinese hamster ovary cells (CHO-K1).
Materials and methods
Materials
High molecular weight chitosan (highly viscous) obtained from crab shells, sodium triphosphate pentabasic (TPP), sodium nitrite (NaNO2), hydrochloric acid (HCl), and sodium hydroxide (NaOH) were obtained from Sigma-Aldrich (UK). Hyaluronic acid (HA; weight-average molecular weight 200 kDa) was purchased from Medipol SA (Switzerland). Glacial acetic acid and sodium acetate were purchased from VWR BDH Chemicals (UK). Regenerated cellulose (RC) dialysis membrane of MWCO 1000 kDa was obtained from SpectraPor Spectrum Laboratories Inc. (USA). Quantipro BCA assay kit and Triton X-100 were purchased from Sigma–Aldrich (UK). Fetal bovine serum (FBS) was purchased from Invitrogen (Paisley, UK). CellTiter 96® AQueous one solution cell proliferation assay and DeadEnd™ Fluorometric TUNEL System were purchased from Promega (Madison, USA). LDH cytotoxicity Assay Kit, Superoxide Dismutase Assay Kit, Caspase-3 Fluorescence Assay Kit, and JC-1 Mitochondrial Membrane Potential Assay Kit were purchased from Cayman Chemical Company (USA).
Purification of chitosan
5 g of CS were dissolved in 500 mL of 0.1 M HCl. Complete dissolution was achieved after stirring for 16 h. The solution was then boiled for 15 min in order to denature and precipitate any protein contaminants. The mixture was centrifuged at 3402g for 10 min and the supernatant was then removed and filtered through a 1 μm pore size filter. CS was then precipitated from the aqueous phase by raising the pH of the solution to 9 with 1 M NaOH. The precipitate was re-dispersed and sedimented by centrifugation twice using water at pH 8 as a dispersing medium. The dispersion was then purified by centrifugation with distilled water until the conductivity and pH values of the wastewater reached the values of distilled water. The sample was then lyophilized and stored at 4 °C.
Depolymerization of chitosan
CS oligomers were prepared by the oxidative degradation of CS using NaNO2 in acidic solution. Purified CS (1% w/v) was dissolved in 0.1 M HCl solution under magnetic stirring. Appropriate amounts of NaNO2 were slowly added to the CS solution while stirring to final concentrations of NaNO2 (0.5 and 5 mM). The mixtures were left under continuous stirring for 12 h at room temperature. At the end of the depolymerisation step, the pH values of the mixtures were adjusted to 8.0 with 1 M NaOH until the solutions became milky, and then purified by centrifugation with distilled water until the conductivity and pH values of the wastewater reached the values of distilled water. The samples were then lyophilized and stored at 4 °C.
Preparation of nanoparticles
A 0.069 wt% chitosan solution was prepared by dissolving purified chitosan in 4.6 mM HCl and adjusting the pH to 5 with 0.1 M NaOH. Prior to use, the solution was kept stirring overnight. 0.1 wt% TPP was dissolved in deionized water and the solution was brought to pH 5 using 0.1 M HCl. Both solutions were filtered through a 0.22 mm pore size filter. 3.5 mL of the TPP solution was added to a CS solution for a final volume of 50 mL making a 9 : 1 CS : TPP mass ratio to produce 0.064 and 0.0071 wt% of CS and TPP, respectively. Then, complexation was carried out under magnetic agitation (750 rpm) for 30 min at 25 °C. The final dispersion was sonicated for 40 min and then left undisturbed for an additional 16 h. Finally, the dispersed nanoparticles were dialyzed against deionized water (MWCO 1000 kDa). HA coating of CS NPs was done following a previously published procedure22 with a slight modification. In brief, CS NPs (0.025 wt%) were dispersed in 0.1 M acetic acid/acetate buffer at pH 5. The dispersion was then slowly added under vigorous stirring (30 min, 1200 rpm) to an equal amount of acetate buffer containing HA (200 kDa) at a concentration of 1.5 mg mL–1. The dispersed NPs were then dialyzed against deionized water (2 days; MWCO 1000 kDa).
Dynamic light scattering (DLS)
The Z-average hydrodynamic diameter, polydispersity index (PDI), and zeta potential measurements were always performed at room temperature using a Zetasizer Nano ZS instrument (Model ZEN3600, Malvern Instruments Ltd, UK), equipped with a solid state HeNe laser (λ = 633 nm) at a scattering angle of 173°.
Cell culturing
CHO-K1 cells (ATCC-CCL-61, USA) were grown in F12 K Nutrient Mixture (Gibco, USA), while 264.7 RAW macrophages (ECACC, UK) were grown in Dulbecco's modified Eagle's minimal essential medium (Gibco, USA). Cells were supplemented with 10% FBS and incubated under 5% CO2 at 37 °C. Cells were detached (enzymatically using trypsin) and adjusted to the required concentration of viable cells in the 96-well plates, by counting in a hemocytometer slide.
Cell viability assay
CHO-K1 cells were seeded (10 000 cells per well) in a 96-well plate, cultured in F12 K medium containing 10% FBS, 1% antibiotic/antimitotic solution, and 1% l-glutamate (full medium) and incubated for 24 h under standard sterile conditions for cell culture (5% CO2, 37 °C). CS NPs were filtered in an ultrafiltration chamber. Then, concentrated NPs were suspended in a 2× medium. NPs were prepared in a manner of a ten-fold serial dilution to prepare 5 dilutions starting with the highest concentration of 2.5 mg in serum-free medium. 100 μL of these dilutions were added to each well and the cells were incubated for 24 and 48 h.
After incubation, the cells were washed with phosphate buffered saline (PBS) and further incubated for an additional 2 h in a plain medium containing MTS. The cytotoxicity was measured colorimetrically by reading their absorbance at 490 nm using a Synergy2 Biotek plate reader. The absorbance readings were normalized against the total protein content quantified using a Quantipro BCA assay kit. In short, the cells were washed with PBS and lysed with 100 μL cell lysis buffer following the instructions of the manufacturer (0.5% Triton X-100 in PBS). The absorbance at 562 nm was recorded after 2 h of incubation at 37 °C.
Lactate dehydrogenase (LDH) release assay
CHO-K1 cells were seeded into 96-well plates at a density of 5 × 10³ cells per well and were allowed to adhere overnight. The medium was removed from the wells and replaced with 200 μL medium containing CS NPs at concentrations of 2.5, 0.25, 0.025, 0.0025 and 0.00025 mg mL–1, and allowed to incubate for 24 and 48 h. The assay was conducted according to the manufacturer's instructions and LDH was measured at 490 nm.
Mitochondrial potential (JC 1) level assay
CHO-K1 cells were seeded in a 96-well plate with 5 × 10³ cells per well and treated with NPs at 5 concentrations of ten-fold dilutions (2.5, 0.25, 0.025, 0.0025 and 0.00025 mg mL–1), and then incubated for 24 and 48 h. Cells at each incubation period were prepared according to the manufacturer's instructions. In brief, cells were stained with 5 μL of JC 1 staining solution while mixing gently. Cells were incubated (5% CO2 and 37 °C) for 30 min and washed twice. In brief, the plate was centrifuged for 5 min at 400g at room temperature, followed by supernatant removal, the addition of 200 μL assay buffer, centrifugation for 5 min at 400g, and supernatant removal. 100 μL assay buffer was added to each well and the plate was analyzed by using a fluorescent plate reader. Healthy cells display strong fluorescence intensity with the excitation and emission at 535 and 595 nm, respectively. Cells with mitochondrial injury will fluoresce when excited at 485 nm and measured at 535 nm.
Superoxide dismutase (SOD) depletion assay
CHO-K1 cells were seeded in 25 cm2 flasks and treated with NPs at five concentrations (2.5, 0.25, 0.025, 0.0025 and 0.00025 mg mL–1), and then incubated for 24 and 48 h. After exposure, the cells were scraped and washed twice with chilled 1× PBS. The harvested cell pellets were lysed using 20 mM HEPES (pH 7.2) containing 1 mM EGTA, 210 mM mannitol and 70 mM sucrose. The cells were centrifuged at 1500g for 10 min at 4 °C and the supernatant was maintained on ice until assayed for oxidative stress biomarkers. SOD was measured at 450 nm according to the manufacturer's instructions.
Reactive oxygen species (ROS)
CHO-K1 cells were seeded in a 96-well plate with 5 × 10³ cells per well and treated with 2.5 mg mL–1 NPs, followed by incubation for 24 and 48 h. At the end of each incubation, the cells were washed with PBS (pH = 7.4) and stained according to the manufacturer's instructions. ROS fluorescence intensity was measured at an excitation at 640 nm and emission at 675 nm.
TUNEL assay
CHO-K1 cells were seeded in Lab-Tek® Chamber Slides at a density of 3 × 10⁵ cells and incubated (5% CO2 and 37 °C) to reach 80–85% confluency. Then, the cells were treated with 2.5 mg mL–1 NPs and were left to incubate for 24 and 48 h (5% CO2 and 37 °C). At the end of each incubation period, the cells were washed with PBS (pH = 7.4) and fixed with 4% paraformaldehyde. Cells were permeabilized with 0.2% Triton X-100 and then labelled with fluorescein-12-dUTP to produce green fluorescence in apoptotic cells.
Caspase-3 activity assay
The activity of caspase-3 was determined from the cleavage of the caspase-3 substrate (N-acetyl-DEVD-p-nitroaniline). CHO-K1 cells were seeded in a 96-well plate at a density of 5 × 10³ cells/well, treated with NPs at varying concentrations (2.5, 0.25, 0.025, 0.0025 and 0.00025 mg mL–1), and then incubated for 24 and 48 h. The cleavage of the substrate was monitored by measuring the fluorescence density of each well at an excitation of 485 nm and an emission of 535 nm.
Activation of RAW 264.7 macrophages with LPS
RAW 264.7 macrophages were seeded (10 000 cells per well) in a 96-well plate and incubated with increasing amounts of LPS (0.1, 0.25, 0.5 and 1 μg) for 24 h. At the completion of the incubation, the cell culture supernatants were transferred to Eppendorf tubes and centrifuged at 18 000g for 5 min. Next, the levels of TNF-α, IL-1β, and nitrite were quantified as mentioned below. The effect of LPS activation on the metabolic activity of macrophages was analyzed by incubating the cells in the plates for 2 h in a plain medium containing MTS. The metabolic activity was measured colorimetrically using the MTS assay.
Effect of nanoparticles on inflammatory mediators
Macrophages were seeded in 24-well flat-bottomed plates at a density of 1 × 10⁵ cells per well and allowed to adhere overnight under standard conditions for cell culture. The cells were then washed once with PBS and treated with fresh medium containing 1 μg mL–1 LPS or nanoparticles at 0.25 mg mL–1 concentration. In another experiment, cells were treated with fresh medium containing 1 μg mL–1 LPS alone, with nanoparticles at 0.25 mg mL–1 concentration or with HA at 0.125 mg mL–1 concentration. Cells with fresh medium, without any effectors, were used as a negative control. After 24 h of incubation, the cell culture supernatants were transferred to Eppendorf tubes and centrifuged at 18 000g for 5 min, and then analyzed for the presence of inflammatory mediators as described below.
Production of nitrite
50 μl of the supernatants were transferred to a 96-well flat-bottomed microtiter plate and mixed with Griess reagent (1% (w/v) sulfanilamide in 5% (v/v) phosphoric acid and 0.1% (w/v) naphthylethylenediamide–HCl) according to the manufacturer's instructions, and the absorbance was measured at 550 nm. Nitrite concentrations were calculated from a standard curve generated using serial dilutions of NaNO2 in fresh culture medium. The protein content of each well was evaluated as described previously.
Production of TNF-α and IL-1β
The quantifications and measurements of TNF-α and IL-1β were determined following the manufacturer's protocol using ELISA mouse sets OptEIA™ (BD) for both TNF-α and IL-1β. The measurements of TNF-α and IL-1β were normalized and corrected for the protein content.
Results and discussion
Synthesis and characterization
In order to assess whether the surface chemistry of NPs has significant effects on the cellular responses, high molecular weight chitosan was purified and oxidatively depolymerized using nitrous acid to obtain various molecular weights of CS following published reports.23–26 This is a selective reaction in which nitrous acid attacks the amine groups and cleaves β-glycosidic linkages.27 Then, NPs were fabricated by utilizing a templated ionic gelation method, which is based on a first complexation of chitosan with triphosphate (TPP) followed by HA, offering a simple and rapid preparation method in aqueous solutions based on the electrostatic attractions between the amine groups of CS and the negatively charged groups of the polyanions such as TPP and HA. Varying the ratio between the polymer and polyanions could alter the size and surface potential of the NPs and consequently produce NPs with varying morphologies and internal structures.4,28
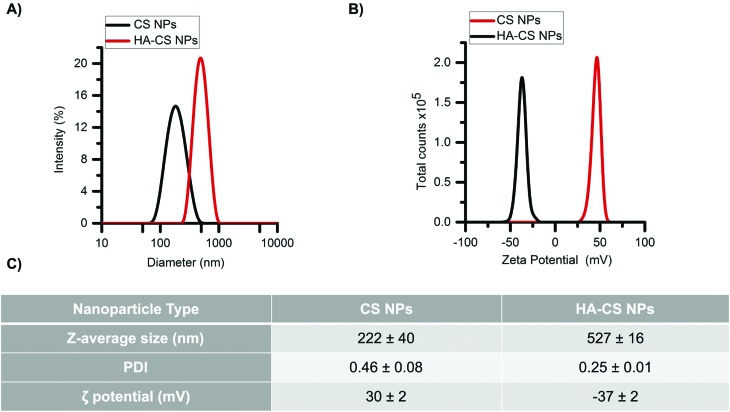
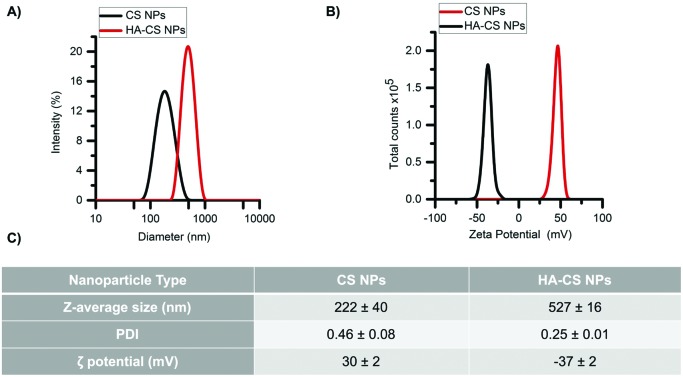
Glucosamine units in CS have pKa values in the range of 6–7, depending on the deacetylation degree.29 Therefore, CS is highly positively charged at pH values below its pKa values. The first NPs (CS NPs) showed a narrow size distribution (Fig. 1A) and, as expected, large and positive zeta potentials (Fig. 1B). Carboxyl groups of HA have pKa values ranging between 3–4 and thereby these groups are deprotonated at pH > 4, yielding negatively charged moieties. The addition of HA produced HA-decorated CS NPs (HA-CS NPs), where the anionic HA shielded the positive charge density and produced moderate negative zeta potentials instead (Fig. 1B), while also increasing the NP size (Z-average diameter from 220 nm to 530 nm), which indicates some agglomeration to occur during the coating process (Fig. 1C), although a relatively narrow size distribution was maintained. The different compaction of the CS–TPP core controls the adsorption of the polyanionic HA on its surface.4 HA could form a thick outer layer on more densely cross-linked low molecular weight CS, influencing its stability. The obtained results suggest the presence of a thick layer of HA surrounding a core of agglomerated CS NPs.
Fig. 1. Physicochemical characterization of nanoparticles. (A) Size distribution and (B) zeta potential of nanoparticles. (C) Data analysis of three independent experiments.
Cell viability and oxidative stress
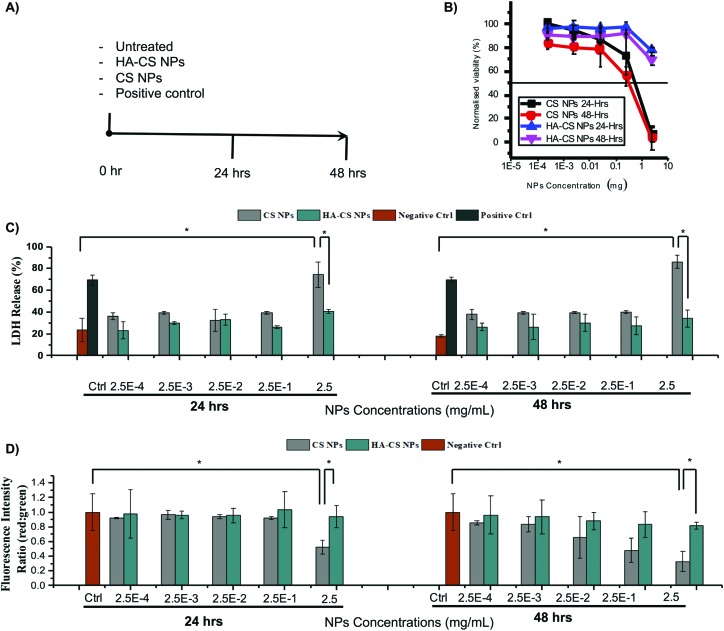
First, CS NPs were introduced to CHO-K1 cells at different concentrations (2.5, 0.25, 0.025, 0.0025, 0.00025 mg mL–1) for one or two days. The MTS assay showed a significant reduction in cell viability with IC50 values estimated to be below 1 mg mL–1 both at 24 and 48 h, and significant reduction observed already at 0.25 mg mL–1 (Fig. 2B). The rather marginal differences between the two time points may be attributed to the rapidity of the CS NP agglomeration and sedimentation,12 upon approaching the neutrality point (±1.5). This would concentrate the NPs in the proximity of the cells and therefore specifically enhance potential membrane damage. When HA-CS NPs were employed, CHO-K1 cells retained their viability both at 24 and 48 h at all concentrations of NPs (small decrease only at 2.5 mg mL–1; Fig. 2B). One plausible explanation is the reduced agglomeration of HA-CS NPs due to electrostatic repulsion, as HA-CS NPs retain their negative charges rendering them more stable and thereby more safe to CHO-K1 cells.
Fig. 2. Cytotoxicity timeline (A) for (B) cell viability, (C) lactate dehydrogenase release, and (D) mitochondrial potential of cells incubated with nanoparticles.
In a second instance, we have examined the mode of cell death caused by CS NPs, assessing the cell membrane integrity via the lactate dehydrogenase (LDH) test. This is commonly used to measure cell necrosis, which is often caused or accompanied by oxidative stress.30–32 Oxidative stress is known to participate in tissue and cell injuries, leading to the increased production of reactive oxygen species (ROS) as a function of mitochondrial injury;33–35 therefore we have also assessed mitochondrial function.
The CS NP treatment determined significant LDH release (statistically larger than that with HA-CS NPs) only at the highest NP concentration (Fig. 2C), whereas neither at 24 nor at 48 h, 0.25 mg mL–1 CS NPs appeared to produce significant membrane damage, while the MTS assay had shown this concentration to cause measurable decreases in viability (mitochondrial reductase activity) at both time points.
The levels of mitochondrial potential provided an intermediate picture (Fig. 2D), with 0.25 mg mL–1 CS NPs showing a significant effect at 48 h, but not at 24 h. Therefore, it could be concluded that membrane damage events highlighted by LDH were probably anticipated by intracellular processes starting earlier/at lower CS concentrations. It is noteworthy that the presence of HA appeared to completely remove the latter. In fact, HA coating was significantly efficient in rescuing cells from the lethal mitochondrial injury exerted by 2.5 mg mL–1 CS NPs.
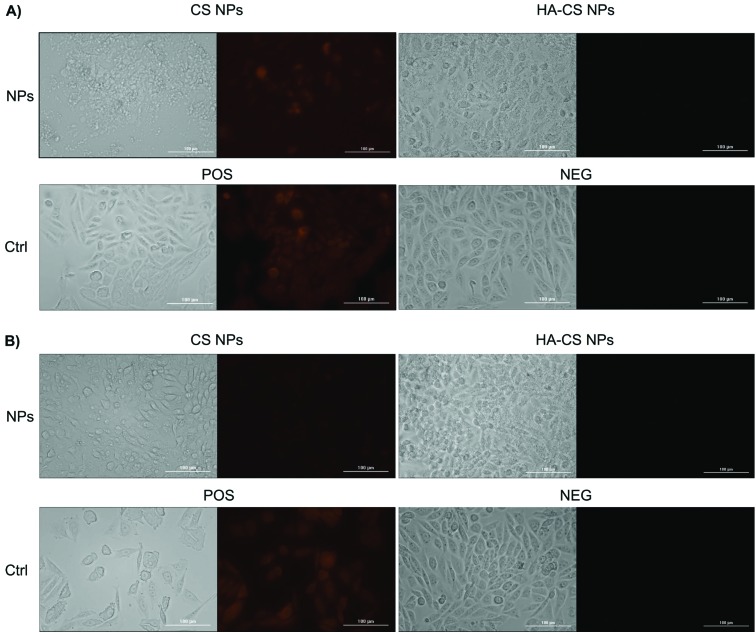
Following this train of thoughts, we have evaluated the intracellular ROS production of cells exposed to the highest dose of NPs (2.5 mg mL–1). Indeed, the ROS red fluorescent signal was intense in cells exposed to CS NPs when compared to HA-CS NPs (Fig. 3), providing another line of evidence that CS NPs induce lethal oxidative stress when utilized at such high doses. The results indicate that high doses of CS NPs could still be applied without causing oxidative stress, if they were coated with HA polyanions. HA has pronounced ROS scavenging and antioxidant activities,36,37 rescuing cells from the lethal oxidative stress caused by a high dose (2.5 mg mL–1) of CS NPs. While a high dose of HA-CS NPs masked the cell morphologies as shown in the bright-field images (Fig. 3), examining more bright-field images of CHO-K1 cells showed no clear signs of morphological changes (Fig. S3†).
Fig. 3. Reactive oxygen species (ROS) production from cells exposed to a high dose of nanoparticles (2.5 mg mL–1) over (A) 24 h and (B) 48 h.
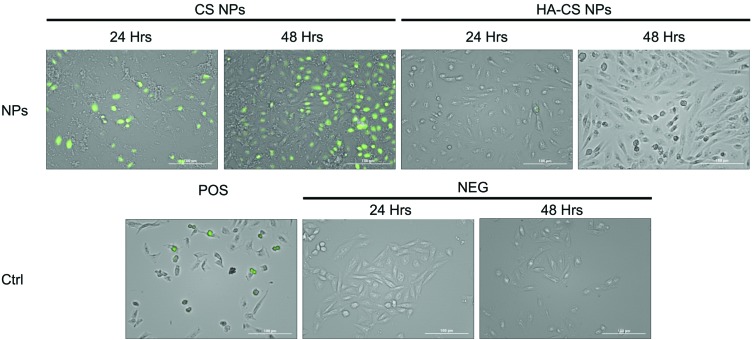
In addition to cell necrosis, cell apoptosis can occur as a function of oxidative stress. Indeed, TUNEL data analysis shows detectable signs of apoptosis after treating cells with the highest dose of CS NPs relative to HA-CS NPs (Fig. 4). However, an analysis of the caspase-3 and superoxide dismutase (SOD) activities demonstrates no significant activation of the apoptotic pathway within CHO-K1 cells over two days of incubation with either CS NPs or HA-CS NPs (ESI Fig. S2†). The findings suggest that the ROS-meditated apoptosis, which results from exposing cells to CS NPs, plays a less important role relative to the ROS-mediated cell necrosis.
Fig. 4. TUNEL quantification of DNA fragmentation from cells exposed to a high dose of nanoparticles (2.5 mg mL–1) over 24 and 48 h.
Production of TNF-α and IL-1β
To validate the safety and effectiveness of HA-CS NPs to suppress the toxicity of CS NPs, we exposed them to oxidative biological environments. Oxidative stress is a hallmark of inflammation, a mechanism of innate immunity that propagates upon extrinsic or intrinsic stimuli such as pathogens, damaged cells, or toxic NPs.38–40 One of the highly important cell types of the innate immune system is macrophages, which are known to exert certain functions such as the release of ROS.34 In short, RAW 264.7 macrophages were activated upon 24 h of exposure to sub-lethal doses of lipopolysaccharides (LPS), evident from the secretion of TNF-α while monitoring the viability of macrophages under the same conditions (ESI Fig. S4†). The data show that HA-CS NPs drastically reduced the generation of nitric oxide (NO), which is normally secreted at high levels by the activated macrophages (Fig. 5). In addition, HA-CS NPs reduced the production of the inflammatory cytokines TNF-α and IL-1β. Apparently, the cytotoxic effects of CS NPs could be suppressed by adopting the anionic HA as a promising approach for surface modifications to deliver drugs without eliciting undesired biological responses.
Fig. 5. Effect of nanoparticles on the extracellular levels of nitrite, TNF-α and IL-1β in LPS activated raw 264.7 macrophages exposed to 0.25 mg mL–1 HA-CS NPs or 0.125 mg mL–1 linear HA.
Conclusions
We have studied the cellular responses of CHO-K1 cells when treated with either CS NPs or HA-CS NPs at varying doses and incubation times. We have investigated the mechanism of cell death caused by CS NPs to show that the ROS-meditated apoptosis plays a less important role relative to the ROS-mediated cell necrosis. Indeed, CS NPs damaged the plasma membrane of cells leading to LDH release into the extracellular matrix followed by mitochondrial injury and subsequent production of intercellular ROS. While the cell viability was compromised when exposed to high doses of CS NPs, the HA coating was successful in rescuing cells from such a lethal insult. More importantly, HA-CS NPs were able to maintain the haemostasis of activated macrophages, evident from their ability to scavenge NO and reduce the production of immunostimulators such as TNF-α and IL-1β. Our results support the notion that surface modifications play a major role in modulating the biological responses and pave the way for the utilization of HA-CS NPs in biomedical applications.
Conflicts of interest
There are no conflicts to declare.
Supplementary Material
Acknowledgments
This work is funded by the Saudi National Transformation Program (NTP) 2020 and King Abdulaziz City for Science and Technology (KACST), projects no. 20-0103 and no. 20-0051. H. A. extends his appreciation to the Deanship of Scientific Research at King Saud University for funding this work through research group no. RGP-1438-045.
Footnotes
†Electronic supplementary information (ESI) available. See DOI: 10.1039/c8tx00041g
References
- Ungphaiboon S., Attia D., Gomez d'Ayala G., Sansongsak P., Cellesi F., Tirelli N. Soft Matter. 2010;6(17):4070–4083. [Google Scholar]
- Younes I., Frachet V., Rinaudo M., Jellouli K., Nasri M. Int. J. Biol. Macromol. 2016;84:200–207. doi: 10.1016/j.ijbiomac.2015.09.031. [DOI] [PubMed] [Google Scholar]
- Klein M. P., Hackenhaar C. R., Lorenzoni A. S. G., Rodrigues R. C., Costa T. M. H., Ninow J. L. Carbohydr. Polym. 2016;137:184–190. doi: 10.1016/j.carbpol.2015.10.069. [DOI] [PubMed] [Google Scholar]
- Almalik A., Donno R., Cadman C. J., Cellesi F., Day P. J., Tirelli N. J. Controlled Release. 2013;172(3):1142–1150. doi: 10.1016/j.jconrel.2013.09.032. [DOI] [PubMed] [Google Scholar]
- Ahmed T. A., Aljaeid B. M. Drug Des., Dev. Ther. 2016;10:483–507. doi: 10.2147/DDDT.S99651. [DOI] [PMC free article] [PubMed] [Google Scholar]
- Jain A., Thakur K., Sharma G., Kush P., Jain U. K. Carbohydr. Polym. 2016;137:65–74. doi: 10.1016/j.carbpol.2015.10.012. [DOI] [PubMed] [Google Scholar]
- Natrajan D., Srinivasan S., Sundar K., Ravindran A. J. Food Drug Anal. 2015;23(3):560–568. doi: 10.1016/j.jfda.2015.01.001. [DOI] [PMC free article] [PubMed] [Google Scholar]
- Arora D., Dhanwal V., Nayak D., Saneja A., Amin H., ur Rasool R. Mater. Sci. Eng., C. 2016;61:227–234. doi: 10.1016/j.msec.2015.12.035. [DOI] [PubMed] [Google Scholar]
- Alhasan A. H., Patel P. C., Choi C. H., Mirkin C. A. Small. 2014;10(1):186–192. doi: 10.1002/smll.201302143. [DOI] [PMC free article] [PubMed] [Google Scholar]
- Sheng W., Alhasan A. H., DiBernardo G., Almutairi K. M., Rubin J. P., DiBernardo B. E. Plast. Reconstr. Surg. Glob. Open. 2014;2(12):e283. doi: 10.1097/GOX.0000000000000251. [DOI] [PMC free article] [PubMed] [Google Scholar]
- Alhasan A. H., Scott A. W., Wu J. J., Feng G., Meeks J. J., Thaxton C. S. Proc. Natl. Acad. Sci. U. S. A. 2016;113(38):10655–10660. doi: 10.1073/pnas.1611596113. [DOI] [PMC free article] [PubMed] [Google Scholar]
- Almalik A., Benabdelkamel H., Masood A., Alanazi I. O., Alradwan I., Majrashi M. A. Sci. Rep. 2017;7(1):10542. doi: 10.1038/s41598-017-10836-7. [DOI] [PMC free article] [PubMed] [Google Scholar]
- Zaki N. M., Nasti A., Tirelli N. Macromol. Biosci. 2011;11(12):1747–1760. doi: 10.1002/mabi.201100156. [DOI] [PubMed] [Google Scholar]
- Goldman C. K., Soroceanu L., Smith N., Gillespie G. Y., Shaw W., Burgess S. Nat. Biotechnol. 1997;15(5):462–466. doi: 10.1038/nbt0597-462. [DOI] [PubMed] [Google Scholar]
- Piras A. M., Sandreschi S., Maisetta G., Esin S., Batoni G., Chiellini F. Pharm. Res. 2015;32(7):2259–2265. doi: 10.1007/s11095-014-1615-9. [DOI] [PubMed] [Google Scholar]
- Croll T. I., O'Connor A. J., Stevens G. W., Cooper-White J. J. Biomacromolecules. 2006;7(5):1610–1622. doi: 10.1021/bm060044l. [DOI] [PubMed] [Google Scholar]
- Lord M. S., Pasqui D., Barbucci R., Milthorpe B. K. J. Biomed. Mater. Res., Part A. 2009;91(3):635–646. doi: 10.1002/jbm.a.32219. [DOI] [PubMed] [Google Scholar]
- Peer D., Margalit R. Int. J. Cancer. 2004;108(5):780–789. doi: 10.1002/ijc.11615. [DOI] [PubMed] [Google Scholar]
- Knudson C. B., Knudson W. FASEB J. 1993;7(13):1233–1241. [PubMed] [Google Scholar]
- Almalik A., Karimi S., Ouasti S., Donno R., Wandrey C., Day P. J. Biomaterials. 2013;34(21):5369–5380. doi: 10.1016/j.biomaterials.2013.03.065. [DOI] [PubMed] [Google Scholar]
- Nasti A., Zaki N. M., de Leonardis P., Ungphaiboon S., Sansongsak P., Rimoli M. G. Pharm. Res. 2009;26(8):1918–1930. doi: 10.1007/s11095-009-9908-0. [DOI] [PubMed] [Google Scholar]
- Almalik A., Day P. J., Tirelli N. Macromol. Biosci. 2013;13(12):1671–1680. doi: 10.1002/mabi.201300302. [DOI] [PubMed] [Google Scholar]
- Fukushige K., Tagami T., Ozeki T. J. Drug Delivery Sci. Technol. 2017;39:435–441. [Google Scholar]
- MacLaughlin F. C., Mumper R. J., Wang J., Tagliaferri J. M., Gill I., Hinchcliffe M. J. Controlled Release. 1998;56(1):259–272. doi: 10.1016/s0168-3659(98)00097-2. [DOI] [PubMed] [Google Scholar]
- Palazzo C., Trapani G., Ponchel G., Trapani A., Vauthier C. Eur. J. Pharm. Biopharm. 2017;117:315–323. doi: 10.1016/j.ejpb.2017.04.020. [DOI] [PubMed] [Google Scholar]
- Tripathi S. K., Goyal R., Kashyap M. P., Pant A. B., Haq W., Kumar P. Biomaterials. 2012;33(16):4204–4219. doi: 10.1016/j.biomaterials.2012.02.035. [DOI] [PubMed] [Google Scholar]
- Santos-Carballal B., Aaldering L. J., Ritzefeld M., Pereira S., Sewald N., Moerschbacher B. M. Sci. Rep. 2015;5:13567. doi: 10.1038/srep13567. [DOI] [PMC free article] [PubMed] [Google Scholar]
- Kamat V., Bodas D., Paknikar K. Sci. Rep. 2016;6:22260. doi: 10.1038/srep22260. [DOI] [PMC free article] [PubMed] [Google Scholar]
- Lee D. W., Lim C., Israelachvili J. N., Hwang D. S. Langmuir. 2013;29(46):14222–14229. doi: 10.1021/la403124u. [DOI] [PMC free article] [PubMed] [Google Scholar]
- Gomathi T., Prasad P. S., Sudha P. N., Anil S. Int. J. Biol. Macromol. 2017;104:1794–1806. [Google Scholar]
- Mokwatsi G. G., Schutte A. E., Kruger R. Biomarkers. 2016;21(1):48–55. doi: 10.3109/1354750X.2015.1118532. [DOI] [PubMed] [Google Scholar]
- Pal S., Chaki B., Chattopadhyay S., Bandyopadhyay A. J. Strength Cond. Res. 2018;32(4):1045–1052. doi: 10.1519/JSC.0000000000002167. [DOI] [PubMed] [Google Scholar]
- Khan H. A., Alhomida A. S., Sobki S. H., Habib S. S., Al Aseri Z., Khan A. A. Biomed. Res. 2013;24(1):15–20. [Google Scholar]
- Glaros T., Larsen M., Li L. Front. Biosci., Landmark Ed. 2009;14:3988–3993. doi: 10.2741/3506. [DOI] [PubMed] [Google Scholar]
- Mittal M., Siddiqui M. R., Tran K., Reddy S. P., Malik A. B. Antioxid. Redox Signaling. 2014;20(7):1126–1167. doi: 10.1089/ars.2012.5149. [DOI] [PMC free article] [PubMed] [Google Scholar]
- Onodera Y., Teramura T., Takehara T., Fukuda K. FEBS Open Bio. 2015;5:476–484. doi: 10.1016/j.fob.2015.05.007. [DOI] [PMC free article] [PubMed] [Google Scholar]
- Ke C., Sun L., Qiao D., Wang D., Zeng X. Food Chem. Toxicol. 2011;49(10):2670–2675. doi: 10.1016/j.fct.2011.07.020. [DOI] [PubMed] [Google Scholar]
- Granger D. N., Kvietys P. R. Redox Biol. 2015;6:524–551. doi: 10.1016/j.redox.2015.08.020. [DOI] [PMC free article] [PubMed] [Google Scholar]
- Stevenson R., Hueber A. J., Hutton A., McInnes I. B., Graham D. Sci. World J. 2011;11:1300–1312. doi: 10.1100/tsw.2011.106. [DOI] [PMC free article] [PubMed] [Google Scholar]
- Fujiwara N., Kobayashi K. Curr. Drug Targets: Inflammation Allergy. 2005;4(3):281–286. doi: 10.2174/1568010054022024. [DOI] [PubMed] [Google Scholar]
Associated Data
This section collects any data citations, data availability statements, or supplementary materials included in this article.


