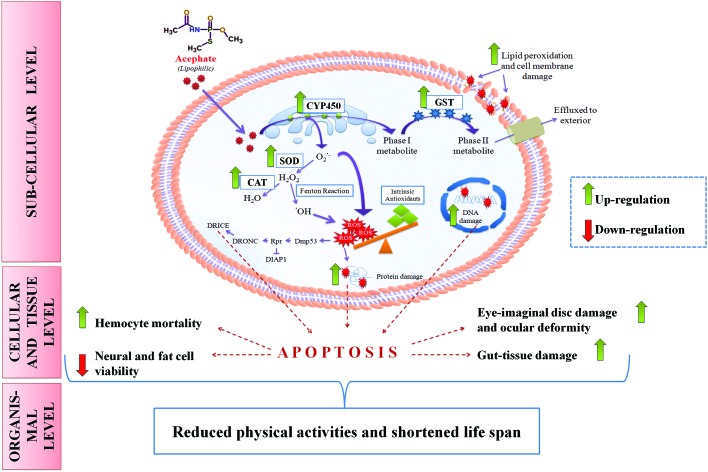
 The present study demonstrates ROS-mediated organismal and sub-organismal injuries in Drosophila melanogaster following chronic acephate exposure.
Abstract
The present study demonstrates ROS-mediated organismal and sub-organismal injuries in Drosophila melanogaster following chronic acephate exposure. Larvae and adults of Drosophila were reared on food supplemented with sub-lethal concentrations (1–6 μg mL–1) of acephate (LC50 8.71 μg mL–1). The longevity of the treated adults was reduced to half at 6 μg mL–1 exposure along with declined neuromuscular coordination and physical activities. Apparent developmental defects in the compound eyes were confirmed through the detection of apoptotic lesions in larval eye imaginal discs. The larval gut manifested tissue damage at various sites. Neural and fat cell viability was reduced by ∼1.89- and ∼3.38-fold at 6 μg mL–1 acephate treatment, respectively. A significant reduction in hemocyte viability confirmed the immunotoxic potential of acephate. Nearly 1–3-fold enhancement in the expression of OS markers (MDA, protein carbonyl contents, SOD, catalase and HSP70) in the treated larvae served as evidence of ROS production. The post-treatment increase in CYP450 and GST activities reflects the ‘switch-on’ states of the phase-I and phase-II detoxification mechanism. The genotoxic potential of acephate was confirmed through alkaline single cell gel electrophoresis. Thus, the findings of the present study validate the fact that besides traditional cholinesterase inhibition, chronic sub-lethal exposure to acephate potentially induces ROS-mediated toxic responses in Drosophila.
1. Introduction
All living organisms are exposed to numerous hazardous materials through air, water and food sources every day. Among several such agents, pesticides are the major one having a global application for crop quality, quantity enhancement and food preservation. Due to the irrational use of pesticides, nearly 98% of these chemicals reach sites that are not intended;1 hence non-target organisms including humans are at risk of exposure. According to a report,2 approximately 250 000 people die worldwide every year due to pesticide poisoning. In spite of serious health concerns, these chemicals are still in use globally to minimize economic loss.
Chemically, pesticides belong to organophosphates, organochlorines, pyrethroids and carbamates. Among them, organophosphate pesticides (OPs) are the major one and affect target pests by the irreversible inhibition of nicotinic and muscarinic cholinesterase of the central and peripheral nervous system.
Acephate (C4H10NO3PS; IUPAC name: N-[methoxy(methylsulfanyl)phosphoryl]acetamide) is a common foliar OP, used in India, USA, France, China and Japan to control lepidopteran (caterpillars), hemipteran (aphids), and hymenopteran (saw flies) pests of fruits and vegetables.3,4 It is also useful for horticulture and forestry. In general, acephate is a white solid having a strong pungent odor similar to mercaptan. It is soluble in water (79–83.5 g per 100 mL) and has a molecular weight of 183.16 g mol–1.
Similar to other OPs, acephate is well known for its anti-cholinesterase activity in insects and mammals.5 Besides this, acephate induces DNA damage in the leucocytes of Swiss albino mice.6 Acephate may be a potent mutagen as it was reported to increase chromosomal aberrations and micronuclei formation in human peripheral lymphocytes and bone marrow cells of chicks.7 Additionally, acephate is documented to promote infertility in humans by adversely affecting the motility, capacitation, vitality, functional integrity of the plasma membrane and DNA of sperms.8 Acephate also provokes oxidative stress in rats by affecting the activities of antioxidant enzymes such as SOD, catalase and glutathione peroxidase.9
Limited reports are available on the chronic toxicity of acephate. Chronic exposure to acephate causes perturbed metabolic processes including glucose, nucleic acid and protein metabolism in Wistar rats.10 In male rats, chronic toxicity is associated with decreased sperm count and motility.11 Long term acephate exposure may affect the behavior and breeding success of birds.12 In humans, chronic exposure to acephate may result in central nervous system impairment, ocular pain, blurred vision, abdominal cramps, heartburn and respiratory problems.13
Being a systemic pesticide, acephate is readily taken up from contaminated water in soil through roots and deposited as residues in various parts, especially leaves, of plants.14 Some reports are available that deal with the residual proportions of acephate in plants. In a previous study,15 acephate residue in tomatoes was found to be 0.15 mg kg–1 following 3 days of field application (150 g a.i. per 100 L). The residue of the same pesticide in mango pulp was detected to be 0.26 mg kg–1 after 3 days of 1.5 kg a.i. per ha treatment.16 Indian and Chinese egg plants were reported to contain 5.2 and 7.8 mg kg–1 acephate residues, respectively.17 Therefore, due to the residual existence of acephate in fruits and vegetables, non-target consumers including humans might be exposed to this chemical.
Acephate is toxic to non-targets like pollinators (bees), fishes, birds and mammals.18–21 The no-observed-adverse-effect level (NOAEL) and lowest-observed-adverse-effect level (LOAEL) of acephate have been established for some mammalian species.22 For rats, rabbits and humans, NOAEL was investigated to be 2.5, 3 and 1.2 mg per kg body wt., respectively. Subsequently, LOAEL has also been established for rats and rabbits to be 5 and 10 mg per kg body wt. but is yet to be evaluated for human beings.
Since non-targets including humans are prone to acephate exposure, its potential hazards should be explored. Therefore, through the present extensive work, we investigated the effects of chronic sub-lethal exposure of acephate and the underlying putative mechanism of toxicity in a non-target organism, Drosophila melanogaster.
D. melanogaster, a non-target for acephate, might be exposed to the chemical in nature while feeding on contaminated fruits. Moreover, D. melanogaster is a well-established model showing almost 75% functional homology with the disease-causing genes of humans.23,24 The developmental, cellular and molecular mechanisms in Drosophila are well studied and understood; thus, it has emerged as a perfect model organism for research in several fields, like genetics, medicine, developmental biology, immunology and toxicology, to elucidate problems of human interest.25,26 Additionally, the European Centre for Validation of Alternative Methods has recommended the use of Drosophila for research on genetic and metabolic disorders of humans.27 We already reported the consequences of the acute toxicity of acephate in Drosophila melanogaster.26 In the present study we suggest that although immediate cholinesterase inhibition results in jeopardy,28,29 the chronic sub-lethal exposure to acephate generates ROS that may play pivotal roles at sub-cellular, cellular and organismal levels to cause health hazards or death of the organism.
2. Materials and methods
2.1. Test chemical and experimental organism
The organophosphate pesticide, acephate (CAS number: 30560-19-1; 75% SP), was used for its toxicological assessment. Acephate is soluble in water and its experimental concentrations were prepared from a water-based stock solution of 200 μg mL–1.
Drosophila melanogaster (Oregon R strain) and flies transgenic to hsp70-lacZ (Bg9) were used for the present study. Flies and larvae were maintained at a temperature of 23 ± 2 °C and 60% relative humidity within the environmental chambers of the laboratory.
2.2. Determination of the chronic median lethal concentration (LC50)
To determine the chronic LC50 of acephate in D. melanogaster, triplicate sets of twenty 1st instar larvae were fed on Standard Drosophila Medium (SDM containing maize powder, sucrose, yeast-extract powder, agar–agar and water) supplemented with 7–12 μg mL–1 of acephate. The numbers of pupae thus formed were counted to determine the percentage of larval mortality.
2.3. Selection and preparation of experimental concentrations in food media
In our previous findings,30,31 the concentrations of acephate ranging from 1–6 μg mL–1 were observed to affect the normal developmental duration and differential hemocyte count of D. melanogaster. Besides, these concentrations were below the chronic LC50 value (as evaluated in this study) and far less than the reported acephate residues in vegetables.15–17 Hence for the present study, we selected 1–6 μg mL–1 concentrations of acephate to assess its toxicological impacts at organismal and sub-organismal levels of fruit flies.
2.4. Experimental design
Freshly hatched 1st instar larvae were reared on selected concentrations of acephate until their 3rd instar larval stage or till their emergence as adults (oral exposure to approximately 7 days). These larvae and adults were considered for several experiments. Triplicate sets for each treatment category were maintained and every experiment was repeated thrice.
2.5. Biochemical assays for detoxifying enzymes
2.5.1. EROD assay for cytochrome P450 1A1 (CYP1A1)
7-Ethoxyresorufin O-deethylase (EROD), an important marker of CYP1A1 activity, was measured following Klotz et al.32 The reaction mixture contained tissue homogenate (10%), distilled water, Tris-Cl buffer (0.1 M, pH 7.8), NaCl (0.1 M) and 7-ethoxyresorufin (2 μM). The reaction was initiated by adding 0.5 mM NADPH and the absorbance of the final product was recorded at 572 nm.
2.5.2. Glutathione-S-transferase (GST) assay
GST activity was evaluated following the method of Habig et al.33 The assay mixture included tissue homogenate (10%), potassium phosphate buffer containing EDTA (1 mM), reduced glutathione (75 mM) and 1-chloro 2,4-dinitrobenzene (30 mM). After reaction for 5 min, the absorbance was observed every minute at 340 nm to calculate ΔOD340 per min. Enzyme activity was calculated using a molar extinction coefficient of 6.25 × 10³ M–1 cm–1.
2.6. Biochemical assays for markers of reactive oxygen species (ROS)
The activities of endogenous antioxidants (superoxide dismutase, catalase) and the products of oxidative stress (malondialdehyde, protein carbonyl contents) were quantified in the 3rd instar larvae to detect any alteration in their normal status under chronic sub-lethal exposure to acephate.
2.6.1. Preparation of tissue homogenates
Tissue homogenates of the control and treated larvae were prepared in 0.1 M phosphate buffer containing 0.15 M KCl (pH 7.4) and centrifuged at 10 000g for 20 min. The supernatant was collected for protein and enzyme assays. Protein estimation was done following an earlier standardized procedure.34
2.6.2. Superoxide dismutase (SOD) assay
For SOD assay, the protocol of Nishikimi et al.35 was adopted. The reaction mixture included sodium pyrophosphate buffer (0.017 M, pH 8.3), NBT (50 μM), NADH (78 μM) and PMS (3.1 μM). Tissue homogenate (10%) was added to the mixture and the reaction was allowed for 3 min. The initial and final absorbance was recorded at 560 nm. 50% inhibition of NBT reduction was considered as 1 unit.
2.6.3. Catalase (CAT) assay
CAT assay was performed following Sinha36 with minor modifications. The reaction mixture contained tissue homogenate (10%), distilled water, sodium pyrophosphate buffer (0.01 M), and H2O2 (0.2 M). The reaction was allowed for 2 min and stopped by adding a dichromate-acetic acid reagent. The reaction mixture was heated in a boiling water bath for 10 min and later cooled to record the absorbance of stable blue colored solution at 570 nm.
2.6.4. Quantification of the malondialdehyde (MDA) product
MDA, a major product of ROS-induced lipid peroxidation, was quantified following the method of Ohkawa et al.37 with modifications. Briefly, tissue homogenate (10%), SDS (8.1%) and acetic acid (20%) were taken in eppendorf tubes and the pH adjusted to 3.5. Later, the reaction mixture was treated with thiobarbituric acid (0.8%) and heated at 95 °C for 1 h. The solution was cooled and mixed with a butanol–pyridine mixture. The absorbance of the final pink colored organic layer was recorded at 532 nm against n-butanol as the blank.
2.6.5. Estimation of protein carbonyl (PC) content
The PC content was estimated following a previously described method.38 The proteins in the tissue homogenates (10%) were precipitated with tricholoroacetic acid (20%) followed by derivatisation of free carbonyl groups with 2,4-dinitrophenylhydrazine. The reaction product dinitrophenylhydrazone was dissolved in guanidine hydrochloride (6 M) and the absorbance was recorded at 375 nm. PC was quantified using a molar absorption coefficient of 22 000 M–1 cm–1.
2.7. Analysis for HSP-70 expression
The soluble O-nitrophenyl β-d-galactopyranoside (ONPG) assay39 was carried out to analyze the expression of HSP-70 in Bg9 transgenic larvae. The control and treated larvae (same age and size) were collected in microcentrifuge tubes (10 larvae per tube in 5 replicates) and permeabilized with acetone for the extraction of proteins. Following overnight incubation at 37 °C with ONPG solution, Na2CO3 (1 M) was added to stop the reaction. The absorbance of the final product was recorded at 420 nm.
2.8. Detection of DNA damage through alkaline single cell gel electrophoresis assay (comet assay)
Gut cells that underwent maximum exposure were examined for acephate-induced genotoxic response if any. The method of Dhawan et al.40 was implemented with modifications. Single cell suspensions were prepared with collagenase (5 mg mL–1) and mixed with 1.0% low melting point agarose in a 1 : 1 ratio. The mixture was poured over a grease-free slide pre-coated with 1.5% normal melting point agarose. The slides were allowed to freeze at 4 °C for 30 min and thereafter immersed in a chilled lysis buffer (containing 2.5 M NaCl, 100 mM EDTA, 10 mM Tris and 1% Triton X-100, pH 10.0) for 2 h. Later, electrophoresis was conducted in an electrophoretic buffer containing 1 mM Na2EDTA and 300 mM NaOH of pH > 13.0 for a period of 15 min at 4 °C. Following electrophoresis, the slides were neutralized in Tris buffer (pH 7.5) and stained with ethidium bromide (20 μg mL–1) for 10 min in the dark. The slides were washed and observed under a fluorescence microscope at 400× magnification. The cells from duplicate sets of slides for the control and each treatment group were scored randomly using the software ‘Comet Assay IV’ of Perceptive Instruments.
2.9. Inspection of tissue and cellular components of the body
2.9.1. Trypan blue (Tb) staining for the detection of gut-tissue damage
The method of Krebs and Feder41 was adopted. The gut of the treated 3rd instar larvae was dissected in Poel's salt solution (PSS) and stained with 0.2 mg mL–1 Tb for 10 min. Excess stain was washed with phosphate-buffer-saline (PBS) to discriminate the Tb positive (damaged) and Tb negative (undamaged) areas of the gut.
2.9.2. MTT [3-(4,5-dimethylthiazolyl-2)-2,5-diphenyltetrazolium bromide] assay
Since the brain and fat body of the larvae are easy to dissociate into a single cell state, they were tested for cell viability through the MTT assay.42 The brain ganglia and fat bodies of the treated 3rd instar larvae were taken out separately in PBS and processed with collagenase (0.5 mg mL–1) to enzymatically individualize the cells. MTT (5 mg mL–1) solution was added to the cell suspensions and incubated overnight. After incubation, DMSO was added to solubilize formazan crystals. The absorbance was recorded at 578 nm with an ELISA plate reader (Erba-Mannheim, LisaScan EM).
2.9.3. Total hemocyte count (THC) and Tb staining
The hemocyte titer fluctuates under minor toxicity stress. Hence, the THC of the larvae was examined following chronic exposure to acephate. Hemolymph from 10 exposed larvae was bled (following a previously established method)31 in 20 μl PSS and stained with the same volume of Tb for 10 min. The hemolymph solution was diluted with 20 μl of PSS and loaded over a hemocytometer for THC. Simultaneously, Tb positive and negative cells were counted to examine cellular mortality.
2.10. Investigation for any morphological change/phenotypic impact
Adult flies exposed to acephate from their 1st instar larval stage were examined for any developmental defect in their body structures. Wings, eyes, legs and bristles were scrutinized using a compound microscope under 100× magnification. The number of individuals with structural deformities was counted to measure the incidence percentage of structural change.
2.11. Acridine orange (AO) staining for the localization of apoptotic lesions
AO staining was performed following the protocol as described earlier.43 The eye imaginal discs of the 3rd instar larvae were isolated in PSS and stained with AO (10 μg mL–1) for 2 min. Tissues were washed with PBS and images taken under a fluorescence microscope (Leica DMI6000B).
2.12. Effect of acephate on the physical activities and life span of the whole organism
2.12.1. Crawling assay
Crawling assay was performed using a previously described method.44 Acephate exposed (different concentrations) 3rd instar larvae were allowed to crawl for 1 min over the surface of petridishes already pre-coated with 2% agarose. The length of impressions thus appeared after crawling was measured using a ruler.
2.12.2. Climbing assay
The change in the physical activity of adult flies was examined following the method of Feany and Bender.45 Twenty freshly hatched flies from each treatment category were transferred to test tubes and allowed to cross a distance vertically above 5 cm. The number of flies crossing the 5 cm mark within 30 s from the time they were tapped to the bottom of the test tubes was recorded. The assay was done in triplicate sets and repeated five times.
2.12.3. Effect of acephate on life span
Twenty freshly hatched adult flies in triplicate sets were allowed to feed on selected sub-lethal concentrations of acephate till their mortality. The control sets (without acephate exposure) were maintained simultaneously for comparison. Daily records on the mortality of flies were obtained. Food media (treatment and control) were replaced at a five-day interval.
3. Results
3.1. Determination of chronic median lethal concentration
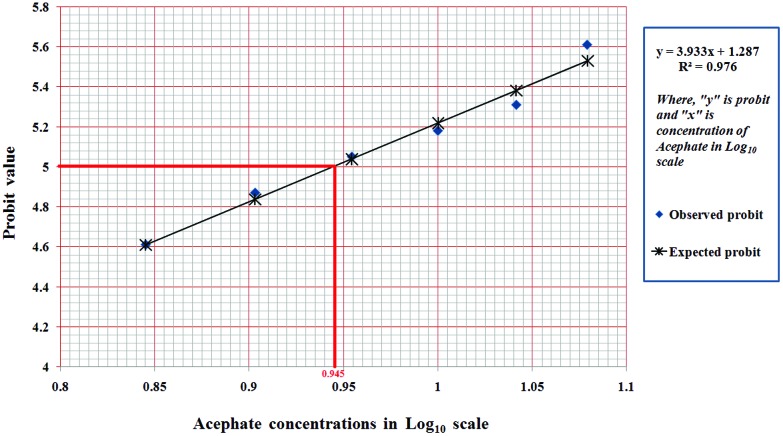
Larvae that underwent chronic exposure to 7, 8, 9, 10, 11 and 12 μg mL–1 concentrations of acephate showed a mean mortality percentage of 36.67 ± 1.17%, 45 ± 5.77%, 51.67 ± 4.5%, 56.67 ± 3.33%, 61.67 ± 1.67% and 68.33 ± 4.41%, respectively. The data indicate that the chronic LC50 value lies somewhere between 8–9 μg mL–1 concentrations. Through probit analysis, the chronic LC50 value was found to be 8.71 μg mL–1 (Fig. 1).
Fig. 1. Probit analysis. Probit analysis for the chronic LC50 determination of acephate. The observed mortality percentages were converted into probit values (represented by ‘y’ axis in graph), whereas graded concentrations of acephate were transformed into values in log10 scale (represented by ‘x’ axis in graph). Probit and log values were used to plot the graph which indicate 50% larval death in the log10 scale at 0.945, whose antilog is 8.71 μg mL–1 of acephate.
3.2. Acephate enhanced the activities of phase I and phase II detoxifying enzymes
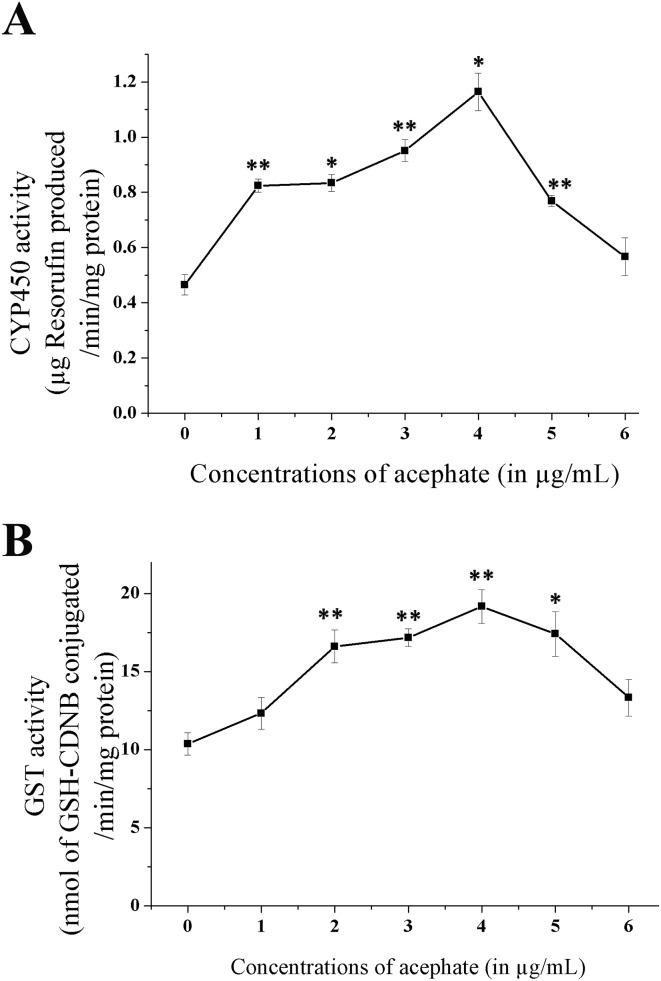
CYP450 1A1 (phase-I) and GST (phase-II) activities were significantly increased following chronic exposure to certain concentrations of acephate (Fig. 2; Table 1). The CYP450 activity was approximately three-fold higher (p < 0.05) at 4 μg mL–1 acephate than that of the control. A similar response was noticed in case of GST where the enzyme activity was enhanced by approximately two-fold (p < 0.01) at 4 μg mL–1.
Fig. 2. Changes in the enzyme activities of the phase-I and phase-II detoxification system. (A) CYP450 activity in the control and treated larvae. (B) GST activity in the control and treated groups. The data reflect mean ± S.E. *p < 0.05 and **p < 0.01 are ascribed as statistically significant.
Table 1. Activities/levels of detoxifying enzymes and selective oxidative stress markers in the larvae exposed to graded concentrations of acephate.
| Concentrations of acephate (μg mL–1) | CYP450 activity (μg of resorufin per min per mg protein) | GST activity (nM GSH-CDNB per min per mg protein) | SOD activity (units per min per mg protein) | Catalase activity (μM of H2O2 reduced per min per mg protein) | Lipid peroxidation (nM MDA per mg protein) | Protein carbonyl content (nM mg–1 protein) | HSP-70 expression (absorbance at 420 nm) |
| 0 | 0.465 ± 0.0368 | 10.37 ± 0.72 | 3.96 ± 0.30 | 305.07 ± 24.80 | 9.43 ± 1.6 | 4.74 ± 1.01 | 0.744 ± 0.056 |
| 1 | 0.824 ± 0.024** | 12.33 ± 1.01 | 5.95 ± 0.15** | 390.67 ± 23.14* | 12.35 ± 1.19 | 8.06 ± 0.92 | 0.921 ± 0.015 |
| 2 | 0.834 ± 0.031* | 16.61 ± 1.05** | 6.58 ± 0.47** | 503.27 ± 18.96** | 18.84 ± 0.9** | 10.13 ± 0.97* | 0.933 ± 0.03 |
| 3 | 0.951 ± 0.040** | 17.11 ± 0.57** | 6.79 ± 0.21** | 854.50 ± 74.75** | 20.11 ± 0.57** | 10.57 ± 1.45* | 0.998 ± 0.075* |
| 4 | 1.164 ± 0.0.068* | 19.17 ± 1.07** | 6.25 ± 0.29** | 919.55 ± 44.26** | 23.48 ± 2.24** | 10.59 ± 1.4* | 0.976 ± 0.08 |
| 5 | 0.769 ± 0.020** | 17.41 ± 1.43** | 4.03 ± 0.42 | 658.01 ± 54.17** | 24.89 ± 0.8** | 12.3 ± 1.17** | 1.089 ± 0.13* |
| 6 | 0.567 ± 0.069 | 13.33 ± 0.23 | 3.13 ± 0.22 | 626.19 ± 45.17** | 26.78 ± 0.34** | 12.99 ± 0.67** | 0.437 ± 0.018* |
Remarkably, there was a decline in CYP450 and GST activities at higher acephate concentrations (5 and 6 μg mL–1).
3.3. Increased activities/status of OS markers following acephate exposure
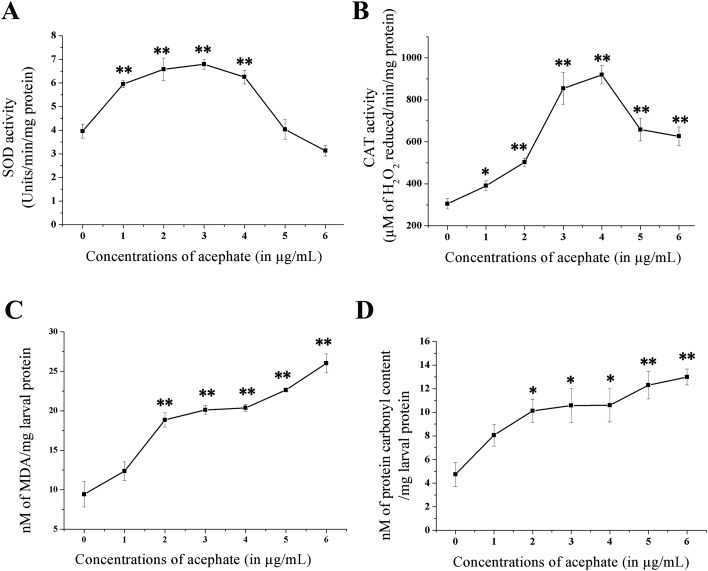
OS markers were significantly boosted in larvae after chronic exposure to acephate (Fig. 3; Table 1). Enhanced SOD activity was detected between 1–4 μg mL–1 acephate concentrations with the maximum at 3 μg mL–1 (p < 0.01). Similarly, CAT activity was three-fold higher (p < 0.01) after 4 μg mL–1 treatment in comparison with the control. The decline in the activities of both intracellular antioxidants was noticed at 5 and 6 μg mL–1 compared to 4 μg mL–1.
Fig. 3. Alterations in the activities of oxidative stress markers after chronic exposure to acephate. The figure represents (A) SOD activity; (B) CAT activity; (C) lipid peroxidation and (D) protein carbonyl contents in the control and treated groups. The data reflect mean ± S.E. *p < 0.05 and **p < 0.01 are ascribed as statistically significant.
The MDA content was almost three-fold higher (p < 0.01) at 6 μg mL–1 acephate concentration than that of the untreated group. Similar to this, the PC contents were also significantly increased (p < 0.05) at 2–6 μg mL–1 concentrations.
3.4. Acephate boosted the expression of the HSP-70 chaperon
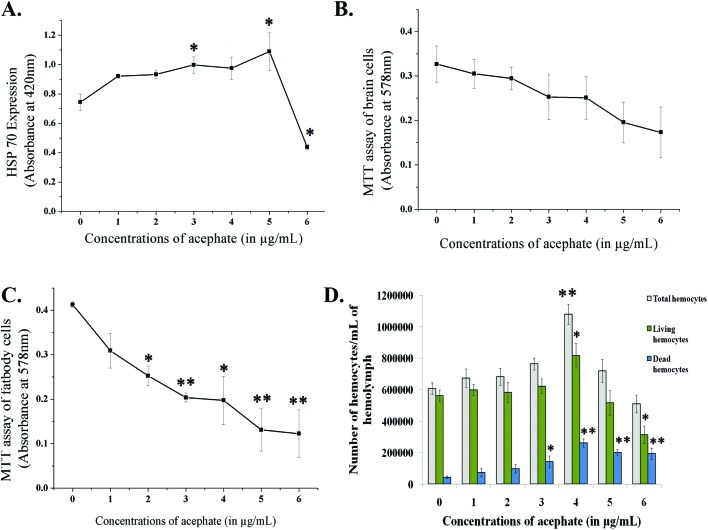
The expression of HSP-70 was examined through the ONPG assay. The expression of HSP-70 was increased upon treatment and was significant (p < 0.05) at 3 and 5 μg mL–1 concentrations. At 6 μg mL–1, the HSP-70 expression was reduced (Fig. 4A).
Fig. 4. Line diagram (A) represents the expression of the HSP-70 chaperone after chronic exposure to acephate. (B) and (C) Neural and fat body cell viability in the control and treatment groups. (D) Total hemocyte count and number of live and dead hemocytes for the control and treatment categories. *p < 0.05 and **p < 0.01 are considered as statistically significant.
3.5. Chronic exposure to acephate induced DNA damage
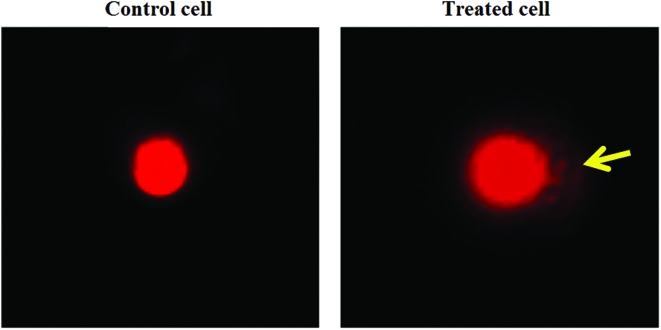
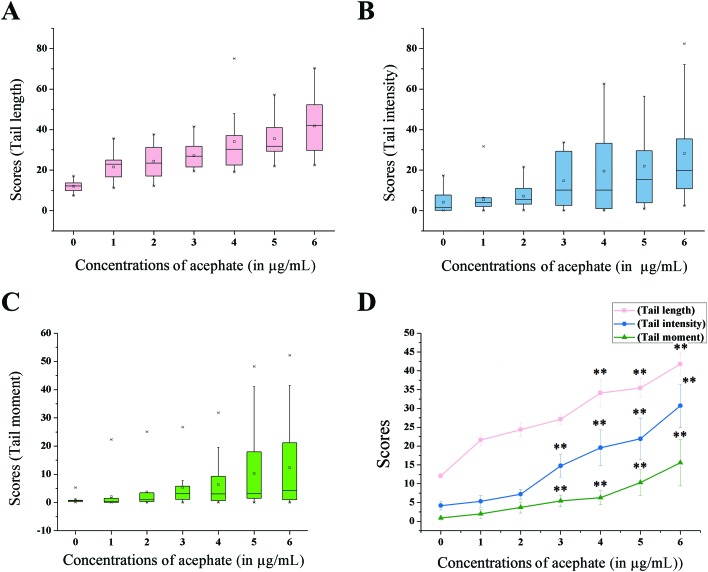
Tail length (TL), tail intensity (TI) and tail moment (TM) parameters were considered for the measurement of DNA damage in gut cells (Fig. 5 and 6).
Fig. 5. Gut cells after the comet assay. The control cell with no or negligible amount of fragmented DNA. The treated cell shows fragmented DNA in the form of a prominent comet tail.
Fig. 6. Tail length (TL), tail intensity (TI) and tail moment (TM) parameters for signifying DNA damage. The figure represents box plots for (A) TL, (B) TI and (C) TM parameters. Each box plot reflects the distribution of data indicating 25th and 75th percentile as box, median as a line within the box, maximum and minimum values as whiskers, ‘×’ as outliers and small square as mean. (D) Line diagram of all the parameters. The data specify mean ± S.E. *p < 0.05 or **p < 0.01 were considered as statistically significant.
The TL score was increased by more than three-fold (p < 0.01) at 6 μg mL–1 treatment compared to the control. Interestingly, an eight-fold (p < 0.01) increase in the TI score was observed in the larvae treated with 6 μg mL–1 acephate concentration. TM, another sensitive parameter, demonstrated a seventeen-fold (p < 0.01) increment at 6 μg mL–1 treatment concentration compared to the control category.
3.6. Acephate adversely affected the tissue/cellular components of the body
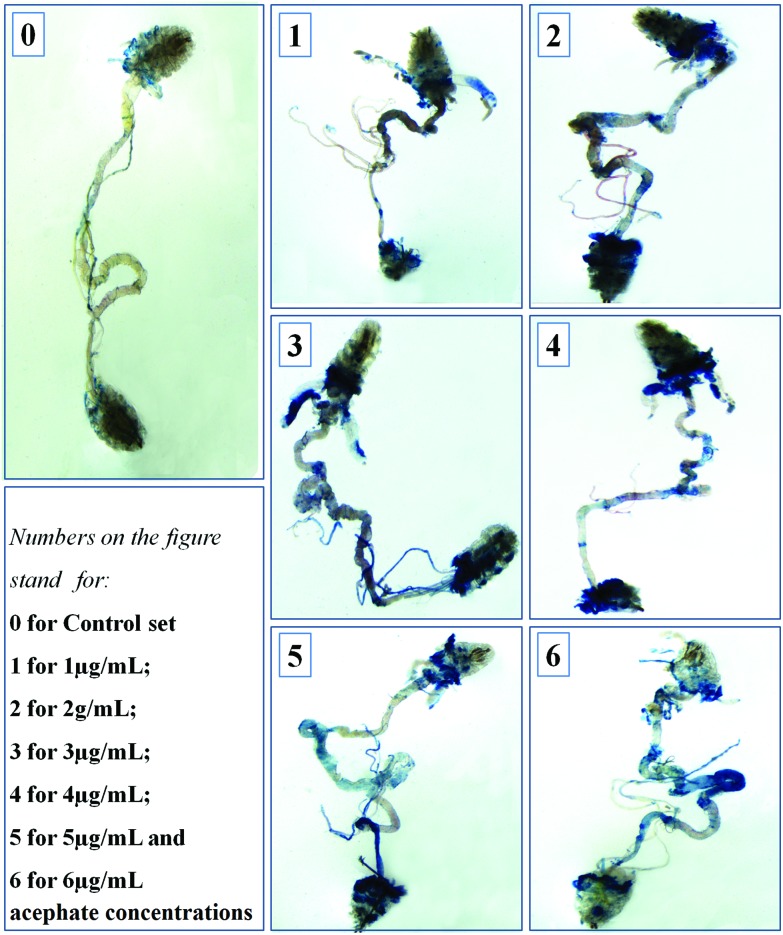
The larvae treated with 1 and 2 μg mL–1 acephate had noticeable blue patches in their salivary glands, midgut and hind gut in comparison with the control (with negligible blue patches). With the increase in treatment concentrations (3–6 μg mL–1), dead tissues were remarkably increased in the proventriculus, salivary glands, midgut, Malpighian tubules and hind gut (Fig. 7).
Fig. 7. Trypan blue (TB) staining of larval gut. The figure shows the TB-positive (damaged) areas of the treated larval gut. The control gut had negligible/no TB-positive lesion.
A dose-dependent diminution in neural and fat cell viability was detected upon acephate treatment (Fig. 4B and C). The mean absorbance for viable neural cells declined to almost half in the larvae treated with 6 μg mL–1 in comparison with the control. A similar decreasing trend was noticed in fat cells where the absorbance for live fat cells of the control (0.4125 ± 0.01) declined to 0.1225 ± 0.05 at 6 μg mL–1 concentration.
A bimodal response in the THC of the treated larvae was noted (Fig. 4D). The THC of the larvae exposed to 1–4 μg mL–1 of acephate was (p < 0.01 at 4 μg mL–1) increased (1 080 000 ± 63 600 hemocytes per mL of hemolymph at 4 μg mL–1) in sharp contrast to the control group (607 500 ± 37 500 hemocytes per mL of hemolymph). Interestingly, 5 and 6 μg mL–1 acephate treatment caused a decline in the THC to 720 000 ± 72 500 and 510 000 ± 56 100 hemocytes per mL of hemolymph, respectively.
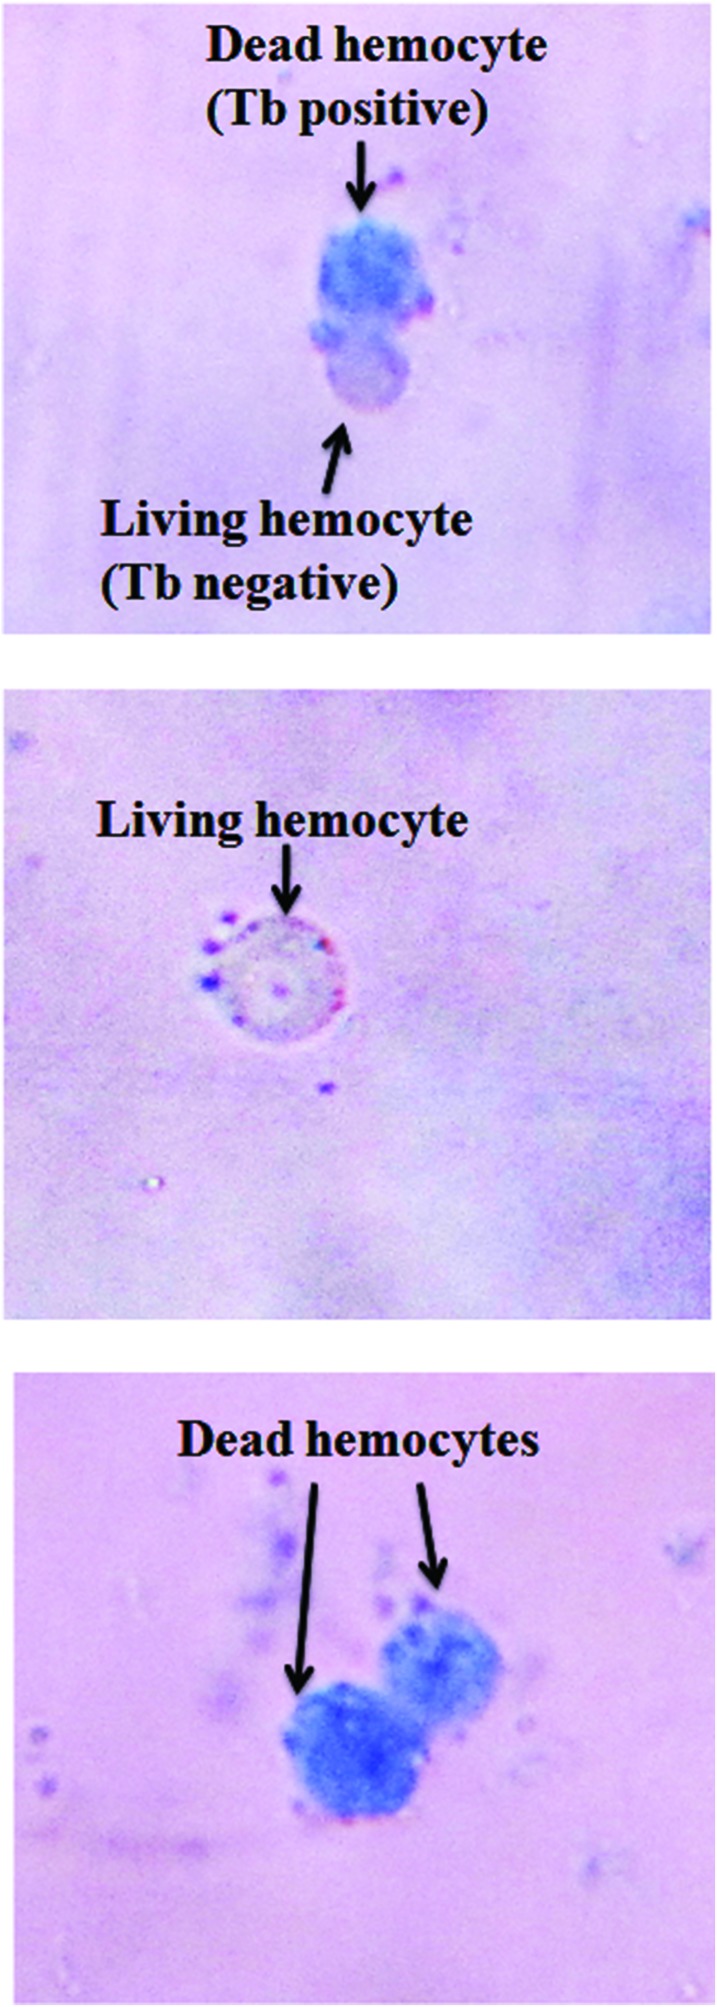
A dose-dependent increase in hemocyte mortality (Fig. 4D and Fig. 8) was observed. In contrast to the control, a four-fold increase (p < 0.01) in the number of dead hemocytes was seen at 6 μg mL–1 treatment.
Fig. 8. Hemocytes stained with trypan blue. The figure shows trypan blue positive (dead) and negative (living) hemocytes.
3.7. Acephate induced eye deformities
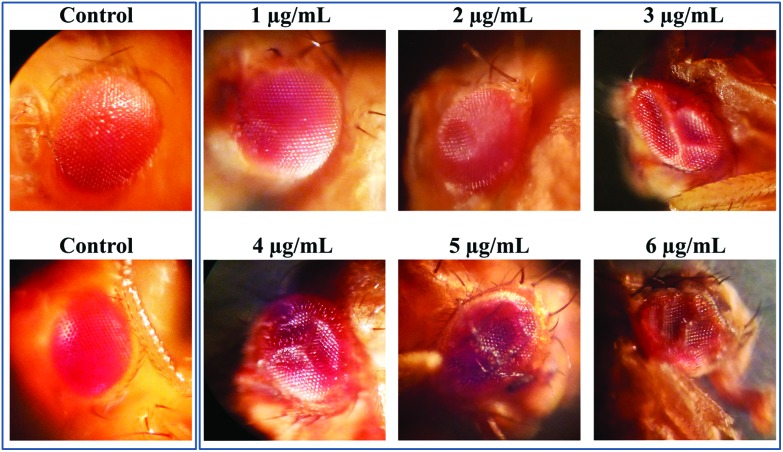
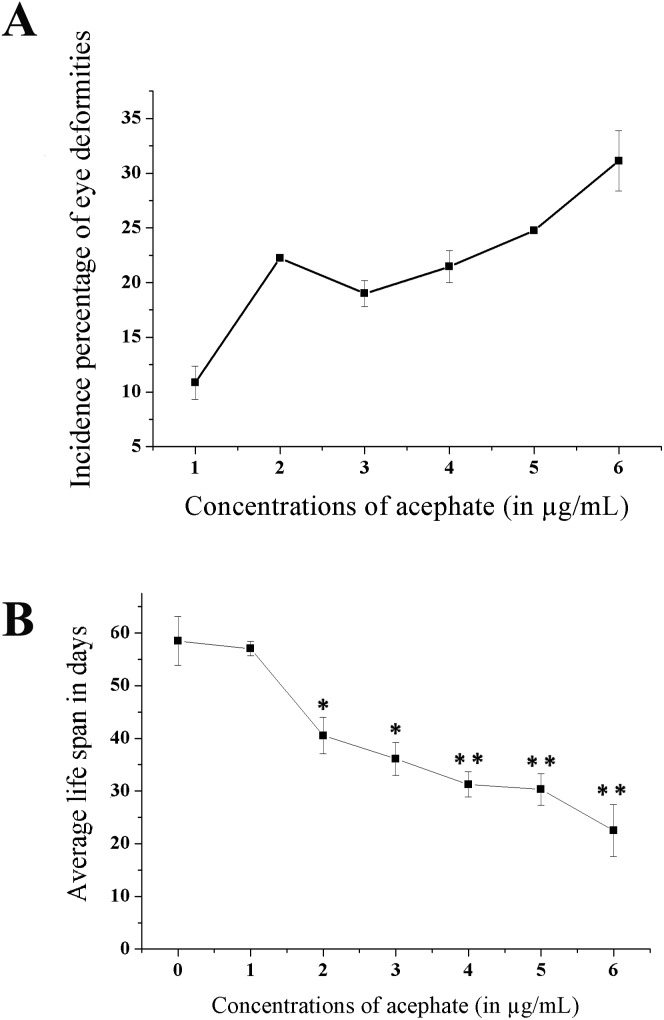
A prominent ocular malformation was detected in some flies after chronic acephate exposure (Fig. 9). The control flies manifested phenotypically normal eyes with well-organized ommatidia and evenly distributed mechanosensory bristles. Treatment resulted in a disorganized ommatidial architecture with a disoriented bristle arrangement. Moreover, an increase in the incidence percentage of flies having ocular malformation was recorded in the treated individuals (Fig. 10A).
Fig. 9. Deformed adult eyes. The photograph clearly shows deformities in the compound eyes of the treated insects with contrast to the well-organized eye architecture in the control counterparts.
Fig. 10. Incidence percentage of eye deformities. Line diagrams showing (A) the incidence percentage of eyes deformities and (B) reduced life span in the treated categories. The data represents mean ± S.E. *p < 0.05 or **p < 0.01 were considered as statistically significant.
3.8. Apoptotic lesions in eye imaginal discs (EDs)
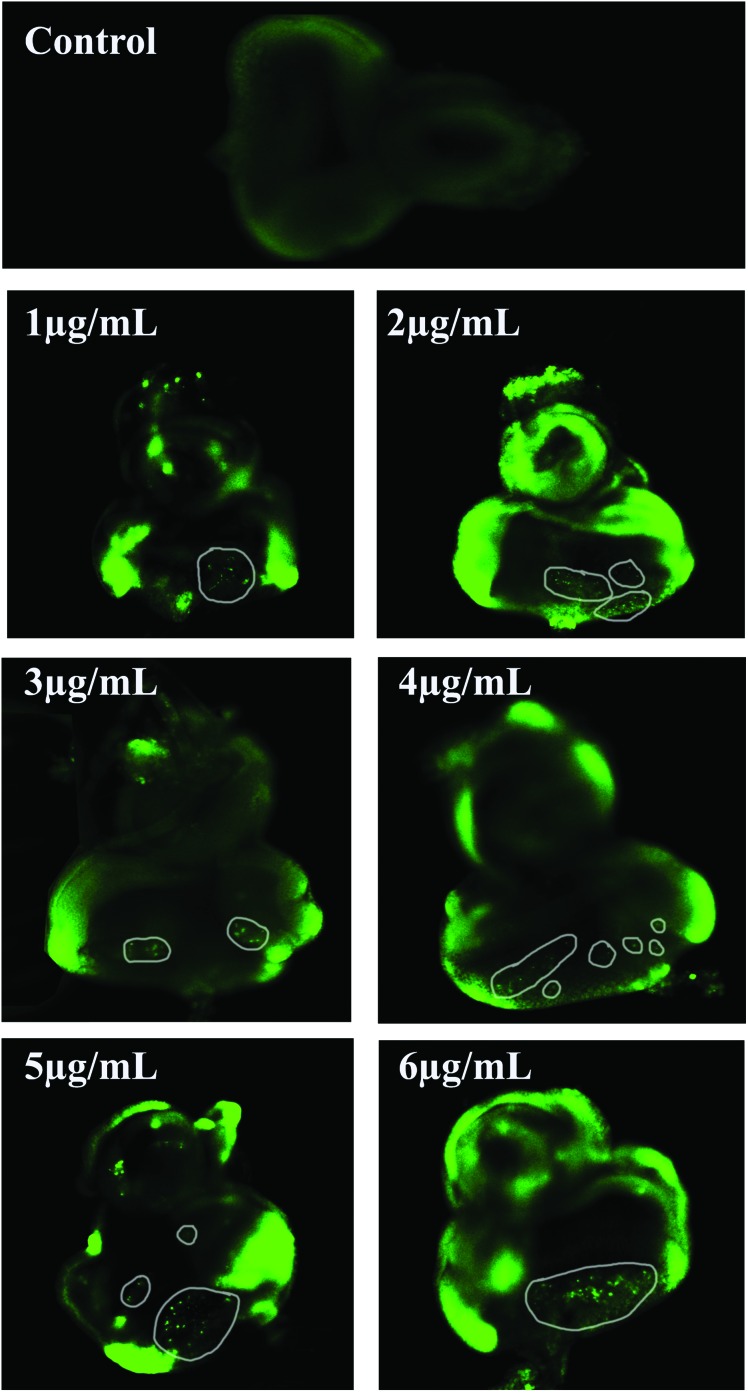
The EDs of the control and treated 3rd instar larvae were dissected and examined for apoptotic lesions. No fluorescent green spots/apoptotic bodies were visible in the EDs of the untreated larvae. In contrast, increased apoptotic lesions were apparent in the EDs of the treated larvae (Fig. 11).
Fig. 11. Acridine orange staining of the eye imaginal discs. The photograph shows apoptotic lesions (encircled prominent green spots) in the eye imaginal discs of the acephate exposed larvae in comparison with the control set (without any prominent spot).
3.9. Acephate affected the physical activities and reduced the life span of the organism
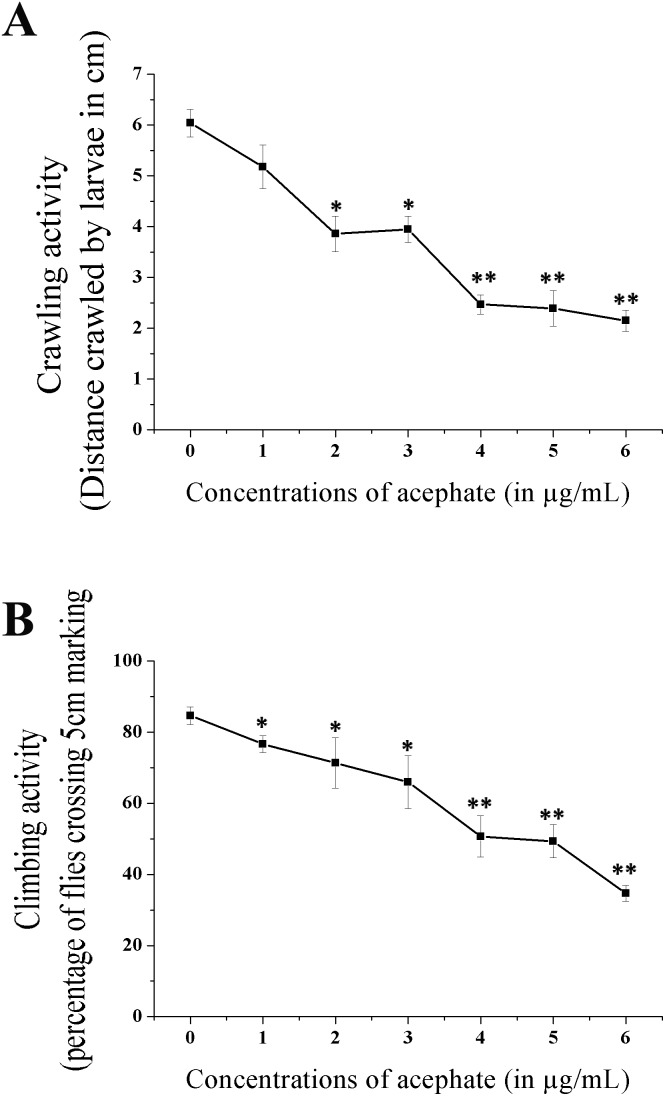
The crawling and climbing activities of the treated larvae and adults were considerably reduced (Fig. 12). The larvae reared at 6 μg mL–1 acephate demonstrated a three-fold (p < 0.01) reduction in the crawling activity compared to the control.
Fig. 12. Physical activities of larvae and adult flies. (A) Crawling activity of the treated larvae. (B) Climbing activity in the treated adult flies. The data indicate mean ± S.E. *p < 0.05 and **p < 0.01 were considered as statistically significant.
Similarly, compared to the control set, more than two-fold decline (significant at p < 0.01) in the climbing activity of adults was noted following 6 μg mL–1 acephate exposure.
The longevity of the flies (Fig. 10B) was shortened significantly following chronic exposure to acephate. The control flies survived for an average duration of 58.4 ± 4.66 days compared to only 22.5 ± 4.96 days (p < 0.01) of the flies treated with 6 μg mL–1 acephate.
4. Discussion
The present extensive work indicated ROS mediated hazards of acephate (chronic sub-lethal exposure) at organismal and sub-organismal levels in a non-target organism, Drosophila melanogaster.
The study commenced with the evaluation of the chronic LC50 value of acephate in the larvae of D. melanogaster. The probit analysis of the data indicated the LC50 value to be 8.71 μg mL–1. Based on this finding, six sub-lethal concentrations ranging from 1–6 μg mL–1 were selected for the toxicity assessment of acephate in fruit fly.
Phase-I and phase-II enzymes play a fundamental role in the metabolism, elimination and detoxification of xenobiotics. CYP450 1A1 catalyzes the oxidation reaction of xenobiotics such as pesticides to convert them into more active hydroxylated metabolites by adding or unmasking polar groups.46 The action of CYP450 proceeds through the reduction of cytochrome-bound oxygen and the generation of reactive oxygen species.47 GST conjugates glutathione to a phase-I metabolite via a SH linkage to transform it into a more hydrophilic compound. After the sequential cleavage of glutamate and glycine residues, the cysteine residue of glutathione along with acetate remains attached with the conjugate to facilitate its easy removal from the body.48 In the present study, an almost 2-fold increase in the activities of these two enzymes confirms the active state of the phase-I and phase-II detoxification system. But surprisingly, the reduction in CYP450 and GST activities at 5 and 6 μg mL–1 concentration might have resulted from excess cell mortality at these concentrations.
The increased activities of intrinsic antioxidant enzymes like SOD and CAT also confirmed ROS production in the sub-cellular environment. These two endogenous antioxidants constitute the first line of defense against free radical mediated injury.49 SOD catalyzes the dis-mutation of superoxide anions (O2˙–) to produce H2O2 which in turn decomposes to water and oxygen by CAT activity.50 In the present study, a several fold increase in SOD and CAT activities was observed. This might be required to scavenge reactive radicals and therefore to block ROS-mediated damages to cellular macromolecules in the treated larvae. Interestingly, the decline in SOD and CAT activity after 5 and 6 μg mL–1 acephate exposure might be due to increased cellular mortality that reduced the availability of functional enzymes.
In order to confirm ROS production within the acephate treated larvae, the MDA and PC contents (markers of ROS) were estimated in tissue homogenates. MDA is the major end product in the free radical mediated lipid peroxidation of cell and mitochondrial membrane.51 In comparison with the control set, the MDA levels were several fold higher (∼2.8-fold at 6 μg mL–1) in the acephate treated larvae. Since lipid peroxidation damages biological membranes, premature cell death was obvious in various tissues. Another important marker of ROS is the PC content within tissues.52 ROS oxidizes functional proteins and exposes carbonyl groups (CO) on the side chains of proline, arginine, lysine and threonine residues.38 These chemical configurations are chemically stable and are promising indicators of ROS.53 In this study, almost 3-fold rise in PC content was recorded in larvae after 6 μg mL–1 acephate treatment. Such oxidation may destroy vital cellular proteins, whose unavailability might be responsible for increased cell death.
Oxidative stress (OS) provokes partial unfolding and aggregations of cellular proteins.54 HSP-70, a major chaperon, temporarily binds to the hydrophobic regions of partially folded proteins, allows their refolding and prevents their aggregation,55 thereby helping to maintain cellular-protein homeostasis.56 In the present study, the HSP-70 level was 1.2–1.5-fold higher after chronic treatment with 1–5 μg mL–1 acephate. ROS-induced unfolding and aggregation of proteins57 might have increased HSP-70 expression to resist protein denaturation. But the decline in HSP-70 expression at 6 μg mL–1 treatment might be due to the reduction in the availability of viable cells expressing HSP-70.
ROS induces DNA damage in the form of single or double strand breaks, DNA cross-linking and base modifications.58 Chronic OS causes chromosomal instability, genetic mutations and cell growth alteration that may progress towards cancer.59 MDA, a by-product of ROS, forms several bio-molecular adducts that cause DNA damage and mutagenesis.60 In this study, chronic acephate exposure resulted in DNA fragmentation. TL, TI and TM were found to be ∼3.4-, ∼7.3- and ∼17.5-fold higher in the treated groups, respectively, that suggests genotoxicity. ROS generation, which is already confirmed in this study, might be responsible for DNA breaks in the treated larvae.
The study was continued with the analysis of toxicity at tissue and cellular levels. Gut is the first tissue that has to confront all kinds of xenobiotics entering through the oral route. A concentration-dependent increase in tissue damage was noticed in several parts of the alimentary tract like salivary glands, proventriculus, midgut, hind gut and Malpighian tubules. The cell survivability assay for fat body and brain ganglia revealed premature cell death following chronic exposure to acephate. ROS stabilizes and activates the tumor suppressor protein Dmp5361,62 which promotes the transcriptional activation of a pro-apoptotic gene Reaper (rpr).63 Rpr upregulates initiator (DRONC) and effecter (DRICE) caspases in Drosophila to induce apoptosis.64 In addition, a Drosophila inhibitor of the apoptosis protein (DIAP1) that may hinder cell death via direct binding to caspases65 can be negatively regulated by rpr.66 ROS catalyses the irreversible oxidative modification of the lipid bilayer of cellular and mitochondrial membranes which destabilizes their selective permeability.67 Therefore it might be suggested that these individual mechanisms synergistically played a significant role in the generation of ROS (confirmed through the analysis of several parameters like MDA and PC) and subsequently caused cell/tissue damage.
Hemocytes are the key players of the innate immune system in D. melanogaster. Hemocytes play a decisive role in maintaining a healthy immunity through their fight against bacterial and fungal intruders.68 Here THC was increased after chronic acephate treatment. A related observation was reported in another study where monocrotophos treatment increased THC in Rhynocoris kumarii.69 Moreover, hemocyte mortality was much higher in the acephate treated larvae. Such results can be explained in light of apoptosis induced proliferation (AiP), which is a molecular mechanism by which dying cells induce the proliferation of surviving cells, just to compensate for the cell loss.70 To execute AiP, hemocytes secrete a TNF ortholog Eiger to activate a moderate level of JNK that induces an inflammatory response causing mitogen based cell proliferation.71 The larvae exposed to 5 and 6 μg mL–1 acephate manifested a decline in THC. Such a response might be due to increased ROS in mature and precursor hemocytes leading to premature cell death.
Organophosphates are known for developmental and embryo-toxic impacts on organisms.72,73 Hence, the treated individuals were examined for any developmental anomaly in their adult body structures. Interestingly, the normal ommatidial arrangement of the compound eyes was disrupted in the treated flies. Prominent grooves and ridges observed under 100× magnification were similar to the findings on cryolite exposure in Drosophila.74 An acephate-induced teratogenic effect is also evident in mice as skeletal malformation.75
Since the development of the compound eye commences from the 3rd instar larval stage, the eye imaginal discs of the treated larvae were examined. AO staining revealed a dose-dependent increase in apoptotic lesions in the eye imaginal discs. This validates the fact that acephate induced cell death in the eye discs resulted in a deformed ommatidial architecture in adults.
Organophosphates disrupt neuro-muscular co-ordination through the non-reversible phosphorylation of esterases in both sensory and motor neurons.76,77 This might have reduced the physical activities in both larvae and adults. Additionally, tissue injuries in the internal organs might have contributed to the sluggish behavior of the treated individuals.
Acephate was tested for its effect on the longevity of flies. Similar to another finding,78 our result indicated a reduced life span of the treated adults. The survival duration was shortened to almost half at 6 μg mL–1. Such a response might be a product of the injured internal body systems of the treated adults that shortened their life span to a significant level. Organophosphate induced cellular necrosis in vital organs79 might be responsible for the early mortality of adults.
5. Conclusion
Chronic acephate exposure exerts hazardous impacts in Drosophila melanogaster at organismal and sub-organism levels. The findings of the study suggest that besides traditional cholinesterase inhibition, acephate may promote ROS production in various tissues that trigger DNA, protein and cell damage. The resultant impacts of ROS at molecular and cellular levels may proceed onto the organismal level to generate developmental anomalies, physical inabilities and shortened life span in organisms that underwent intentional/unintentional exposure to acephate (Fig. 13). Therefore it is our hypothesis that ROS may play a crucial role in acephate induced injuries at organismal and sub-organismal levels of Drosophila melanogaster. Furthermore, the outcomes of exposure assessment in Drosophila can be extrapolated to other non-target organisms including human beings because of their developmental and physiological homologies. Additionally, this work further establishes Drosophila melanogaster as a successful model organism in the toxicological assessment of chemicals, food additives and environmental contaminants.
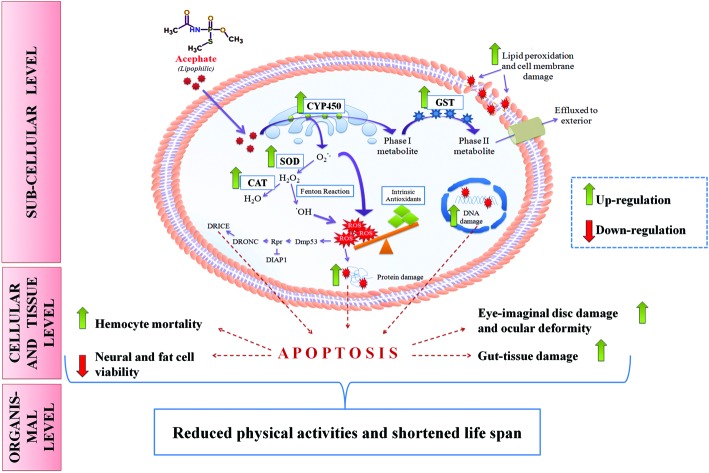
Fig. 13. Putative mechanism of acephate toxicity (ROS-mediated) in Drosophila melanogaster. Lipophilic acephate can easily penetrate the plasma membrane to enter the cell. CYP450 on the endoplasmic reticulum (ER) oxidizes acephate into a phase-I metabolite which transforms into a phase-II metabolite in the cytosol by GST activity. Oxidation of acephate in the ER liberates excessive superoxide anion (O2˙–) which can be converted into H2O2 by SOD. H2O2 may undergo two fates: one includes its breakdown to H2O while another comprises its conversion into a more reactive hydroxyl (˙OH) radical. ROS in the form of O2˙– and ˙OH can overwhelm the intrinsic antioxidant system of the body and can induce oxidative stress. ROS can damage proteins, DNA and lipid moieties of the cell membrane. Additionally, ROS may trigger the Dmp53-rpr mediated apoptotic cascade (see the text for details) at the sub-cellular level. Increased cell death results in tissue/organ damage that reduces the physical activities and life span of the organism.
Conflicts of interest
There is no known conflict of interest.
Acknowledgments
We thank the Head, DST-FIST, UGC-DRS, DST-PURSE sponsored Department of Zoology, Burdwan University (BU) for infrastructural facilities. The authors are indebted to Prof. Abhijit Mazumdar (BU) and Dr Niladri Hazra (BU) for providing environmental chambers. Dr Sanjib Ray, BU is acknowledged for providing chemicals like EtBr, AO and MTT as gift.
References
- Miller G. T., Sustaining the Earth: An Integrated Approach, Thomson/Brooks/Cole, 2004, pp. 211–216. ISBN 978-0-534-40088-0. [Google Scholar]
- Yang Y., Hou L., Li Y., Ni J., Liu L. Cell Death Dis. 2013;4:e723. doi: 10.1038/cddis.2013.232. [DOI] [PMC free article] [PubMed] [Google Scholar]
- Das P., Shaik A. P., Jamil K. Int. J. Toxicol. 2008;5:313–322. [Google Scholar]
- Bouchard M., Carrier G., Brunet R. C., Dumas P., Noisel N. W. Ann. Occup. Hyg. 2006;50:505–515. doi: 10.1093/annhyg/mel005. [DOI] [PubMed] [Google Scholar]
- Spassova D., White T., Singh A. K. Endocrinology. 2000;126:79–89. doi: 10.1016/s0742-8413(00)00097-9. [DOI] [PubMed] [Google Scholar]
- Rahman M. F., Mahboob M., Danadevi K., Saleha Banu B., Grover P. Mutat. Res., Genet. Toxicol. Environ. Mutagen. 2002;516:139–147. doi: 10.1016/s1383-5718(02)00033-5. [DOI] [PubMed] [Google Scholar]
- Özkan D., Yüzbaşıoğlu D., Ünal F., Yılmaz S., Aksoy H. Cytotechnology. 2009;59:73–80. doi: 10.1007/s10616-009-9195-y. [DOI] [PMC free article] [PubMed] [Google Scholar]
- Thamali Dhanushka M. A., Peiris L. D. C., J. Toxicol., 2017, 2017 , , 3874817 . [DOI] [PMC free article] [PubMed] [Google Scholar]
- Datta S., Dhar P., Mukherjee A., Ghosh S. Food Chem. Toxicol. 2010;48:2766–2771. doi: 10.1016/j.fct.2010.07.004. [DOI] [PubMed] [Google Scholar]
- Hao D. F., Xu W., Wang H., Du L. F., Yang J. D., Zhao X. J., Sun C. H. Ecotoxicol. Environ. Saf. 2012;83:25–33. doi: 10.1016/j.ecoenv.2012.06.006. [DOI] [PubMed] [Google Scholar]
- Farag A. T., Eweidah M. H., El-Okazy A. M. Reprod. Toxicol. 2000;14:457–462. doi: 10.1016/s0890-6238(00)00094-0. [DOI] [PubMed] [Google Scholar]
- Briggs S. A., Basic Guide to Pesticides: Their Characteristics and Hazards, Hemisphere Publishing Corp., Washington, Philadelphia, London,1992. [Google Scholar]
- Hallenbeck W. H. and Cunningham-Burns K. M., Pesticides and Human Health, Springer-Verlag, New York, Berlin, Heidelberg and Tokyo, 1985. [Google Scholar]
- Roberts T. R. and Hutson D. H., Acephate, in Metabolic Pathways of Agrochemicals—Part 2: Insecticides and Fungicides, The Royal Society of Chemistry, Cambridge, UK, 1999, pp. 201–204. [Google Scholar]
- Roberto P. L., TrevizanI P. L. R., BaptistaI G. C. de., Papa G. Hortic. Bras. 2005;23:38–43. [Google Scholar]
- Mohapatra S., Ahuja A. K., Deepa M. Bull. Environ. Contam. Toxicol. 2011;86:101–104. doi: 10.1007/s00128-010-0154-2. [DOI] [PubMed] [Google Scholar]
- Dasika R., Tangirala S., Naishadham P. J. Environ. Chem. Ecotoxicol. 2012;4:19–28. [Google Scholar]
- Fiedler L. Bull. Environ. Contam. Toxicol. 1987;38:594–601. doi: 10.1007/BF01608591. [DOI] [PubMed] [Google Scholar]
- Gavit P. J., Patil R. D. J. Entomol. Zool. Stud. 2016;4:1364–1366. [Google Scholar]
- Zinkl J. G., Roberts R. B., Henry C. J., Lenhart D. J. Bull. Environ. Contam. Toxicol. 1980;24:676–683. doi: 10.1007/BF01608173. [DOI] [PubMed] [Google Scholar]
- Behera B. C., Bhunya S. P. Mutat. Res., Genet. Toxicol. Environ. Mutagen. 1989;223:287–293. doi: 10.1016/0165-1218(89)90121-3. [DOI] [PubMed] [Google Scholar]
- Gupta P. K., Moretto A., J. Med. Plants Res., 2005. , 3 –16 , http://apps.who.int/pesticide-residues-jmpr-database/Document/142 . [Google Scholar]
- Pandey U. B., Nichols C. D. Pharmacol. Rev. 2011;63:411–436. doi: 10.1124/pr.110.003293. [DOI] [PMC free article] [PubMed] [Google Scholar]
- Demir E., Turna F., Vales G., Kaya B., Creus A., Marcos R. Chemosphere. 2013;93:2304–2310. doi: 10.1016/j.chemosphere.2013.08.022. [DOI] [PubMed] [Google Scholar]
- Koh K., Evans J. M., Hendricks J. C., Sehagal A. Proc. Natl. Acad. Sci. U. S. A. 2006;103:13843–13847. doi: 10.1073/pnas.0605903103. [DOI] [PMC free article] [PubMed] [Google Scholar]
- Rajak P., Dutta M., Khatun S., Mandi M. J. Hazard. Mater. 2017;321:690–702. doi: 10.1016/j.jhazmat.2016.09.067. [DOI] [PubMed] [Google Scholar]
- Siddique H. R., Chowdhur D. K., Saxena D. K., Dhawan A. Mutagenesis. 2005;20:285–290. doi: 10.1093/mutage/gei032. [DOI] [PubMed] [Google Scholar]
- Klaverkamp J. F., Hobden B. R. Can. J. Fish Aquat. Sci. 1980;37:1450–1453. [Google Scholar]
- Martin W. R., Brown T. M. Entomol. Exp. Appl. 1984;35:3–9. [Google Scholar]
- Rajak P., Sahana S., Roy S. Toxicol. Environ. Chem. 2013;95:1369–1379. [Google Scholar]
- Rajak P., Dutta M., Roy S. Interdiscip. Toxicol. 2015;8:84–88. doi: 10.1515/intox-2015-0013. [DOI] [PMC free article] [PubMed] [Google Scholar]
- Klotz A. V., Stegeman J. J., Walsh C. Anal. Biochem. 1984;140:138–145. doi: 10.1016/0003-2697(84)90144-1. [DOI] [PubMed] [Google Scholar]
- Habig W. H., Pabst M. J., Jakoby W. B. J. Biol. Chem. 1974;249:7130–7139. [PubMed] [Google Scholar]
- Lowry O. H., Rosebrough N. J., Farr A. L., Randall R. J. J. Biol. Chem. 1951;193:265–275. [PubMed] [Google Scholar]
- Nishikimi M., Rao N. A., Yagi K. Biochem. Biophys. Res. Commun. 1972;48:849–854. doi: 10.1016/s0006-291x(72)80218-3. [DOI] [PubMed] [Google Scholar]
- Sinha A. K. Anal. Biochem. 1972;47:389–394. doi: 10.1016/0003-2697(72)90132-7. [DOI] [PubMed] [Google Scholar]
- Ohkawa H., Ohishi N., Yagi K. Anal. Biochem. 1979;95:351–358. doi: 10.1016/0003-2697(79)90738-3. [DOI] [PubMed] [Google Scholar]
- Dalle-Donne I., Rossi R., Giustarini D., Milzani A., Colombo R. Clin. Chim. Acta. 2003;329:23–38. doi: 10.1016/s0009-8981(03)00003-2. [DOI] [PubMed] [Google Scholar]
- Stringham E. G., Candido E. P. M. Environ. Toxicol. Chem. 1994;13:1211–1220. [Google Scholar]
- Dhawan A., Bajpayee M., Parmar D. Cell Biol. Toxicol. 2009;25:5–32. doi: 10.1007/s10565-008-9072-z. [DOI] [PubMed] [Google Scholar]
- Krebs R. A., Feder M. E. J. Exp. Biol. 1997;200:2007–2015. doi: 10.1242/jeb.200.14.2007. [DOI] [PubMed] [Google Scholar]
- Babot Z., Cristofol R., Sunol C. Eur. J. Neurosci. 2005;21:103–112. doi: 10.1111/j.1460-9568.2004.03848.x. [DOI] [PubMed] [Google Scholar]
- Alone D. P., Tiwari A. K., Mandal L., Li M., Mechler B. M., Roy J. K. Int. J. Dev. Biol. 2005;49:873–879. doi: 10.1387/ijdb.051986da. [DOI] [PubMed] [Google Scholar]
- Prakash V. S., Krishna M. S. Int. J. Recent Sci. Res. 2015;6:4656–4660. [Google Scholar]
- Feany M. B., Bender W. W. Nature. 2000;404:394–398. doi: 10.1038/35006074. [DOI] [PubMed] [Google Scholar]
- Guengerich F. P. Chem. Res. Toxicol. 2001;14:611–650. doi: 10.1021/tx0002583. [DOI] [PubMed] [Google Scholar]
- Schlichting I., Berendzen J., Chu K., Stock A. M., Maves S. A., Benson D. E., Sweet B. M., Ringe D., Petsko G. A., Sligar S. G. Science. 2000;287:1615–1622. doi: 10.1126/science.287.5458.1615. [DOI] [PubMed] [Google Scholar]
- Commandeur J. N., Stijntjes G. J., Vermeulen N. P. Pharmacol. Rev. 1995;47:271–330. [PubMed] [Google Scholar]
- Lobo V., Patil A., Phatak A., Chandra N. Pharmacogn. Rev. 2010;4:118–126. doi: 10.4103/0973-7847.70902. [DOI] [PMC free article] [PubMed] [Google Scholar]
- Mansour S. A., Mossa A. H. Pestic. Biochem. Physiol. 2009;93:34–39. [Google Scholar]
- Schneider C., Boeglin W. E., Yin H., Porter N. A., Brash A. R. Chem. Res. Toxicol. 2008;21:895–903. doi: 10.1021/tx700357u. [DOI] [PubMed] [Google Scholar]
- Beal M. F. Free Radicals Biol. Med. 2002;32:797–803. doi: 10.1016/s0891-5849(02)00780-3. [DOI] [PubMed] [Google Scholar]
- Beal M. F. Free Radicals Biol. Med. 2002;32:797–803. doi: 10.1016/s0891-5849(02)00780-3. [DOI] [PubMed] [Google Scholar]
- Weids A. J., Ibstedt S., Thamas M. J., Grant C. M. Sci. Rep. 2016;6:24554. doi: 10.1038/srep24554. [DOI] [PMC free article] [PubMed] [Google Scholar]
- Liberek K., Lewandowska A., Zietkiewicz S. EMBO J. 2008;27:328–335. doi: 10.1038/sj.emboj.7601970. [DOI] [PMC free article] [PubMed] [Google Scholar]
- Proctor C. J., Lorimer I. A. J. PLoS One. 2011;6:e22038. doi: 10.1371/journal.pone.0022038. [DOI] [PMC free article] [PubMed] [Google Scholar]
- Kim C. H., Jeon H. M., Lee S. Y., Jeong E. K., Ju M. K., Park B. J., Park H. G., Lim S. C., Han S. I., Kang H. S. Int. J. Oncol. 2010;37:97–102. doi: 10.3892/ijo_00000657. [DOI] [PubMed] [Google Scholar]
- Marnett M. J. Carcinogenesis. 2000;21:361–370. doi: 10.1093/carcin/21.3.361. [DOI] [PubMed] [Google Scholar]
- Klaunig J. E., Kamendulis L. M., Hocevar B. A. Toxicol. Pathol. 2010;38:96–109. doi: 10.1177/0192623309356453. [DOI] [PubMed] [Google Scholar]
- Ayala A., Munoz M. F., Argueles S. Oxid. Med. Cell longevity. 2014;2014:360438. doi: 10.1155/2014/360438. [DOI] [PMC free article] [PubMed] [Google Scholar]
- Yin Y., Terauchi Y., Solomon G. G., Aizawa S., Rangarajan P. N., Yazaki Y., Kadowaki T., Barrett J. C. Nature. 1998;391:707–710. doi: 10.1038/35648. [DOI] [PubMed] [Google Scholar]
- Brodsky M. H., Nordstrom W., Tsang G., Kwan E., Rubin G. M., Abrams J. M. Cell. 2000;101:103–113. doi: 10.1016/S0092-8674(00)80627-3. [DOI] [PubMed] [Google Scholar]
- Morey M., Corominas M., Serras F. J. Cell Sci. 2003;116:4597–4604. doi: 10.1242/jcs.00783. [DOI] [PubMed] [Google Scholar]
- Fraser A. G., Evan G. I. EMBO J. 1997;16:2805–2813. doi: 10.1093/emboj/16.10.2805. [DOI] [PMC free article] [PubMed] [Google Scholar]
- Hay B. A. Cell Death Differ. 2000;7:1045–1056. doi: 10.1038/sj.cdd.4400765. [DOI] [PubMed] [Google Scholar]
- Goyal L., McCall K., Agapite J., Hartwieg E., Steller H. EMBO J. 2000;19:589–597. doi: 10.1093/emboj/19.4.589. [DOI] [PMC free article] [PubMed] [Google Scholar]
- Gaschler M. M., Stockwell B. R. Biochem Biophys Res Commun. 2017;482:419–425. doi: 10.1016/j.bbrc.2016.10.086. [DOI] [PMC free article] [PubMed] [Google Scholar]
- Lemaitre B., Hoffmann J. Annu. Rev. Immunol. 2007;25:697–743. doi: 10.1146/annurev.immunol.25.022106.141615. [DOI] [PubMed] [Google Scholar]
- Edward George P. J., Ambrose D. P. J. Appl. Entomol. 2004;128:600–604. [Google Scholar]
- Fan Y., Bergmann A. Trends Cell Biol. 2008;18:467–473. doi: 10.1016/j.tcb.2008.08.001. [DOI] [PMC free article] [PubMed] [Google Scholar]
- Fogarty C. E., Diwanji N., Lindblad J. L., Tare M., Amcheslavsky A., Makhijani K., Fan K. Y., Bergmann A. Curr. Biol. 2016;26:575–584. doi: 10.1016/j.cub.2015.12.064. [DOI] [PMC free article] [PubMed] [Google Scholar]
- Berlinska B., Sitarek K. Rocz. Panstw. Zakl. Hig. 1997;48:217–228. [PubMed] [Google Scholar]
- Astroff A. B., Young A. D. Toxicol. Ind. Health. 1998;14:869–889. doi: 10.1177/074823379801400608. [DOI] [PubMed] [Google Scholar]
- Podder S., Akbari S., Roy S. Fluoride. 2012;45:58–64. [Google Scholar]
- Farag A. T., Eweidah M. H., Tayel S. M., El-sebae A. H. Reprod. Toxicol. 2000;14:241–245. doi: 10.1016/s0890-6238(00)00074-5. [DOI] [PubMed] [Google Scholar]
- Aldridge W. N. and Reiner E., Acylated amino acids in inhibited B-esterases, in Enzyme Inhibitors as Substrates, ed. A. Neuberger and E. L. Tatum, North-Holland Publishing Company, Amsterdam, 1972, pp. 170–175. [Google Scholar]
- Bajgar J. Adv. Clin. Chem. 2004;38:151–216. doi: 10.1016/s0065-2423(04)38006-6. [DOI] [PubMed] [Google Scholar]
- Sharma A., Mishra M., Shukla A. K., Kumar R., Abdin M. Z., Chowdhuri D. K. J. Hazard. Mater. 2012;221–222:275–287. doi: 10.1016/j.jhazmat.2012.04.045. [DOI] [PubMed] [Google Scholar]
- Poovala V. S., Huang H., Salahudeen A. K. J. Am. Soc. Nephrol. 1999;10:1746–1752. doi: 10.1681/ASN.V1081746. [DOI] [PubMed] [Google Scholar]


