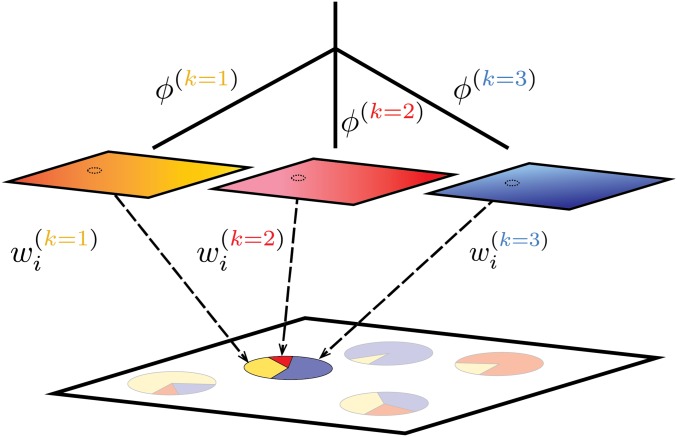
Figure 1.
Schematic of our method, using as an example. Spatial autocorrelation of allele frequencies within each layer is depicted by color gradients, and denotes the covariance shared by samples with ancestry entirely in the kth layer. Sampled populations on the landscape are inferred to be admixed between these layers; the ith sample draws proportion of its ancestry from layer k. For convenience, each layer is depicted as a small square, but in fact, each layer exists everywhere in the sampled area, so the small dashed circles on each layer show where the location of the highlighted admixed sample intersects each layer.

