

Abstract
Key points
High‐frequency stimulation (HFS) of the Schaffer collateral pathway activates metabotropic glutamate receptor 5 (mGluR5) signalling in the proximal apical dendrites of CA1 pyramidal neurons.
The synaptic activation of mGluR5‐mediated calcium signalling causes a significant increase in persistent sodium current (I Na,P) in the dendrites.
Increased I Na,P by HFS underlies potentiation of synaptic inputs at both the proximal and distal dendrite, leading to an enhanced probability of action potential firing associated with decreased action potential thresholds.
Therefore, HFS‐induced activation of intracellular mGluR5 serves an important role as an instructive signal for potentiation of upcoming inputs by increasing dendritic excitability.
Abstract
Dendritic Na+ channels in pyramidal neurons are known to amplify synaptic signals, thereby facilitating action potential (AP) generation. However, the mechanisms that modulate dendritic Na+ channels have remained largely uncharacterized. Here, we report a new form of short‐term plasticity in which proximal excitatory synaptic inputs to hippocampal CA1 pyramidal neurons transiently elevate dendritic excitability. High‐frequency stimulations (HFS) to the Schaffer collateral (SC) pathway activate mGluR5‐dependent Ca2+ signalling in the apical dendrites, which, with calmodulin, upregulates specifically Nav1.6 channel‐mediated persistent Na+ currents (I Na,P) in the dendrites. This HFS‐induced increase in dendritic I Na,P results in transient increases in the amplitude of excitatory postsynaptic potentials induced by both proximal SC and distal perforant path stimulation, leading to the enhanced probability of AP firing associated with decreased AP thresholds. Taken together, our study identifies dendritic I Na,P as a novel target for mediating activity‐dependent modulation of dendritic integration and neuronal output.
Keywords: mGluR5 signaling, dendritic excitability, persistent sodium current
Key points
High‐frequency stimulation (HFS) of the Schaffer collateral pathway activates metabotropic glutamate receptor 5 (mGluR5) signalling in the proximal apical dendrites of CA1 pyramidal neurons.
The synaptic activation of mGluR5‐mediated calcium signalling causes a significant increase in persistent sodium current (I Na,P) in the dendrites.
Increased I Na,P by HFS underlies potentiation of synaptic inputs at both the proximal and distal dendrite, leading to an enhanced probability of action potential firing associated with decreased action potential thresholds.
Therefore, HFS‐induced activation of intracellular mGluR5 serves an important role as an instructive signal for potentiation of upcoming inputs by increasing dendritic excitability.
Introduction
Pyramidal neurons have a refined dendritic machinery for active forms of signal integration. The domain‐specific distribution of voltage‐dependent ion channels in neuronal dendrites shapes the relationship between synaptic inputs and neuronal outputs. For example, A‐type K+ channels and HCN channels expressed in the CA1 pyramidal neuron (PN) dendrites profoundly affect integration and propagation of synaptic inputs (Hoffman et al. 1997; Magee, 1999). In addition, these ion channels can be regulated in an activity‐dependent manner, which provides a key mechanism of intrinsic plasticity (Frick et al. 2004; Brager & Johnston, 2007; Losonczy et al. 2008). Given there are a variety of voltage‐gated conductances in PN dendrites, exploring the detailed mechanism of how active dendrites process incoming synaptic signals and transform them into action potentials (APs) is essential groundwork for understanding brain function (Spruston, 2008; Major et al. 2013).
The group I metabotropic glutamate receptors (mGluRs) are known to be important for regulating a variety of ion channels, leading to the alteration of neuronal excitability (Congar et al. 1997; Chuang et al. 2000; Sohn et al. 2007; El‐Hassar et al. 2011). Most experiments have demonstrated effects of bath‐applied mGluR agonists on somatic excitability, whereas localized effects of group I mGluRs on dendritic excitability are largely unclear. In natural conditions, glutamate spillover during high neuronal activity would activate mGluRs located at nearby synapses and affect only adjacent dendritic ion channels. Given that most voltage‐gated ion channels are heterogeneously distributed along the somatodendritic axis (Hoffman et al. 1997; Lai & Jan, 2006; Beck & Yaari, 2008), group I mGluR activation by synaptically released glutamate should have distinct effects on the region of the dendrites stimulated by input pathways.
The Schaffer collateral (SC) fibres of CA3 PNs densely innervate the proximal dendrites of CA1 PNs and provide a strong excitatory drive onto CA1 neurons. Many in vivo studies have revealed that the synchronously bursting CA3 PNs cause high‐frequency excitatory activity in the apical dendrites of CA1 PNs (Buzsaki et al. 1983). Along with strong excitatory inputs from CA3 PNs, an activity‐dependent form of synaptic plasticity at these CA3–CA1 synapses has been widely investigated, and most studies have focused on long‐term plasticity. However, little information is available about short‐term plasticity and its function in dendritic computation.
Here we show that activation of mGluRs by high‐frequency stimulation (HFS) of SC inputs can transiently modulate dendritic excitability, promoting the efficacy of AP generation in response to upcoming inputs via SC or perforant path (PP) synapses. We combined electrophysiological and Ca2+ imaging recordings in acute hippocampal slices and showed that HFS induces dendritic Ca2+ release in the dendrites of CA1 PNs via group I mGluRs. This Ca2+ signal enhances dendritic persistent Na+ currents (I Na,P), which in turn increase synaptic responses induced by physiologically relevant stimulation and consequently increase the propensity to generate APs.
Methods
Animals and ethical approval
All animal studies and experimental protocols were approved by the Institutional Animal Care and Use Committee (IACUC, approval No. SNU‐090115‐7) at Seoul National University. The animals were maintained in standard environmental conditions (25 ± 2°C; 12/12 h dark/light cycle), were given ad libitum access to water and food, and were housed under veterinary supervision at the Institute for Experimental Animals, Seoul National University College of Medicine. mGluR5 knockout (KO) mice were purchased from The Jackson Laboratory (Bar Harbor, ME, USA). The authors understand the ethical principles under which The Journal of Physiology operates and the experiments comply with the animal ethics checklist described in Grundy (2015).
Hippocampal slice preparation
Hippocampal slices were prepared from Sprague–Dawley rats (P15–P19; P9–P16 for the experiments in Fig. 4) or C57BL/6 mice (P16–P20; experiments on mGluR5 KO mice) of either sex. After rats or mice were anaesthetized by inhalation with 5% isoflurane, they were decapitated and the brain quickly removed and chilled in an ice‐cold high‐magnesium cutting solution containing the following (in mm): 110 choline chloride, 25 NaHCO3, 20 glucose, 2.5 KCl, 1.25 NaH2PO4, 1 sodium pyruvate, 0.5 CaCl2, 7 MgCl2, 0.57 ascorbate, with pH adjusted to 7.4 by saturating with carbogen (95% O2–5% CO2), and with osmolarity of approximately 300 mosmol L−1. The isolated brain was glued onto the stage of a vibrating blade microtome (Leica VT1200, Buffalo Grove, IL, USA) and 300 μm‐thick transverse hippocampal slices were cut. The slices were incubated at 34°C for 30 min in artificial cerebrospinal fluid (aCSF) containing the following (in mm): 125 NaCl, 25 NaHCO3, 20 glucose, 2.5 KCl, 1.25 NaH2PO4, 1 sodium pyruvate, 1 CaCl2, 0.5 MgCl2, 0.57 ascorbate, bubbled with 95% O2–5% CO2, and thereafter maintained at room temperature.
Figure 4. I Na,P is enhanced by mGluR5‐induced Ca2+ signalling.
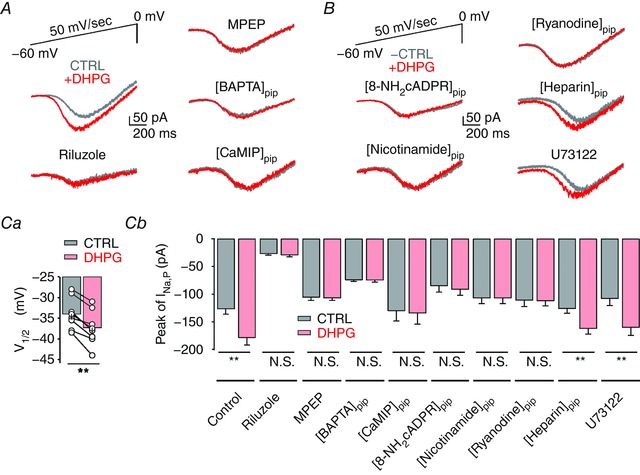
A, representative traces of somatically recorded whole‐cell currents in response to voltage ramp from −60 mV to 0 mV (50 mV s−1, top left) before (grey) and after (red) DHPG application in control (left, middle) and in the presence of riluzole (left, bottom), MPEP (right, top), intracellular BAPTA (right, middle) and CaMIP in the pipette solutions (right, bottom). B, representative traces of I Na,P in the presence of 8‐NH2‐cADPR (100 μm, n = 6), nicotinamide (5 mm, n = 5), ryanodine (100 μm, n = 5) and heparin (1 mg mL−1, n = 5) in pipette solutions or U73122 (20 μm, n = 5) in bath solutions. Ca, summary data of the effect of DHPG on V 1/2 (n = 8), suggesting the fast onset of activation of persistent Na+ channels. b, summary of the peak amplitude of I Na,P under different experimental conditions in A and B (control, n = 12; riluzole, n = 14; MPEP, n = 10; BAPTA, n = 6; CaMIP, n = 7; [8‐NH2‐cADPR]pip, n = 6; [nicotinamide]pip, n = 5; ryanodine, n = 5; [heparin]pip, n = 5; U73122, n = 5; control, P < 0.01; [heparin]pip, P < 0.01; U73122, P < 0.01), confirming that the potentiation of I Na,P is dependent on mGluR5‐mediated Ca2+ signalling. Lines connect data points from the same experiment for clarity. Error bars indicate SEM. ** P < 0.01. N.S., not significant. [Color figure can be viewed at http://wileyonlinelibrary.com]
Electrophysiological recordings
Whole‐cell voltage‐ or current‐clamp recordings from hippocampal CA1 PNs (one cell per slice) were performed at 32 ± 1°C and the rate of aCSF perfusion was maintained at 1–1.5 ml min−1. The recordings were made in somata with an EPC‐10 amplifier (HEKA Electonik, Lambrecht/Pfalz, Germany) at a sampling rate of 10–50 kHz. For current‐clamp recordings, the membrane potential was held at the resting membrane potential (RMP). Patch pipettes (3–4 MΩ) for current clamp mode were filled with internal solutions containing the following (in mm): 130 potassium gluconate, 20 KCl, 10 Na2‐phosphocreatine, 10 HEPES, 2 MgATP, 0.3 NaGTP, 0.1 EGTA. To isolate I Na,P in whole‐cell voltage‐clamp recordings, we used a modified aCSF containing 20 mm tetraethylammonium chloride (TEA) and 0.2 mm CdCl2 with internal solutions containing the following (in mm): 120 caesium methanesulfonate, 10 CsCl, 10 TEA‐Cl, 1 MgCl2, 10 HEPES, 0.1 EGTA, 0.4 Tris‐GTP, 3 Mg‐ATP and 5 Na2‐phosphocreatine (293 mosmol L−1, pH 7.3 with CsOH). In some cases, the apical dendrite of the neuron was cut by a blade under the microscope. Monopolar electrodes (tip size: 5–10 μm) filled with aCSF were connected to the stimulator (Master‐8, AMPI, Jerusalem, Israel) to deliver HFS or theta burst stimulation (TBS). We recorded series resistance throughout experiments, and excluded neurons with series resistance >20 MΩ from data analysis. Membrane potential values are presented without correcting the liquid junction potential. Neurons with resting potentials more positive than −55 mV were discarded. We did not confine the location of cells we recorded, but usually selected cells located in the superficial layer at an intermediate position. The RMP, AP threshold and input resistance of the CA1 PNs used in the present study were –65.6 ± 0.5 mV, –41.9 ± 0.7 mV and 147.0 ± 3.8 MΩ, respectively (n = 28). In voltage clamp experiments for I Na,P analysis, we recorded activation of inward currents in response to a depolarizing voltage ramp. The voltage where the inward current amplitude reached half of the peak (V 1/2) was measured and regarded as an indication of apparent voltage dependence for I Na,P.
For local application of drugs, a pneumatic pump (Toohey Spritzer, Fairfield, NJ, USA) was used with a puffing glass pipette (tip size: 1.5–2 μm). The puff area was determined from the fluorescence profile of Alexa Fluor 488 (100 μm, Thermo Fisher Scientific, Waltham, MA, USA), which was added to the puffing pipette. The ejection pressure was adjusted (typically to 0.5–1 psi) such that the puff area became a circular region of diameter 20 μm with the puffing pipette tip at the centre at 2 s after the start of ejection. Recordings obtained between 3 and 5 min after the start of drug ejection were regarded as representing drug effects.
Gene knock‐down using RNA interference
A short‐hairpin RNA (shRNA) to deplete endogenous Scn8a from the hippocampal CA1 PN was used in an organotypic slice culture. Scn8a‐targeting short‐interfering RNA (siRNA) (5′‐CAAGAGGTTTCTGCATAGA‐3′, shNav1.6) and non‐targeting siRNA control (shControl) were purchased from GeneCopoeia (Rockville, MD, USA). CA1 PNs in the cultured slices at 5–6 days in vitro (DIV) were transfected with plasmids encoding shNav1.6–green fluorescent protein (GFP) or shControl–GFP using the biolistic transfection method (Helios Gene Gun System, Bio‐Rad, Hercules, CA, USA). The transfected CA1 PNs were subject to electrophysiological recording 5 days after the transfection. The RMP and the AP threshold were −64.54 ± 0.97 and −42.04 ± 1.07 mV for shControl and −65.6 ± 1.19 and −47.7 ± 2.27 mV for shNav1.6, respectively.
Calcium measurements
The procedures for cytosolic Ca2+ measurement in brain slices were previously described in detail (Lee et al. 2007). For fluorescence excitation, we used a polychromatic light source (xenon lamp based, Polychrome‐IV; TILL Photonics, Gräfelfing, Germany), which was coupled to the epi‐illumination port of an inverted microscope (IX70, Olympus) via a quartz light guide and a UV condenser. Microfluorometry was performed with a 40x water immersion objective (NA 1.15, UAPO 406 W/340, Olympus) and a photodiode (TILL Photonics). Fluorescence intensity at a region of interest including the dendrite was measured at 10 Hz with double‐wavelength excitation at 340 nm (F 340) and 380 nm (F 380). The ratio R = F 340/F 380 was converted to [Ca2+]i values according to the following equation: [Ca2+]i = K eff (R − R min)/(R max − R), where K eff was estimated as 0.93 μm. Calibration parameters determined by using ex vivo calibration were typically 0.24 for R min and 3.4 for R max.
(RS)‐3,5‐Dihydroxyphenylglycine ((RS)‐3,5‐DHPG), LY367385, 2‐methyl‐6‐(phenylethynyl)pyridine (MPEP), 6‐cyano‐7‐nitro‐quinoxaline‐2,3‐dione (CNQX), (2R)‐amino‐5‐phosphonopentanoic acid (APV), picrotoxin (PTX), ryanodine, tetrodotoxin (TTX) and riluzole were purchased from Tocris Bioscience (Avonmouth, Bristol, UK). Choline chloride was from Junsei Chemical (Tokyo, Japan). U73122 was from Biomol (Hamburg, Germany). Fura 2 and 8‐NH2‐cyclic ADP ribose (8‐NH2‐cADPR) were from Thermo Fisher Scientific. All other drugs were purchased from Sigma‐Aldrich (St Louis, MO, USA). Stock solutions of drugs were made by dissolving in deionized water or dimethyl sulfoxide (DMSO) according to manufacturer's specifications and were stored at −20°C. On the day of the experiment one aliquot was thawed and used. The concentration of DMSO in solutions was maintained at 0.1%.>
Data analysis
All data are presented as mean ± standard error of the mean (SEM). Statistical analysis was performed using IgorPro (version 6.1, WaveMetrics, Lake Oswego, OR, USA) and OriginPro (version 9.0, OriginLab Corp., Northampton, MA, USA). The Wilcoxon signed‐rank test and the Mann–Whitney test were used as appropriate to compare paired and non‐paired groups, respectively. P‐values of <0.05 were considered statistically significant.
Results
HFS of SC pathway induces mGluR5‐mediated Ca2+ release at proximal apical dendrites of hippocampal CA1 pyramidal neurons
We first tested the effects of a group I mGluR on the dendrites of hippocampal CA1 PNs. We applied HFS (100 Hz for 0.5 s) to SC synapses paired with backpropagating action potentials (bAPs), which are known to evoke group I mGluR‐mediated Ca2+ signals in the hippocampal CA1 PN dendrites (Nakamura et al. 1999). To prevent long‐term synaptic plasticity mediated by NMDA receptors and the recruitment of GABAergic inhibition, all the experiments were performed in the presence of APV (50 μm) and PTX (100 μm) in the bath. To measure Ca2+ transients in dendrites, cells were loaded with the high‐affinity Ca2+ indicator dye Fura‐2 (100 μm; Fig. 1 Aa). SC fibres that terminate on proximal dendrites were activated by a stimulation electrode positioned at ∼100 μm away from the soma and ∼50 μm away from the trunk of the apical dendrite (Fig. 1 Aa). HFS to the SC pathway at subthreshold intensities did not increase Ca2+, whereas the same subthreshold synaptic stimulations when combined with somatic current injections or suprathreshold synaptic stimulation without somatic current injections that are sufficient to elicit two or three APs induced a large transient increase of Ca2+ in the proximal dendrites (Fig. 1 Ab; Nakamura et al. 1999). The amplitude of Ca2+ transients was not increased by increasing AP numbers with a higher stimulus intensity, which is consistent with the regenerative property for Ca2+‐induced Ca2+ release. In agreement with previous reports (Nakamura et al. 1999; Watanabe et al. 2006), dendritic Ca2+ transients did not invade the soma. These protocols were further pharmacologically corroborated by brief puffs of DHPG (250 μm), a group I mGluR agonist, at 30 s intervals to the apical dendrites, yielding a similar Ca2+ transient (Fig. 1 Ac).
Figure 1. HFS induces mGluR5‐dependent dendritic Ca2+ release at apical dendrites of CA1 PNs.
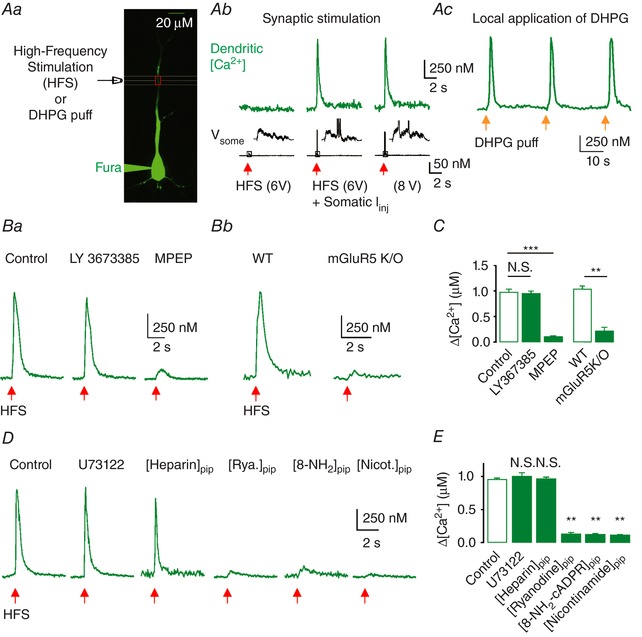
Aa, representative fluorescence image of a CA1 PN filled with 100 μm Fura‐2 during whole‐cell recording. An extracellular stimulating electrode was placed ∼100 μm from the soma and ∼50 μm away from the dendrites of interest (red box). b, representative [Ca2+]i transients measured at a dendritic location ∼100 μm from the soma in response to subthreshold HFS only, subthreshold HFS with somatic current injection (I inj; middle), or HFS at suprathreshold intensity that could evoke two or three APs (bottom; V soma); inset shows an expanded view corresponding to the box shown in the voltage traces. c, representative [Ca2+]i transients in response to repetitive (every 30 s) local applications of DHPG (250 μm, 0.5 s). Red (b) or yellow (c) arrows indicate the time points of corresponding stimulation. Ba, [Ca2+]i increases were not affected by 25 μm LY367385 (middle) but were blocked by 10 μm MPEP (right). b, [Ca2+]i transients in response to HFS on CA1 PNs from WT (left) and mGluR5 KO (right) mice. C, summary of the amplitude of [Ca2+]i transients under each condition, indicating that HFS at SC synapses causes mGluR5‐dependent Ca2+ release (control, n = 10; LY367385, n = 8; MPEP, n = 7; WT, n = 6; mGluR5 KO, n = 6; control vs. LY367385, P = 1.0; control vs. MPEP, P < 0.0005; WT vs. KO, P < 0.01). D, representative traces for [Ca2+]i responses to HFS in control and in the presence of U73122 (20 μm, n = 8) in bath solutions, and heparin (1 mg mL−1, n = 8), ryanodine (100 μm, n = 5), nicotinamide (5 mm, n = 5) and 8‐NH2‐cADPR (100 μm, n = 6) in pipette solutions. E, summary of the amplitude of [Ca2+]i responses under each condition indicating that HFS causes cADPR‐dependent Ca2+ release from the intracellular store (control, n = 7; U73122, n = 8; [heparin]pip, n = 8; [ryanodine]pip, n = 5; [8‐NH2‐cADPR]pip, n = 6; [nicotinamide] pip, n = 5; control vs. [ryanodine]pip, P < 0.01; control vs. [8‐NH2‐cADPR]pip, P < 0.01; control vs. [nicotinamide]pip, P < 0.01). Error bars indicate SEM. ** P < 0.01, *** P < 0.001. N.S., not significant. [Color figure can be viewed at http://wileyonlinelibrary.com]
We next dissected the specific subtypes of group I mGluR involved in HFS‐induced Ca2+ transients. HFS‐induced Ca2+ transients were not affected by the mGluR1 antagonist LY367385 (25 μm) but were substantially abolished by the mGluR5 antagonist MPEP (10 μm; Fig. 1 Ba and C). The amplitude of Ca2+ transients recorded in the presence of MPEP, which could be regarded as a Ca2+ increase induced by backpropagating APs, was 12.6 ± 2.4 % (n = 7) of control. Dependence of HFS‐induced Ca2+ transients on mGluR5 activation was further confirmed using mGluR5 KO mice (Jia et al. 1998). In the hippocampal slices obtained from wild‐type (WT) mice, HFS to the SC pathway induced large Ca2+ transients in the apical dendrites of CA1 PNs, but no Ca2+ transients were induced by the same stimulation in the slices obtained from mGluR5 KO mice (Fig. 1 Bb and C). Together, these results indicate that the HFS to proximal SC synapses induces mGluR5‐dependent Ca2+ release in the apical dendrites of CA1 PNs.
To further elucidate the mechanisms of HFS‐induced Ca2+ transients, we systematically analysed the downstream signalling pathways. Group I mGluRs are well known to induce Ca2+ release from intracellular stores via the phospholipase C (PLC)/inositol 1,4,5‐trisphosphate (IP3)‐dependent pathway (Nakamura et al. 1999; Nakamura et al. 2000; Ross, 2012). However, application of U73122 (a PLC inhibitor) to the bath solutions or inclusion of heparin (an IP3 receptor inhibitor in the pipette solutions) did not reduce HFS‐induced Ca2+ release (Fig. 1 D and E). Rather, HFS‐induced Ca2+ release was abolished when the cyclic adenosine diphosphate ribose (cADPR)–ryanodine receptor (RyR) pathway was blocked by the inclusion of 8‐NH2‐cADPR, nicotinamide or ryanodine in the pipette solutions (Fig. 1 D and E), consistent with our previous reports (Sohn et al. 2011). Therefore, these results confirmed that HFS of the SC pathway readily induced mGluR5 activation and Ca2+ release from the intracellular store, which was mediated by cADPR.
HFS at SC pathway causes post‐tetanic potentiation of excitatory postsynaptic potential–spike coupling
To test the role of HFS‐induced Ca2+ release in the regulation of neuronal function in CA1 PNs, we studied the effects of HFS on excitatory postsynaptic currents (EPSCs) and excitatory postsynaptic potentials (EPSPs) evoked by SC stimulations. HFS did not induce any significant change in the amplitude or paired pulse ratio of the EPSCs (Fig. 2 A and B). In contrast, the amplitude of EPSPs was significantly increased after HFS (Fig. 2 A and B), while the kinetics of EPSPs were unaltered (20–80% rise time (ms), before HFS: 3.01 ± 0.16, after HFS: 2.97 ± 0.16, n = 6, P = 0.44; decay time constant (ms), before HFS, 41.2 ± 3.6, after HFS: 41.2 ± 4.1 n = 6, P = 0.84). We also verified that the RMPs remained unchanged after HFS (before HFS: −65.2 ± 0.5 mV, after HFS: −65.1 ± 0.4, n = 8; P = 0.38). These results suggest that HFS affects dendritic excitability but not the efficacy of synaptic transmission. To further examine the effects of HFS on postsynaptic excitability, we probed whether HFS leads to changes in spiking activity in response to high‐frequency input from CA3 (Csicsvari et al. 2000; Fig. 2 C). We repeated high‐frequency burst stimulation (5 stimuli at 100 Hz) of SC fibres at 10 s intervals before and after HFS. HFS of the SC inputs readily induced increases in spike probability (before HFS: 0.25 ± 0.02, after HFS: 0.7 ± 0.03, n = 16; P < 0.001; Fig. 2 C). We refer to this form of intrinsic plasticity as post‐tetanic EPSP‐to‐spike (E‐S) potentiation (PT‐ESP). PT‐ESP was accompanied by a large increase in the mean amplitude of EPSPs (Fig. 2 D). Furthermore, the threshold voltage for AP firing (defined as the voltage at which dV/dt exceeded 20 V s−1) was hyperpolarized by −0.89 ± 0.7 mV (n = 8, P < 0.01) after HFS (Fig. 2 E), suggesting the involvement of Na+ channels. Maximum dV/dt during APs which represents axosomatic Na+ channel activity was unchanged after HFS (Fig. 2 E). Considering that HFS evoked local dendritic Ca2+ signals that were not propagated into soma, these results suggest that enhancement of dendritic Na+ channels contributes to HFS‐induced E‐S potentiation.
Figure 2. HFS at SC fibres causes Na+ channel‐mediated post‐tetanic potentiation of EPSP–spike coupling in CA1 PNs.
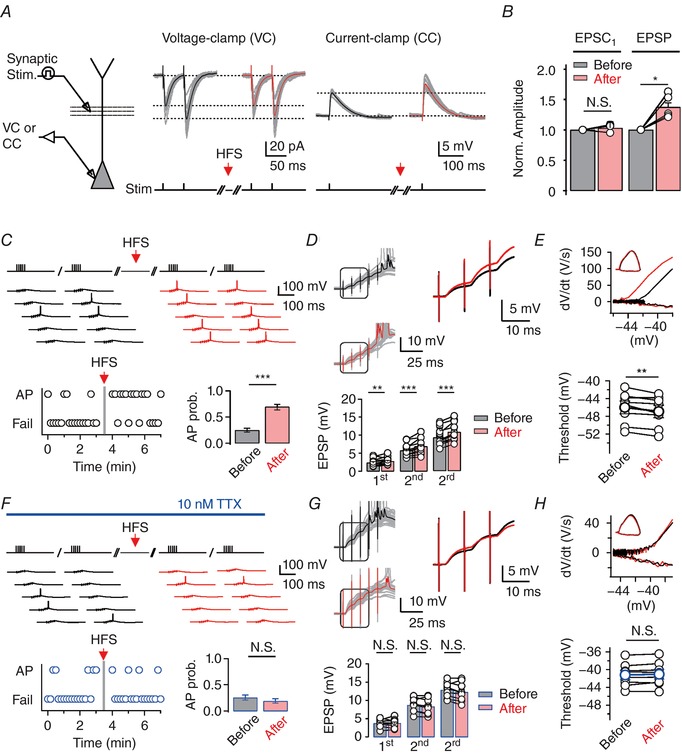
A, left, experimental configuration showing somatic patch‐clamp recording in voltage‐clamp (VC) or current‐clamp (CC) configuration, combined with presynaptic stimulation of the SC. Middle, 12 consecutive traces of EPSCs (grey; 5 s repetition interval) evoked by paired pulse stimulation are overlaid with the average EPSC before (left; black) and after (right; red) HFS. Right, 12 consecutive traces of EPSPs (grey; 3 s repetition interval) evoked by a single stimulus are overlaid with the average EPSP before (left; black) and after (right; red) HFS. B, summary of the peak amplitude of the first EPSCs (n = 5) and EPSPs (n = 6) after HFS (red) normalized to the control amplitude before HFS (grey) suggesting postsynaptic expression of potentiation. C and F, top, representative traces of somatically measured voltage in response to a short, high‐frequency train stimulation (5 stimuli at 100 Hz), repeated every 10 s before (black) and after (red) HFS in control (C) and in TTX (10 nm; F). Bottom left, whether or not the AP was evoked during a short train was analysed and plotted against time. Bottom right, summary graph showing the increased probability of AP firing in control (C), but no significant difference in TTX (F) after HFS. D and G, top left, representative somatic voltage responses (20 samples for each group) to short train stimulation (5 pulses, 100 Hz) before (black) and after (red) HFS. Averaged EPSP traces are superimposed on the right. Bottom, summary of the peak amplitude of the first, second, and third EPSPs in the burst exhibiting the potentiation after HFS (n = 12). Note that the potentiation after HFS is occluded in TTX (n = 9; G). E and H, top, phase‐plane plots of dV/dt vs. corresponding voltage from AP traces before (grey) and after (red) HFS are shown superimposed. Note that the threshold for AP initiation is shifted after HFS in control (n = 8; E) but not in TTX (n = 8; H), suggesting that HFS at SC–CA1 synapses induces Na+ channel‐mediated increase in dendritic excitability, resulting in decreased threshold value for axosomatic APs. Vertical bars (grey) define the time points of HFS application. Lines connect data points from the same experiment for clarity. Error bars indicate SEM. * P < 0.05, ** P < 0.01, *** P < 0.001. N.S., not significant. [Color figure can be viewed at http://wileyonlinelibrary.com]
To investigate whether dendritic Na+ channels are responsible for HFS‐induced E‐S potentiation, we examined the effect of HFS under the condition that dendritic Na+ channels are reduced. Low concentration of TTX (10 nm) has often been used for block of the dendritic Na+ channels without affecting synaptic transmission (Madeja, 2000; Kim et al. 2015). In the presence of 10 nm TTX, PT‐ESP was completely abolished (Fig. 2 F). As predicted, the amplitudes of EPSPs were not affected by HFS (Fig. 2 G) and the AP threshold remained unchanged (Fig. 2 H). These results indicate that dendritic Na+ channels are important for PT‐ESP.
HFS‐induced PT‐ESP requires mGluR5‐dependent Ca2+ signalling and is mediated by persistent Na+ currents
To quantify the effects of PT‐ESP under situations that more closely resemble the physiological network activity, we applied high‐frequency burst stimulation repeated six times at 4 Hz, which mimics the endogenous theta rhythm (theta burst stimulation; TBS) in the hippocampus (4–10 Hz) during exploratory behaviour. Stimulus intensity was set to be slightly over the threshold for the first burst stimulation, resulting in subthreshold EPSPs or the firing of one or two APs during the second to sixth bursts. In the presence of APV and PTX, the number of spikes per sweep (repeated every 5 s; Fig. 3 A) was maintained at a constant level, indicating that TBS in our experimental condition did not have potentiating effects on AP generation. However, HFS of the SC inputs reliably produced PT‐ESP (red; n = 9; P < 0.005; Fig. 3 A and B). To investigate the duration of the HFS effect on AP generation, we counted the number of APs during TBS and plotted them as a function of time (n = 9; Fig. 3 B). The increase in AP number following HFS did not last long and decreased gradually to the basal level within 2 min (Fig. 3 B). When we repeated the HFS, similar increases in AP firing were observed (Fig. 3 B).
Figure 3. HFS‐induced PT‐ESP occurs via mGluR5‐dependent Ca2+ signals.
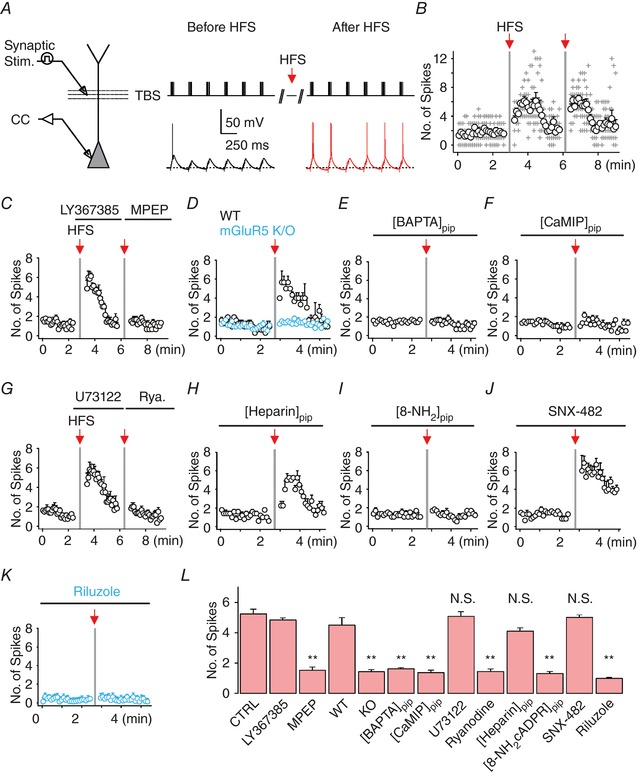
A, left, experimental configuration illustrating somatic whole‐cell recording with extracellular stimulation of SC synapses. Right, representative traces of somatically recorded voltages during TBS (top, 5 synaptic stimulations at 100 Hz repeated 6 times at 4 Hz) before (black) and after (red) HFS. Note that AP firing patterns during TBS were changed after HFS. B, number of spikes evoked by each TBS was counted and plotted against time; grey cross, data from individual experiments; black open circles, averaged values (n = 9). C–J, summary plots of the mean number of APs evoked by TBS as a function of time under the conditions indicated (C, 25 μm LY367385 and 10 μm MPEP; D, WT mice and mGluR5 KO; E, 10 mm BAPTA in pipette; F, 20 μm calmodulin inhibitory peptide (CaMIP) in pipette; G, 20 μm U73122 and 100 μm ryanodine; H, heparin (1 mg mL−1) in pipette solutions; I, 100 μm 8‐NH2‐cADPR in pipette solutions; J, 0.5 μm R‐type Ca2+ channel blocker, SNX‐482; K, 100 μm riluzole). L, pooled data of the mean number of APs during TBS obtained for 1 min after HFS in each experimental condition (control, n = 12; LY367385, n = 6; MPEP, n = 6; WT, n = 4; mGluR5 KO, n = 8; BAPTA, n = 8; CaMIP, n = 7; U73122, n = 6; ryanodine, n = 6; [heparin]pip, n = 5; [8‐NH2‐cADPR]pip, n = 6; SNX‐482, n = 5; riluzole, n = 8; control vs. MPEP, P < 0.01; WT vs. mGluR5 KO, P < 0.01; control vs. [BAPTA]pip, P < 0.01; control vs. [CaMIP]pip, P < 0.01; control vs. ryanodine, P < 0.01; control vs. [8‐NH2‐cADPR]pip, P < 0.01; control vs. riluzole, P < 0.01), indicating the involvement of mGluR5‐dependent Ca2+ signalling in HFS‐induced PT‐ESP. Vertical grey bars indicate the time points of HFS application. Error bars indicate SEM. ** P < 0.01; N.S., not significant. [Color figure can be viewed at http://wileyonlinelibrary.com]
We next examined the dependence of HFS‐induced PT‐ESP on mGluR5 activation. As expected, PT‐ESP was abolished in the presence of MPEP (n = 6; P < 0.005; Fig. 3 C), whereas no changes were detected during the bath application of LY367385 (n = 6; P = 0.81; Fig. 3 C). PT‐ESP was also abolished when 10 mm BAPTA was included in the whole‐cell patch pipette to inhibit a rise in cytosolic Ca2+ (Fig. 3 E), indicating the involvement of mGluR5‐dependent Ca2+ release in PT‐ESP. In addition, PT‐ESP was completely abolished by inhibiting calmodulin (CaM)‐mediated signalling by using CaM inhibitory peptides (Fig. 3 F). We then tested several additional blockers to identify the mechanism of mGluR5‐dependent Ca2+ release required for PT‐ESP, confirming the involvement of the cADPR–RyR pathway (Fig. 3 G–I). Finally, the necessity of mGluR5 in PT‐ESP was examined using mGluR5 KO mice. In WT mice, HFS at SC synapses induced PT‐ESP to similar degrees as observed in rat hippocampus but not in mGluR5 KO mice (Fig. 3 D). Altogether, these results suggest that mGluR5‐dependent Ca2+ release activates Ca2+/CaM signalling leading to PT‐ESP.
To identify the ionic mechanisms underlying PT‐ESP, we tested the pharmacological blockers that inhibit the ion channels underlying mGluR‐mediated events (Fig. 3 J and K). It was previously reported that group I mGluR agonist enhances R‐type Ca2+ currents resulting in the generation of afterdepolarization in CA1 PNs (Park et al. 2010). Thus, we examined the involvement of R‐type Ca2+ channels in PT‐ESP by using a specific blocker, SNX‐482. PT‐ESP was not prevented in the presence of SNX‐482 (P = 0.09; Fig. 3 J). Another candidate is the persistent Na+ currents (I Na,P) that are increased by DHPG in medium spiny neurons of nucleus accumbens (D'Ascenzo et al. 2009). I Na,P has been shown to amplify EPSPs and facilitate repetitive firing in CA1 PNs (Lipowsky et al. 1996; Yue et al. 2005). Therefore, we examined the effect of a I Na,P blocker, riluzole (Urbani & Belluzzi, 2000), on PT‐ESP. In the presence of riluzole (10 μm), PT‐ESP was completely abolished (Fig. 3 K), which is in agreement with our observation that a low concentration of TTX can block PT‐ESP (Fig. 2 F; van Drongelen et al. 2006). We therefore hypothesized that HFS may induce potentiation of I Na,P, which in turn leads to PT‐ESP.
mGluR5 activation upregulates persistent Na+ currents
To test this hypothesis, we examined the relationship between the modulation of I Na,P and the activation of mGluR5 in CA1 PNs. I Na,P was recorded using a slowly rising voltage ramp pulse (50 mV s−1) from a holding potential of −60 mV to 0 mV in voltage‐clamp configuration with Cs+‐based pipette solutions to inhibit K+ currents (Fig. 4). The mean amplitude of the peak inward current was −126.7 ± 9.6 pA (n = 12) in control conditions but was significantly reduced in the presence of riluzole (−26.4 ± 2.4 pA; n = 14), indicating that the inward current recorded by this protocol represents I Na,P (Fig. 4 A and Cb). When we added DHPG to the control bath solution, the peak I Na,P was increased significantly to −178.3 ± 14.1 pA (n = 12), but the addition of DHPG had no effects on the peak I Na,P when cells were pretreated with riluzole (Fig. 4 A and Cb). Furthermore, apparent voltage dependence for I Na,P estimated from V 1/2 was hyperpolarized by −3.43 ± 1.34 mV (n = 8) in the presence of DHPG (Fig. 4 Ca). These results indicate that group I mGluR‐induced potentiation of I Na,P in CA1 PNs leads to the increased amplitude and the reduced activation threshold. We also examined the signalling mechanisms that are involved in DHPG‐induced I Na,P potentiation. We found that the DHPG effect was abolished in the presence of MPEP, BAPTA (10 mm), cADPR inhibitors and CaM inhibitory peptide in the pipette solutions, but not by inhibitors for the PLC–IP3 pathway (Fig. 4 A, B and Cb), confirming that I Na,P in the CA1 PNs is potentiated by mGluR5‐dependent Ca2+ signalling.
mGluR5‐induced potentiation is mediated by upregulation of dendritic I Na,P
To determine whether mGluR5 signalling has an affect uniformly along the somatodendritic axis or whether it selectively targets somatic or dendritic I Na,P, we used the local application of DHPG. The local application of DHPG into the soma did not change the amplitude of I Na,P (Fig. 5 A and C). In contrast, the same puff application to the proximal dendrites resulted in moderate increase in I Na,P (Fig. 5 A and C). These results indicate that mGluR5 signalling selectively targets dendritic I Na,P. Consistent with this idea, bath application of DHPG did not increase I Na,P when the apical dendrites were truncated (∼50 μm from the soma; Fig. 5 A and C). In addition, in the presence of low TTX (10 nm), the amplitude of I Na,P did not increase after bath application of DHPG (n = 5; P = 0.62; Fig. 5 B and C). Together, these results suggest that mGluR5‐dependent Ca2+ signals can potentiate I Na,P channels selectively in the dendrites.
Figure 5. mGluR5‐dependent signalling results in enhancement of I Na,P in apical dendrites of CA1 PNs.
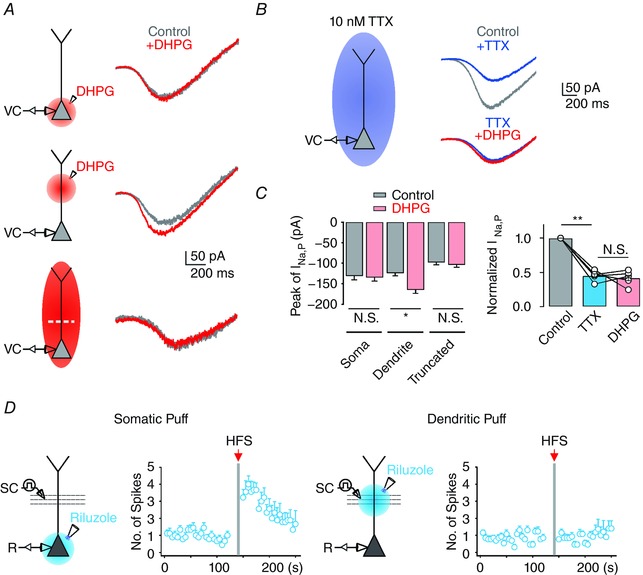
A, left, schematic diagram illustrating the recording configuration. DHPG is applied either by bath perfusion (bottom) or by local application to the soma (top) or the proximal dendrite (centre) with a pressure application system. Right, representative traces of somatically recorded whole‐cell currents in response to voltage ramp from −60 to 0 mV (50 mV s−1) before (grey) and after (red) DHPG application. Note that dendrotomy of the entire apical dendrite of CA1 PNs (bottom) occludes mGluR5‐dependent increase of I Na,P. B, left, experimental configuration showing the voltage‐clamp recording with bath application of 10 nm TTX. Right, representative traces of somatically recorded I Na,P in control and in the presence of 10 nm TTX, with or without local application of DHPG (bottom). Ca, pooled data of the peak amplitude of I Na,P under different experimental conditions in A. b, pooled data of the normalized amplitude of I Na,P in each condition in B. D, experimental configuration showing somatic recording with TBS/HFS stimulation of the SC pathway, combined with local somatic (left) or dendritic (right) application of 50 μm riluzole. Right, summary plots of average number of APs evoked by TBS as a function of time in each condition. Vertical grey bars define the time points of HFS application. Error bars indicate SEM. * P < 0.05, ** P < 0.01. N.S., not significant. [Color figure can be viewed at http://wileyonlinelibrary.com]
To further confirm that mGluR5‐dependent potentiation of dendritic I Na,P underlies PT‐ESP, we used the local puff applications of riluzole (50 μm) to the dendritic or somatic area. PT‐ESP was substantially abolished by a block of dendritic I Na,P, but not by block of INa,P in perisomatic regions (Fig. 5 D). Thus, modulation of dendritic I Na,P induced by HFS is the underlying ionic mechanism of PT‐ESP.
Dendritic Nav1.6 is a target for mGluR5‐dependent upregulation of I Na,P
We also tested whether mGluR5‐dependent I Na,P enhancement involves a specific isoform of Na+ channels. Because Nav1.6 is abundantly expressed in the CA1 PN dendrites (Lorincz & Nusser, 2010), we used hippocampal slice culture for downregulating the Nav1.6 expression level by shNav1.6 transfection (Fig. 6 A). DHPG‐induced increase in I Na,P is completely abolished in neurons that are biolistically transfected with plasmid encoding Nav1.6‐targeting short hairpin RNA (shNav1.6) but not in neurons transfected with non‐targeting RNA (shControl, P < 0.05; shNav1.6, P = 0.13; Fig. 6 B). Finally, HFS failed to induce PT‐ESP when CA1 PNs were transfected with shNav1.6 (shControl, P < 0.05; shNav1.6, P = 0.95; Fig. 6 C and D). Taken together, these results suggest that dendritic Nav1.6 is the likely target of mGluR5‐dependent I Na,P regulation and HFS‐induced PT‐ESP.
Figure 6. Knockdown of Nav1.6 abolishes HFS‐induced PT‐ESP.
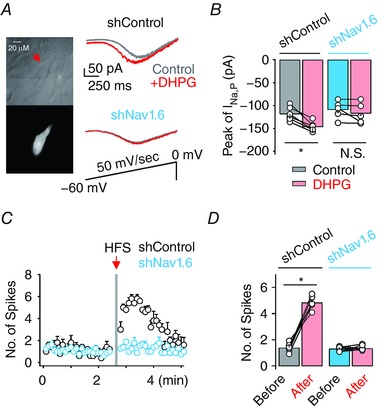
A, representative infrared differential interference contrast video image (top) and fluorescence image (bottom) of a CA1 PN transfected with scrambled shRNA. Right, representative traces before (grey) and after (red) DHPG application recorded from hippocampal neurons transfected with scrambled shRNA (shControl, top) or Nav1.6 shRNA (shNav1.6, middle). Bottom panel indicates voltage ramp from −60 mV to 0 mV (50 mV s−1). B, summary bar graph of the averaged peak amplitude of I Na,P in each condition (shControl, n = 6; shNav1.6, n = 5). C, plot of the number of APs evoked by TBS in neurons transfected with shControl or shNav1.6. D, bar graph showing the mean number of APs during TBS obtained for 1 min before and after HFS in each condition before (shControl, grey; shNav1.6, blue) and after (red) HFS (shControl, n = 8; shNav1.6, n = 6). Vertical grey bars define the time points of HFS application. Circles in B and D represent data from individual cells. Lines connect data points from the same experiment. Error bars indicate SEM. * P < 0.05, ** P < 0.01. N.S., not significant. [Color figure can be viewed at http://wileyonlinelibrary.com]
HFS at SC pathway causes E‐S potentiation at PP synapse
Finally, we examined whether HFS at proximal synapses alone can potentiate EPSPs generated at distal synapses and subsequently boost the AP generation. To this end, a second stimulating electrode was placed more than 150 μm away from the first electrode, while the location of the first stimulating electrode for HFS was unchanged. PT‐ESP at distal synapses was robustly induced when HFS was delivered to the proximal synapses (Fig. 7 Aa and b, and C). However, HFS to the same distal synapses did not induce PT‐ESP (Fig. 7 Ba and b, and C). Together, these results demonstrate that HFS‐induced increases of dendritic excitability occur only at the proximal dendrites and their potentiating effects also affect distal excitatory signals, leading to E‐S potentiation of PP inputs.
Figure 7. PP inputs to CA1 PNs are potentiated by HFS of SC but not PP inputs.
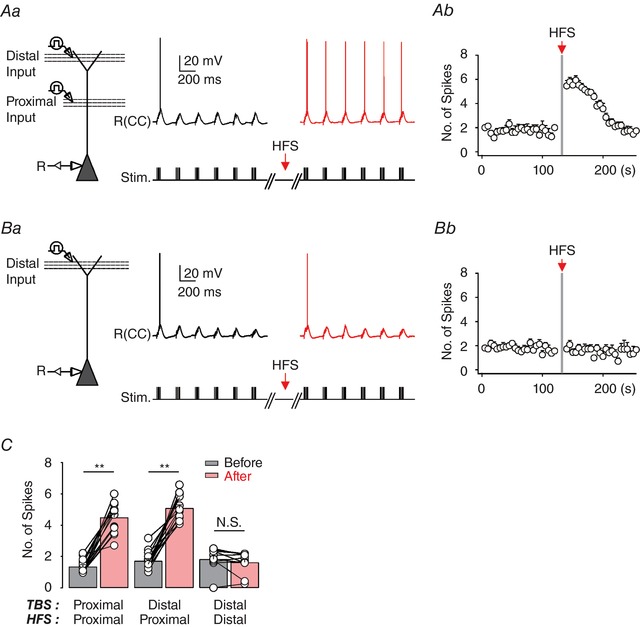
Aa, experimental configuration showing somatic current‐clamp recording (CC) with extracellular electrodes positioned to stimulate PP and SC inputs. Representative traces of somatically recorded voltages in response to TBS at distal synapses (>250 μm; approximately corresponding to the stratum lacunosum‐moleculare) before (black) and after (red) HFS of the SC (∼100 μm). b, the number of somatic APs evoked by TBS at distal synapses before and after HFS against time (n = 10). Ba, experimental configuration and representative traces of summated EPSP recorded from the soma in response to TBS at the distal dendrites before (black) and after (red) HFS, which was applied to the same region. b, the number of APs evoked by TBS at proximal synapses before and after HFS against time (n = 7). C, bar graph summarizing the number of APs obtained for 1 min before and after HFS in each condition (left, n = 14; middle, n = 15; right, n = 11), indicating that HFS at proximal, but not at distal, synapses can induce a significant short‐term potentiation at both proximal and distal synapses. Vertical grey bars define the time points of HFS application. Error bars indicate SEM. ** P < 0.01. N.S., not significant. [Color figure can be viewed at http://wileyonlinelibrary.com]
Discussion
We demonstrate that a short period of tetanic stimulations of the SC pathway activates a postsynaptic mGluR5‐signalling cascade at the synaptic site, which gives rise to an enhancement of dendritic persistent sodium current, thereby increasing the safety factor for spike initiation in the hippocampal CA1 PN dendrites. Moreover, the upregulation of dendritic I Na,P also enhances the efficacy of distal synaptic inputs, providing new evidence for SC inputs as an instructive signal for potentiation of distal inputs. This post‐tetanic EPSP–spike potentiation is an unreported form of short‐term plasticity, providing a novel insight for understanding the dynamics of hippocampal network operations.
PT‐ESP, a novel form of short‐term plasticity
Tetanic stimulations to synapses are well known to induce potentiation of synaptic strength. Generally, it is referred to as post‐tetanic potentiation (PTP) when the potentiation lasts for several minutes and long‐term potentiation (LTP) when the potentiation lasts for more than an hour. PTP has been suggested to play important roles in information processing and working memory (Mongillo et al. 2008), whereas LTP is known as a cellular mechanism for storing information (Bliss & Collingridge, 1993). In our study, we demonstrate a cellular plasticity form of PTP driven by HFS for a short duration (0.5 s) to the proximal dendrites, which is distinct from synaptic PTP or LTP. After tetanic induction, dendritic I Na,P at the stimulation sites is increased, leading to potentiation of the EPSPs and facilitation of AP generation for a short duration.
Another feature of PT‐ESP is that the increased dendritic I Na,P induced by HFS at the proximal dendrites has a potentiating effect for the EPSPs generated at the distal dendrites (Fig. 2). Pathway interactions between proximal SC inputs and distal PP inputs in CA1 PNs have received much attention in recent studies. When two inputs are paired at a precise interval, stimulation of distal PP inputs induces LTP at proximal SC synapses (Dudman et al. 2007), suggesting an instructive role of PP inputs. On the other hand, Jarsky et al. (2005) showed a gating function of proximal SC inputs when they came slightly after PP inputs. Similarly, Takahashi & Magee (2009) reported a drastic change in output mode and an increase in input efficacy of PP input to CA1 by the occurrence of highly correlated SC inputs. In our study, E‐S potentiation of distal inputs after HFS to proximal inputs is also considered to represent a gating function of proximal inputs, but there are several distinctions compared with previous studies. The gate opening presented in our study is an intrinsic mechanism and does not require highly correlated interactions between distinct pathways.
In the present study, we applied HFS in the presence of APV to exclude the possible contamination of NMDA receptor‐dependent mechanisms and investigated mGluR‐mediated effects. However, in physiological conditions, it is possible that NMDA receptor‐dependent changes, such as synaptic LTP or intrinsic plasticity (Beck & Yaari, 2008), are activated together with mGluRs, leading to the synergistic effects. Alternatively, E‐S potentiation of both proximal and distal inputs to CA1 PNs on a time scale of minutes (<2 min, Fig. 3) induced by short HFS may act as a metaplastic mechanism to lower the threshold for activating NMDA‐dependent mechanisms. The increase in AP firing during PT‐ESP might help to induce LTP at PP synapses in response to the stimulation, which is otherwise not sufficient to induce LTP of the PP synapses in CA1 PNs (Magee & Johnston, 1997; Fan et al. 2005).
Remarkably, a previous in vivo study (Lee et al. 2012) has shown that single‐cell manipulation of intrinsic excitability of hippocampal CA1 PNs during spatial navigation can reversibly turn a previously silent cell (without spatially tuned firing) into a place cell (with spatially tuned firing in a defined location of the animal), reflecting that intrinsic excitability is a more important determinant of the firing field than the strength of synaptic inputs. The same lab recently reported a study in which the somatic membrane potential of place cells was continuously monitored during exploration of both novel and familiar virtual environments, revealing that the emergence of new place fields does not require sustained depolarization, and that CA1 PNs that later become place cells showed a lower AP threshold and a greater likelihood of firing bursts of APs (Cohen et al. 2017; Schmidt‐Hieber & Nolan, 2017). These results imply the importance of firing ability of CA1 PNs in functioning as place cells. However, the conditions whereby firing ability is modulated are not well known. Given that PT‐ESP can be evoked by physiologically plausible stimulation at CA3–CA1 synapses and involves a reduced AP threshold and increased AP firing rates, our results may have important implications for the role of dendritic I Na,P in mediating place field formation.
Activity‐dependent regulation of dendritic I Na,P
Persistent sodium currents are present throughout the central nervous system, and they play an important role in neuronal excitability (Crill, 1996; Hsu et al. 2017). Despite its small magnitude compared to fast Na+ currents (<1%), I Na,P has distinct functional significance because of the low activation threshold (∼10 mV negative to that of fast Na+ currents) and non‐inactivating property (Crill, 1996). I Na,P in CA1 PNs contributes to afterdepolarization and associated bursting (Yue et al. 2005), regulation of spike timing (Vervaeke et al. 2006) and amplification of EPSPs (Stuart & Sakmann, 1995). Recently, Nav1.7‐mediated I Na,P in hypothalamic neurons was reported to prolong EPSPs, playing an important role in the synaptic integration mechanism (Branco et al. 2016). We found that HFS‐induced I Na,P enhancement causes the increase in EPSP amplitude (Fig. 2), but the time course of EPSP decay was not significantly affected after HFS. Considering that synaptic integration is the process to which the balance between inward and outward currents, membrane potentials and input resistance contribute in a complex way, the role of I Na,P in synaptic integration can be different in different type of neurons or in different inputs. Additional studies will be required to understand the mechanisms involved in different roles of I Na,P in synaptic integration.
The subcellular localization of ion channels may have a great impact on their functional significance in the regulation of neuronal excitability and synaptic integration. Since the focal application of the sodium channel blocker to the somatic region, but not to the distal dendrites, had inhibitory effects (Stuart & Sakmann, 1995; Yue et al. 2005), it was suggested that these functions are attributable to proximal I Na,P localized near the soma. Although the presence of dendritic I Na,P was suggested earlier (Crill, 1996), the role of dendritic I Na,P has remained unclear. Differential localization of Nav1.7 at specific neuronal compartments such as subsets of dendritic branches has been suggested to underlie input‐specific processing of EPSPs in hypothalamic neurons (Branco et al. 2016). We provide evidence that mGluR5 signalling activated by HFS to the SC pathway selectively regulates I Na,P in the proximal apical dendrites of CA1 PNs to cause the enhancement of EPSPs, leading to PT‐ESP. Using voltage‐clamp experiments for direct recording of I Na,P, we demonstrated that focal application of DHPG to dendritic regions, not to the perisomatic region, induces an increase in I Na,P (Fig. 5). These results suggest a differential modulation of dendritic I Na,P and perisomatic I Na,P and a specific coupling between mGluR5 and dendritic I Na,P. Given that I Na,P can be modulated by various signalling pathways (Baker, 2005; Harvey et al. 2006), many questions about how I Na,P modulation can influence dendritic excitability and synaptic integration remain to be addressed.
The specific coupling between mGuR5 and dendritic I Na,P leads to the question of whether isoform‐specific regulation underlies this specificity. Previously, a quantitative EM immunolocalization study has shown the presence of Nav1.6 in the CA1 PN dendrites with a gradual decrease in density along the proximodistal axis but absence of other Na+ channel isoforms in the CA1 PN dendrites (Lorincz & Nusser, 2010). Therefore, we anticipated that Nav1.6 could be a major isoform responsible for mGluR5 and dendritic I Na,P coupling. Indeed, we found that dendritic Nav1.6 is a target for mGluR5‐induced potentiation of I Na,P (Fig. 5). The result that I Na,P potentiation is dependent on the Ca2+/calmodulin (CaM) pathway (Fig. 4) is consistent with the previous report that Ca2+/CaM selectively modulates Nav1.6 currents (Herzog et al. 2003). We showed that I Na,P potentiation increases the amplitude of EPSPs at subthreshold levels (Fig. 2), suggesting a distinctive role of I Na,P from fast Na+ currents. Possibly, a more hyperpolarized voltage threshold for Nav1.6 activation compared with other Na+ channel isoforms (Rush et al. 2005) may underlie the role of dendritic I Na,P as a regulator for subthreshold EPSPs.
Dendritic mGluR signalling
We demonstrated previously that mGluR5‐dependent Ca2+ release induced by mGluR agonist is independent of the PLC–IP3 pathways and identified cADPR as a signalling molecule that activates ryanodine receptors (Sohn et al. 2011). In the present paper, we found that the same signalling pathway underlies Ca2+ release induced by synaptically activated mGluR5 in the dendrites of CA1 PNs (Fig. 3). In addition, we showed that potentiation of I Na,P and PT‐ESP, which are downstream of mGluR5‐mediated Ca2+ release, is also independent of the PLC–IP3 pathways but is mediated by cADPR–RyR signalling pathways (Fig. 4).
Ca2+ release by group I mGluR activation is generally believed to be mediated by the PLC–IP3 pathway. This is based on the report by Nakamura et al. (1999), but they also showed that mGluR‐dependent Ca2+ release at CA1 apical dendrites was abolished in the presence of ryanodine. However, they regarded this result as a manifestation of communication between a RyR‐sensitive store and an IP3‐sensitive store. Without testing the effect of PLC inhibitors, they reported that intracellular heparin prevented Ca2+ release, and concluded that Ca2+ release is IP3 dependent. We do not know the reason for the discrepancy for heparin effects, but found a clue in their result. They described that intracellular heparin did not block the slow depolarization. Considering that group I mGluR‐induced slow depolarization is mediated by Ca2+ wave‐dependent activation of TRPC (El‐Hassar et al. 2011), blocking Ca2+ release should block depolarization. Possibly, heparin may interfere with Ca2+ measurement under certain experimental conditions (Landt et al. 1994). Such a possibility needs to be carefully examined to use heparin in a Ca2+‐measurement study as a selective blocker for IP3‐dependent Ca2+ release. We suggest that to provide evidence for the IP3 dependence of Ca2+ release, the effect of PLC inhibition is also required. We showed that mGluR‐mediated Ca2+ release is unaffected by PLC inhibition using not only pharmacological blockers but also a PLC KO mouse (Sohn et al. 2011). Since we used animals at a younger age, we cannot rule out the possibility that the sources for the intracellular [Ca2+] and the target of the [Ca2+] signal might be developmentally regulated.
In CA1 PNs, a low‐frequency stimulation of a long duration (3 Hz for 5 min) that induces synaptic LTD induced a long‐term increase in intrinsic excitability because of the decrease in I h currents, and these changes were mGluR dependent and Ca2+ dependent (Brager & Johnston, 2007). We showed that HFS to the proximal apical dendrites modulates dendritic I Na,P but did not find any signature for changes in I h (RMP and input resistance remained unchanged after HFS). Possibly, depending on the stimulation pattern, duration and location, mGluR‐mediated Ca2+ signalling may couple to different downstream events, resulting in different effects that last for different durations. Therefore, the roles of mGluR5‐dependent short‐term E‐S potentiation in hippocampal information processing is a fundamental question that remains to be answered in future studies.
Additional information
Competing interests
The authors declare no competing financial interests.
Author contributions
W.Y. and J.K. performed the experiments; S‐H.L. and W‐K.H. designed the experiments; J‐W.S., S‐H.L., S.K. and W‐K.H. wrote the paper. All authors have read and approved the final version of this manuscript and agree to be accountable for all aspects of the work in ensuring that questions related to the accuracy or integrity of any part of the work are appropriately investigated and resolved. All persons designated as authors qualify for authorship, and all those who qualify for authorship are listed.
Funding
This work was supported by the National Research Foundation of Korea (NRF‐2010‐0027941 and NRF‐2017R1A2B2010186 to W.K.H., and NRF‐2015R1C1A1A02037776 to S.K.) and the Brain Korea 21 PLUS program.
Biographies
Weonjin Yu is a PhD candidate at the Seoul National University College of Medicine. He earned his bachelor's degrees in both Life Science and Food Science at Handong Global University. His doctoral research focused on the regulatory mechanism of intrinsic excitability and synaptic plasticity in CA1 hippocampal neurons. He is currently working on how human midbrain‐like organoids may be useful as a model for studying midbrain function and dysfunction in collaboration with Dr Shawn Je in Duke‐NUS Medical School.

Jaehan Kwon is a PhD student in the Department of Physiology at the Seoul National University College of Medicine. His research focuses on the cellular mechanism underlying mGluR signalling and its pathophysiologic implication. He is particularly interested in how functional consequences of mGluR activation differ in different areas in the brain.
Edited by: Ole Paulsen & Matthew Nolan
W. Yu and J. Kwon contributed equally to this work.
Linked articles This article is highlighted by a Perspective by Fricker. To read this Perspective, visit https://doi.org/10.1113/JP276604.
Contributor Information
Sooyun Kim, Email: sooyun.kim@snu.ac.kr.
Won‐Kyung Ho, Email: wonkyung@snu.ac.kr.
References
- Baker MD ( 2005). Protein kinase C mediates up‐regulation of tetrodotoxin‐resistant, persistent Na+ current in rat and mouse sensory neurones. J Physiol 567, 851–867. [DOI] [PMC free article] [PubMed] [Google Scholar]
- Beck H & Yaari Y (2008). Plasticity of intrinsic neuronal properties in CNS disorders. Nat Rev Neurosci 9, 357–369. [DOI] [PubMed] [Google Scholar]
- Bliss TV & Collingridge GL (1993). A synaptic model of memory: long‐term potentiation in the hippocampus. Nature 361, 31–39. [DOI] [PubMed] [Google Scholar]
- Brager DH & Johnston D (2007). Plasticity of intrinsic excitability during long‐term depression is mediated through mGluR‐dependent changes in I h in hippocampal CA1 pyramidal neurons. J Neurosci 27, 13926–13937. [DOI] [PMC free article] [PubMed] [Google Scholar]
- Branco T, Tozer A, Magnus CJ, Sugino K, Tanaka S, Lee AK, Wood JN & Sternson SM (2016). Near‐perfect synaptic integration by Nav1.7 in hypothalamic neurons regulates body weight. Cell 165, 1749–1761. [DOI] [PMC free article] [PubMed] [Google Scholar]
- Buzsaki G, Leung LW & Vanderwolf CH (1983). Cellular bases of hippocampal EEG in the behaving rat. Brain Res 287, 139–171. [DOI] [PubMed] [Google Scholar]
- Chuang SC, Bianchi R & Wong RK (2000). Group I mGluR activation turns on a voltage‐gated inward current in hippocampal pyramidal cells. J Neurophysiol 83, 2844–2853. [DOI] [PubMed] [Google Scholar]
- Cohen JD, Bolstad M & Lee AK (2017). Experience‐dependent shaping of hippocampal CA1 intracellular activity in novel and familiar environments. Elife 6, e23040. [DOI] [PMC free article] [PubMed] [Google Scholar]
- Congar P, Leinekugel X, Ben‐Ari Y & Crepel V (1997). A long‐lasting calcium‐activated nonselective cationic current is generated by synaptic stimulation or exogenous activation of group I metabotropic glutamate receptors in CA1 pyramidal neurons. J Neurosci 17, 5366–5379. [DOI] [PMC free article] [PubMed] [Google Scholar]
- Crill WE ( 1996). Persistent sodium current in mammalian central neurons. Annu Rev Physiol 58, 349–362. [DOI] [PubMed] [Google Scholar]
- Csicsvari J, Hirase H, Mamiya A & Buzsaki G (2000). Ensemble patterns of hippocampal CA3‐CA1 neurons during sharp wave‐associated population events. Neuron 28, 585–594. [DOI] [PubMed] [Google Scholar]
- D'Ascenzo M, Podda MV, Fellin T, Azzena GB, Haydon P & Grassi C (2009). Activation of mGluR5 induces spike afterdepolarization and enhanced excitability in medium spiny neurons of the nucleus accumbens by modulating persistent Na+ currents. J Physiol 587, 3233–3250. [DOI] [PMC free article] [PubMed] [Google Scholar]
- Dudman JT, Tsay D & Siegelbaum SA (2007). A role for synaptic inputs at distal dendrites: instructive signals for hippocampal long‐term plasticity. Neuron 56, 866–879. [DOI] [PMC free article] [PubMed] [Google Scholar]
- El‐Hassar L, Hagenston AM, D'Angelo LB & Yeckel MF (2011). Metabotropic glutamate receptors regulate hippocampal CA1 pyramidal neuron excitability via Ca2+ wave‐dependent activation of SK and TRPC channels. J Physiol 589, 3211–3229. [DOI] [PMC free article] [PubMed] [Google Scholar]
- Fan Y, Fricker D, Brager DH, Chen X, Lu HC, Chitwood RA & Johnston D (2005). Activity‐dependent decrease of excitability in rat hippocampal neurons through increases in I h . Nat Neurosci 8, 1542–1551. [DOI] [PubMed] [Google Scholar]
- Frick A, Magee J & Johnston D (2004). LTP is accompanied by an enhanced local excitability of pyramidal neuron dendrites. Nat Neurosci 7, 126–135. [DOI] [PubMed] [Google Scholar]
- Grundy D ( 2015). Principles and standards for reporting animal experiments in The Journal of Physiology and Experimental Physiology . J Physiol 593, 2547–2549. [DOI] [PMC free article] [PubMed] [Google Scholar]
- Harvey PJ, Li X, Li Y & Bennett DJ (2006). 5‐HT2 receptor activation facilitates a persistent sodium current and repetitive firing in spinal motoneurons of rats with and without chronic spinal cord injury. J Neurophysiol 96, 1158–1170. [DOI] [PMC free article] [PubMed] [Google Scholar]
- Herzog RI, Liu C, Waxman SG & Cummins TR (2003). Calmodulin binds to the C terminus of sodium channels Nav1.4 and Nav1.6 and differentially modulates their functional properties. J Neurosci 23, 8261–8270. [DOI] [PMC free article] [PubMed] [Google Scholar]
- Hoffman DA, Magee JC, Colbert CM & Johnston D (1997). K+ channel regulation of signal propagation in dendrites of hippocampal pyramidal neurons. Nature 387, 869–875. [DOI] [PubMed] [Google Scholar]
- Hsu C, Zhao X, Milstein A & Spruston N (2017). Voltage‐dependence of spatial coding in hippocampal pyramidal neurons supported by persistent sodium current Society for Neuroscience Abstract, http://www.abstractsonline.com/pp8/#!/4376/presentation/8488 [DOI] [PMC free article] [PubMed] [Google Scholar]
- Jarsky T, Roxin A, Kath WL & Spruston N (2005). Conditional dendritic spike propagation following distal synaptic activation of hippocampal CA1 pyramidal neurons. Nat Neurosci 8, 1667–1676. [DOI] [PubMed] [Google Scholar]
- Jia Z, Lu Y, Henderson J, Taverna F, Romano C, Abramow‐Newerly W, Wojtowicz JM & Roder J (1998). Selective abolition of the NMDA component of long‐term potentiation in mice lacking mGluR5. Learn Mem 5, 331–343. [PMC free article] [PubMed] [Google Scholar]
- Kim Y, Hsu CL, Cembrowski MS, Mensh BD & Spruston N (2015). Dendritic sodium spikes are required for long‐term potentiation at distal synapses on hippocampal pyramidal neurons. Elife 4, e06414. [DOI] [PMC free article] [PubMed] [Google Scholar]
- Lai HC & Jan LY (2006). The distribution and targeting of neuronal voltage‐gated ion channels. Nat Rev Neurosci 7, 548–562. [DOI] [PubMed] [Google Scholar]
- Landt M, Hortin GL, Smith CH, McClellan A & Scott MG (1994). Interference in ionized calcium measurements by heparin salts. Clin Chem 40, 565–570. [PubMed] [Google Scholar]
- Lee D, Lin BJ & Lee AK (2012). Hippocampal place fields emerge upon single‐cell manipulation of excitability during behavior. Science 337, 849–853. [DOI] [PubMed] [Google Scholar]
- Lee SH, Park KH, Ho WK & Lee SH (2007). Postnatal developmental changes in Ca2+ homeostasis in supraoptic magnocellular neurons. Cell Calcium 41, 441–450. [DOI] [PubMed] [Google Scholar]
- Lipowsky R, Gillessen T & Alzheimer C (1996). Dendritic Na+ channels amplify EPSPs in hippocampal CA1 pyramidal cells. J Neurophysiol 76, 2181–2191. [DOI] [PubMed] [Google Scholar]
- Lorincz A & Nusser Z (2010). Molecular identity of dendritic voltage‐gated sodium channels. Science 328, 906–909. [DOI] [PMC free article] [PubMed] [Google Scholar]
- Losonczy A, Makara JK & Magee JC (2008). Compartmentalized dendritic plasticity and input feature storage in neurons. Nature 452, 436–441. [DOI] [PubMed] [Google Scholar]
- Madeja M ( 2000). Do neurons have a reserve of sodium channels for the generation of action potentials? A study on acutely isolated CA1 neurons from the guinea‐pig hippocampus. Eur J Neurosci 12, 1–7. [DOI] [PubMed] [Google Scholar]
- Magee JC ( 1999). Dendritic I h normalizes temporal summation in hippocampal CA1 neurons. Nat Neurosci 2, 848. [DOI] [PubMed] [Google Scholar]
- Magee JC & Johnston D (1997). A synaptically controlled, associative signal for Hebbian plasticity in hippocampal neurons. Science 275, 209–213. [DOI] [PubMed] [Google Scholar]
- Major G, Larkum ME & Schiller J (2013). Active properties of neocortical pyramidal neuron dendrites. Annu Rev Neurosci 36, 1–24. [DOI] [PubMed] [Google Scholar]
- Mongillo G, Barak O & Tsodyks M (2008). Synaptic theory of working memory. Science 319, 1543–1546. [DOI] [PubMed] [Google Scholar]
- Nakamura T, Barbara JG, Nakamura K & Ross WN (1999). Synergistic release of Ca2+ from IP3‐sensitive stores evoked by synaptic activation of mGluRs paired with backpropagating action potentials. Neuron 24, 727–737. [DOI] [PubMed] [Google Scholar]
- Nakamura T, Nakamura K, Lasser‐Ross N, Barbara JG, Sandler VM & Ross WN (2000). Inositol 1,4,5‐trisphosphate (IP3)‐mediated Ca2+ release evoked by metabotropic agonists and backpropagating action potentials in hippocampal CA1 pyramidal neurons. J Neurosci 20, 8365–8376. [DOI] [PMC free article] [PubMed] [Google Scholar]
- Park JY, Remy S, Varela J, Cooper DC, Chung S, Kang HW, Lee JH & Spruston N (2010). A post‐burst after depolarization is mediated by group I metabotropic glutamate receptor‐dependent upregulation of Cav2.3 R‐type calcium channels in CA1 pyramidal neurons. PLoS Biol 8, e1000534. [DOI] [PMC free article] [PubMed] [Google Scholar]
- Ross WN ( 2012). Understanding calcium waves and sparks in central neurons. Nat Rev Neurosci 13, 157–168. [DOI] [PMC free article] [PubMed] [Google Scholar]
- Rush AM, Dib‐Hajj SD & Waxman SG (2005). Electrophysiological properties of two axonal sodium channels, Nav1.2 and Nav1.6, expressed in mouse spinal sensory neurones. J Physiol 564, 803–815. [DOI] [PMC free article] [PubMed] [Google Scholar]
- Schmidt‐Hieber C & Nolan MF (2017). Synaptic integrative mechanisms for spatial cognition. Nat Neurosci 20, 1483–1492. [DOI] [PubMed] [Google Scholar]
- Sohn JW, Lee D, Cho H, Lim W, Shin HS, Lee SH & Ho WK (2007). Receptor‐specific inhibition of GABAB‐activated K+ currents by muscarinic and metabotropic glutamate receptors in immature rat hippocampus. J Physiol 580, 411–422. [DOI] [PMC free article] [PubMed] [Google Scholar]
- Sohn JW, Yu WJ, Lee D, Shin HS, Lee SH & Ho WK (2011). Cyclic ADP ribose‐dependent Ca2+ release by group I metabotropic glutamate receptors in acutely dissociated rat hippocampal neurons. PLoS One 6, e26625. [DOI] [PMC free article] [PubMed] [Google Scholar]
- Spruston N ( 2008). Pyramidal neurons: dendritic structure and synaptic integration. Nat Rev Neurosci 9, 206–221. [DOI] [PubMed] [Google Scholar]
- Stuart G & Sakmann B (1995). Amplification of EPSPs by axosomatic sodium channels in neocortical pyramidal neurons. Neuron 15, 1065–1076. [DOI] [PubMed] [Google Scholar]
- Takahashi H & Magee JC (2009). Pathway interactions and synaptic plasticity in the dendritic tuft regions of CA1 pyramidal neurons. Neuron 62, 102–111. [DOI] [PubMed] [Google Scholar]
- Urbani A & Belluzzi O (2000). Riluzole inhibits the persistent sodium current in mammalian CNS neurons. Eur J Neurosci 12, 3567–3574. [DOI] [PubMed] [Google Scholar]
- van Drongelen W, Koch H, Elsen FP, Lee HC, Mrejeru A, Doren E, Marcuccilli CJ, Hereld M, Stevens RL & Ramirez JM (2006). Role of persistent sodium current in bursting activity of mouse neocortical networks in vitro. J Neurophysiol 96, 2564–2577. [DOI] [PubMed] [Google Scholar]
- Vervaeke K, Hu H, Graham LJ & Storm JF (2006). Contrasting effects of the persistent Na+ current on neuronal excitability and spike timing. Neuron 49, 257–270. [DOI] [PubMed] [Google Scholar]
- Watanabe S, Hong M, Lasser‐Ross N & Ross WN (2006). Modulation of calcium wave propagation in the dendrites and to the soma of rat hippocampal pyramidal neurons. J Physiol 575, 455–468. [DOI] [PMC free article] [PubMed] [Google Scholar]
- Yue C, Remy S, Su H, Beck H & Yaari Y (2005). Proximal persistent Na+ channels drive spike afterdepolarizations and associated bursting in adult CA1 pyramidal cells. J Neurosci 25, 9704–9720. [DOI] [PMC free article] [PubMed] [Google Scholar]