

SUMMARY
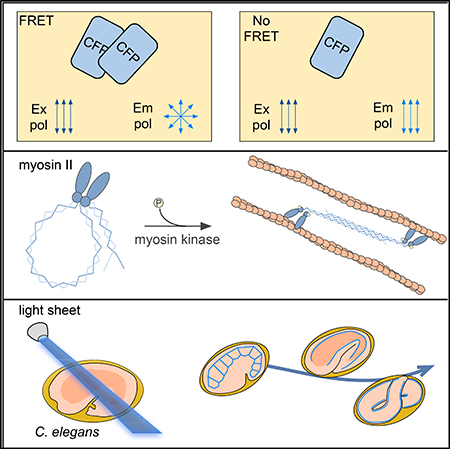
Complex cell behaviors require dynamic control over non-muscle myosin II (NMMII) regulatory light chain (RLC) phosphorylation. Here, we report that RLC phosphorylation can be tracked in living cells and organisms using a homotransfer fluorescence resonance energy transfer (FRET) approach. Fluorescent protein-tagged RLCs exhibit FRET in the dephosphorylated conformation, permitting identification and quantification of RLC phosphorylation in living cells. This approach is versatile and can accommodate several different fluorescent protein colors, thus enabling multiplexed imaging with complementary biosensors. In fibroblasts, dynamic myosin phosphorylation was observed at the leading edge of migrating cells and retracting structures where it persistently colocalized with activated myosin light chain kinase. Changes in myosin phosphorylation during C. elegans embryonic development were tracked using polarization inverted selective-plane illumination microscopy (piSPIM), revealing a shift in phosphorylated myosin localization to a longitudinal orientation following the onset of twitching. Quantitative analyses further suggested that RLC phosphorylation dynamics occur independently from changes in protein expression.
In Brief
Markwardt et al. report a myosin II phosphorylation assay based on homotransfer between fluorescent protein-tagged regulatory light chains. This approach was used to track the dynamics of myosin phosphorylation in migrating fibroblasts. Quantitative polarization imaging was also fused with light sheet microscopy to follow myosin phosphorylation in developing C. elegans.
Graphical Abstract
INTRODUCTION
Regulatory light chain (RLC) phosphorylation controls non-muscle myosin II (NMMII) engagement with actin filaments, driving formation and contraction of the actomyosin cytoskeleton (Conti and Adelstein, 2008). Notable signal transduction processes that regulate RLC phosphorylation include myosin light chain kinase (MLCK) that phosphorylates myosin RLC through a calcium-dependent mechanism (Somlyo and Somlyo, 2003) and myosin phosphatase, which is inactivated by Rho-dependent kinase (Somlyo et al., 2000). Although NMMII activity is known to be an essential contributor to cellular cytoskeletal dynamics, how RLC phosphorylation is precisely controlled at the subcellular level is less clear.
Compartmentalized NMMII activity has been proposed at multiple sites in migrating cells. NMMII participation is required for focal adhesion maturation (Kuo et al., 2011), actin arc formation at the leading edge (Burnette et al., 2011), and cell steering through its action in the trailing cell posterior (Petrie et al., 2009; Vicente-Manzanares et al., 2008). Pathways thought to influence RLC phosphorylation are known for their dynamic spatiotemporal regulation. Compartmentalized regulation of both RhoA (Kunida et al., 2012; Pertz et al., 2006; Wu et al., 2009) and MLCK (Chew et al., 2002) in migrating cells have been described. Less clear is whether RLC is stably phosphorylated or is dynamic. This is important because stable actomyosin fibers are required to generate the force that propels cells forward (Case and Waterman, 2015). Further, it is unknown how certain fibers are stabilized but not others, or whether phosphorylated RLCs in actomyosin fibers require active maintenance.
Questions of persistence and dynamics are relevant to other contexts, such as embryonic development. NMMII activity has been broadly implicated in shaping organisms and tissues (Mammoto and Ingber, 2010; Siedlik and Nelson, 2015). Polarized contraction, either in select groups of cells or compartmentalized within individual cells, is thought to help shape organisms (Aldaz et al., 2013), organs (Gutzman et al., 2015) and even finer structures (Ewald et al., 2008; Kim et al., 2013). Because both filament orientation and the duration they persist are thought to be vitally important for polarized contraction (Kasza et al., 2014), an optical approach for measuring myosin RLC phosphorylation would be useful for understanding how NMMII activity is controlled and sustained throughout development.
Fluorescence imaging is invaluable for tracking spatiotemporal regulation of molecules in living specimens, particularly so when combined with sensors that can report molecular activities in vivo (Guo et al., 2014; Jones-Tabah et al., 2017; Liang et al., 2016). Biosensor imaging has been applied to classic models of embryonic development less frequently than whole animal physiology, with only a handful of successes reported in zebrafish (Andrews et al., 2016; Muto et al., 2011; Xu et al., 2012; Zhao et al., 2015), Drosophila (Markova et al., 2015), and C. elegans (Kelley et al., 2015; Vuong-Brender et al., 2018). Consequently, less is known about protein activities during development outside of gene expression.
Presently available tools are not well suited for measuring RLC phosphorylation in living cells and organisms. Ideally, a myosin RLC phosphorylation assay should reveal the location of phosphorylated RLC proteins within living cells and organisms, provide compatibility with existing optical biosensor technologies, and permit quantification of phosphorylated RLC levels. Fluorescence resonance energy transfer (FRET)-based strategies that incorporate fluorescent proteins (FPs) meet many of these expectations because their ratiometric readout is inherently quantitative. Even so, the conventional two-color FRET approach has drawbacks. Incorporation of two FPs leaves little of the visible spectrum for other sensors and optical tools, such as photoactivatable channels and proteins. FRET experiments also generally require high signal-to-noise images for calculation of an accurate FRET ratio (Padilla-Parra and Tramier, 2012). The light dosage needed for quantitative ratio imaging frequently introduces phototoxicity and photobleaching issues that limit experimentation.
To address these limitations, we developed an approach to report FP-tagged-myosin RLC phosphorylation using a homotransfer FRET approach. Because FP fluorescence is highly polarized, fluorescence polarization microscopy can be used to detect the depolarization of fluorescence that accompanies FRET (Jares-Erijman and Jovin, 2003; Rizzo and Piston, 2005; Mattheyses et al., 2004). Fluorescence depolarization, or equivalently a reduction in fluorescence anisotropy, between fluorescein molecules in solution led to the discovery and characterization of FRET (Förster, 1948). Polarization-based FRET measurements are not only indicative of FRET, but are advantageous for quantitative imaging because polarization can be measured more precisely than intensity (Rizzo and Piston, 2005; Rizzo et al., 2006).
Here, we report that fluorescence polarization imaging enables quantification of myosin RLC phosphorylation dynamics in living cells. It can also accommodate complementary fluorescence approaches, including conventional biosensors and fluorophores. We then combined polarization imaging with a live-cell light sheet microscopy approach (Wu et al., 2011) to enable quantitative imaging over several hours in developing organisms. This approach revealed information about the regulation of RLC phosphorylation in living systems.
RESULTS
Anisotropy FRET NMMII Phosphorylation Assay
PhosphorylationofmyosinRLCstriggersdissociationofRLC:RLC dimers, promoting a conformational change in NMMII that facilitates binding to F-actin (Vicente-Manzanares et al., 2009). RLC domain separation presents an opportunity to detect their phosphorylation by monitoring FRET between two FP-RLC fusions (Figure 1A). Homotransfer FRET measurements can be collected using a standard widefield microscope configured for polarization microscopy. A plate polarizer is first placed in the excitation path. Two emission polarization images, oriented parallel (P) and perpendicular (S) to the excitation plane, are needed to calculate the fluorescence anisotropy. These can be simultaneously collected on a single camera using an image splitter equipped with polarization-splitting optics (Figure S1A).
Figure 1. A FRET Assay for RLC Phosphorylation.

(A) Phosphorylation of NMMII RLCs results in dissociation of RLC homodimers, actin binding, and diminished FRET.
(B) REF52 fibroblasts expressing mCer3-RLC wereplated on uncoated or fibronectin (FN)-treated glass coverslips and imaged using widefield microscopy.
(C) The fluorescence anisotropy of mCer3-RLC (n = 10 biological replicates) was measured in cells plated on uncoated or FN-treated glass coverslips (t test, ****p < 0.0001, n = 15 cells, bars indicate SD).
(D) RLC phosphorylation sites (Ser19 and Thr18) (Ikebe et al., 1986) were mutated to alanines (AA) to prevent phosphorylation or aspartates (DD) to mimic RLC phosphorylation and expressed in REF52 cells. Fluorescence anisotropies were measured in REF52 cells expressing mutant mCer3-RLCs (t test as in C, ****p < 0.0001, n = 28 biological replicates for AA and 27 for DD, bars indicate SD).
(E) REF52 cells expressing mCer3-RLC were platedon FN and fixed.
(F) A ratio image was generated and pseudocoloredto show high anisotropy (i.e., phosphorylated) regions in blue. Some regions contain both high and low anisotropy pixels, making identification of phosphorylated myosin structures in the ratio image difficult (arrows).
(G and H) Anisotropy pixels above 0.133 were identified either by thresholding the ratio image (G) to mask low anisotropy pixels or performing a normalized image subtraction (H).
(I) Cells were immunostained with phospho-myosinantibodies to identify phosphorylated RLC.
(J) mCer3-RLC anisotropy data from phosphomyosin immunostained cells was sorted into regions lacking co-localization (Non-Phos) and regions colocalized with phosphomyosin (Phos). Phos regions contained significantly higher anisotropies (n = 10 biological replicates; ****p < 0.0001, t test, bars indicate SD).
(K) The mean brightness for each region was notsignificantly different than the total cellular brightness (p > 0.05, ANOVA, Tukey multiple comparison test, n = 10 biological replicates, bars indicate SD).
(L–N) Cells expressing mCer3-RLC(DD) were treated with 500 nM latrunculin A to depolymerize the actin cytoskeleton (pre-stimulation, L; post-treatment, M). The anisotropy of mCer3-RLC(DD) was not significantly affected. (N) Anisotropy values were normalized to the mean from untreated cells. Latrunculin A treatment did not significantly alter measured mCer3-RLC(DD) anisotropy (p > 0.05, t test, n = 10 biological replicates, bars indicate SD).
N-terminal FP-RLC fusions incorporating the mCer3 cyan FP (Markwardt et al., 2011) were transfected into REF52 fibroblasts plated on either glass or fibronectin (FN) to promote actomyosin filament formation (Figure 1B). The mCer3-RLC anisotropies in glass-plated cells were significantly lower compared to anisotropies from FN-plated cells (Figure 1C), consistent with increased homotransfer and RLC dimerization in the dephosphorylated state. The anisotropy of mutant RLC that lack the regulatory phosphorylation sites (S18A, T19A; AA) was reduced significantly compared to mCer3-RLCs containing phosphomimetic aspartate mutations (S18D, T19D; DD) (Figure 1D). These results suggest that phosphorylation-induced RLC conformational changes can be quantified using fluorescence polarization microscopy. Similar observations were made using EGFP-RLC and mCherry-RLC fusion proteins (Figure S2), demonstrating the flexibility of this approach across different FP colors.
Next, mCer3-RLC expressing cells were grown on FN-coated coverglass and immunostained (Figures 1E–1I) using an antibody to phosphorylated myosin RLC. Although high anisotropy regions (Figure 1F, blue) revealed the location of actomyosin fibers, low anisotropy pixels sometimes obscured them (arrows). This effect is likely related to image ratioing, which equalizes intensity differences across the cell. Further isolation of the myosin fibers was achieved by thresholding the ratiometric image to mask anisotropy values below 0.133, which is 1 SD above the mean value for the AA mutant (Figure 1D). This only marginally improved contrast in cell regions that contain high amounts of low-anisotropy pixels (Figure 1G). Intensity information can be better preserved by subtracting a scaled S image (normalized to exclude anisotropies <0.133; Figure S3) from the anisotropic P image (Figure 1H). Normalized subtraction effectively isolated high anisotropy regions and closely resembled the phosphomyosin RLC immunostain (Figure 1I), suggesting that the localization of phosphorylated myosin RLCs can be revealed using fluorescence polarization imaging. mCer3-RLC pixel anisotropies from regions co-localized with the phospho-myosin immunostain were significantly higher than non-colocalized pixels (Figure 1J). The average pixel intensity from either subset was not significantly different than the mean pixel brightness over the entire cell (Figure 1K).
To test whether actin filament binding affected mCer3-RLC anisotropy, we plated cells expressing the mCer3-RLC(DD) mutant on FN. Anisotropy measurements were taken before treatment with latrunculin A to depolymerize actin filaments. Latrunculin A application changed the localization of mCer3RLC(DD) from filamentous (Figure 1L) to diffusely cytoplasmic (Figure 1M), but did not significantly alter the fluorescence anisotropy of mCer3-RLC(DD) (Figure 1N). These data suggest that RLC phosphorylation, rather than actin binding, is the primary mechanism underlying reduced RLC FRET.
Dynamic Measurement of RLC-FRET in Living Cells
Myosin RLC-FRET dynamics were explored in living cells using mCherry-RLC. REF52 fibroblasts expressing mCherry-RLC were treated with 20 μM ML-7 for 5 min to inhibit MLCK activity. ML-7 treatment reduced mCherry-RLC anisotropy compared to untreated cells (Figure 2A), consistent with inhibited RLC phosphorylation. ML-7 treatment did not affect the anisotropy of mCherry-RLC(AA), which lacks phosphorylation sites(Figure 2B). To examine myosin RLC dynamics alongside MLCK, we co-expressed mCherry-RLC with an MLCK FRET biosensor (Isotani et al., 2004) modified to include the brighter mCer3 cyan FP (Markwardt et al., 2011) (Figure 2B). Image capture times were similar for heterotransfer and homotransfer sensors and ranged between 200 ms and 1 s depending on the expression level. Cells were plated on an uncoated glass coverslip to promote myosin dephosphorylation. Depolarization of the cell with KCl activated the MLCK sensor and caused a coincident increase in cytoplasmic mCherry-RLC polarization (Figures 2C, white arrows, 2D, and 2F). Changes in nuclear RLC phosphorylation were less apparent (Figures 2C, oval, 2E and 2F), although the MLCK sensor reported activation in both the nucleus and cytoplasm (Figures 2D, 2E, and 2G). Expression of the mCherryRLC(AA) mutant blocked myosin sensor response to KCl (Figure 2H) but did not affect MLCK sensor activation (Figure 2I).
Figure 2. MLCK Activity and RLC Phosphorylation.

(A and B) REF52 fibroblasts expressing WT mCherry-RLC (A) or mCherry-RLC(AA) (B) were left untreated or incubated with 20 μM ML-7 to inhibit MLCK (5 min; n > 18 biological replicates; bars indicate SD; ****p < 0.0001 t test).
(C) A REF52 cell coexpressing an MLCK biosensor and mCherry-RLC was plated on an uncoated glass coverslip and treated with 90 mM KCl to activate MLCK. MLCK biosensor (CFP, YFP) and mCherry-RLC polarization (P, S) images before stimulation are shown. Increases in MLCK CFP/ YFP FRET-ratios and mCherry-RLC anisotropies are represented by the indicated color scheme. Scale bar, 10 μm. Activation of both sensors was observed in the cytoplasm (white arrows). Activation of MLCK in the nucleus (oval) was also observed.
(D and E) Normalized ratio changes for MLCK (CFP/YFP) and myosin RLC (P/S) are plotted for selected regions of interest for the cytoplasm (D), and the nucleus (E). KCL was added ∼5 min from the initiation of the experiment.
(F and G) Data were normalized to the mean of the first 10 ratios. Changes in nuclear and cytoplasmic mCherry-RLC (F) and MLCK (G) were quantified across 10 cells.
(H and I) Control experiments were performed in cells expressing mCherry-RLC(AA) (H) and the MLCK sensor (I) (p < 0.05, t test; n = 10 biological replicates, bars are SD).
MLCK activity and myosin phosphorylation were next examined in randomly migrating REF52 cells plated on an FN matrix (Figure 3). Ratiometric images for the MLCK sensor and anisotropy subtraction images for myosin RLC phosphorylation are shown at the onset of data collection and 30 min later (Figure 3A). A kymograph was generated at the indicated line (Figure 3B) and shows persistent colocalization of MLCK activation and high anisotropy regions of mCherry-RLC, consistent with NMMII phosphorylation. MLCK activity and RLC phosphorylation colocalized at the leading and retracting edges of the cell. In cells expressing wild-type (WT) myosin RLC, increased myosin phosphorylation was observed at the leading edge compared to AA myosin RLC controls (Figure 3C). Expression of AA myosin RLC did not affect activation of the MLCK biosensor (Figure 3D), which was activated at the leading edge compared to the cell interior. Interestingly, retraction progressed in two stages; an initial “slow” phase characterized by the presence of both phosphorylated myosin and MLCK activity, followed by a rapid phase lacking either phosphorylated myosin or MLCK activation.
Figure 3. MLCK Activity and RLC Phosphorylation in Cell Migration.

(A) MLCK activity, represented by a ratio image, and myosin phosphorylation,indicated by normalized subtraction, are shown for a randomly migrating REF52 over a 30-min period.
(B) Kymographs were generated for pixels positioned along the orange line toshow changes over time. Arrows identify colocalized MLCK activation and RLC phosphorylation. Scale bars, 10 μm.
(C) RLC anisotropy values within 3 mm of the detectable cellular edge were elevated compared to mutant RLC(AA) (n > 10 biological replicates; **p < 0.01 by t test; bars indicate mean and SD).
(D) The MLCK sensor was similarly activated at the edges of WT and mutantRLC expressing cells in the same region (p > 0.05, t test; bars indicate SD). FRET ratios were normalized to values in the middle of the cytoplasm.
To look more closely at RLC phosphorylation during retraction, we applied PDGF to a cell protrusion with a microfluidic pipette (Ainla et al., 2012). Rhodamine was used to mark the area under stimulation, and application of the fluorescent dye alone did not observably affect cell morphology (Figure 4A). PDGF stimulation resulted in the retraction of a cell protrusion initiating ∼5 min into the treatment (Figures 4A and 4B). The morphology of the cell outside of the treatment area did not undergo substantial alterations. Before retraction, the tip of the protrusion contained stable high-anisotropy phosphorylated regions (Figure 4B). Retraction proceeded through a multi-phasic process similar to those during random migration. Initially, cytoskeletal movements were observed 10–20 μm deep into the protrusion (Figure 4C, white arrows). These were followed by a slow retraction with elevated RLC anisotropy maintained at the tip of the retracting edge (Figure 4C, preceding the pink arrow). Myosin dephosphorylation, both at the leading edge (Figure 4C, following the pink arrow) and internally (Figure 4C, blue arrow), was associated with an increase in the speed and magnitude of retraction. Changes in myosin RLC anisotropy were quantified along the retracting edge for the duration of the experiment (Figure 4D). RLC-anisotropy decreased alongside displacement of the cellular edge. Anisotropy of mCer3-RLC(AA) at the edge did not significantly change after 10 min of PDGF treatment (p > 0.05; t test versus pre-stimulation levels). The PDGFinduced retraction was not significantly affected by expression of mCer3-RLC(AA) compared to mCer3-RLC WT (p > 0.05, t test using 10-min time points).
Figure 4. RLC Phosphorylation during Retraction of a Cell Protrusion.

(A–C) Localized changes in RLC phosphorylation were stimulated using a microfluidic pipette to deliver 10 ng/mL PDGF to one portion of a REF52 cell expressing mCer3-RLC.
(A) Rhodamine (in red) was used to mark the area of stimulation for several minutes before addition of PDGF. The P image of mCer3-RLC presented(cyan).
(B) Fluorescence anisotropies are represented bythe indicated color scale. Pixel intensities from the yellow bar (top right) were used to create a kymograph. Scale bar, 10 μm.
(C) Application of rhodamine (red) and PDGF (cyan) are indicated by the bars. The white arrows mark a PDGF-dependent shift in phosphorylated RLC that precedes an increase in the rate of retraction (pink arrow). Rapid myosin dephosphorylation during this phase is indicated by the blue arrow.
(D) RLC anisotropy values (black) and were calculated within 3 μm of the retracting edge for cells expressing WT RLC or AA RLC. Displacement of the edge from the initial position is indicated in blue (n = 10 biological replicates, bars indicate SEM, a reference baseline at y = 0 [gray] was drawn for clarity). PDGF was added at time 0. WT RLC anisotropies were significantly less than pre-stimulation levels 10 min after PDGF treatment (p < 0.01, t test).
Activation of p190RhoGAP (Ro¨ nnstrand and Heldin, 2001), which deactivates RhoA and promotes dissolution of actomyosin fibers (Ridley et al., 1993), is a likely mechanism. In support of this hypothesis, local PDGF treatment reduced RhoA biosensor activity during retraction, especially during the rapid phase (Figure S4).
Whole Organism piSPIM Imaging of the NMMII Phosphorylation Biosensor
We next explored RLC phosphorylation dynamics in developing C. elegans embryos expressing GFP-MLC-4 (Gally et al., 2009), a C. elegans homolog of NMMII RLC. Due to the specimen thickness and light sensitivity of developing C. elegans embryos, we adapted inverted selective plane illumination microscopy (iSPIM) for polarization FRET imaging. Light sheet microscopy restricts illumination to an optical section, limiting light exposure to the sample. This minimizes photodamage compared to other technologies (Huisken and Stainier, 2009) and enables long-term observation of developing organisms. Compared to widefield microscopy, exposure times were reduced at least 10-fold from over 200 ms to 20 ms. The iSPIM approach mounts both the light sheet and the collecting objective lenses at the top of an inverted microscope, which facilitates imaging of living specimens.
An iSPIM system was adapted for polarization experiments by incorporating an image-splitting device fitted with polarization optics in front of the detection camera. A half-wave plate was used to rotate the laser polarization systematically and optimally align it to the collection optics (Figure S5). Anisotropies of GFPlabeled beads (Piston and Rizzo, 2008) in piSPIM were similar to measurements made in widefield microscopy (Figure S5B). Embryos expressing GFP-MLC-4 were imaged as soon as fluorescence was detectable by eye, before the start of elongation. Three-dimensional z stacks that spanned the entire embryo were collected every 5 min until hatching, indicating that the approach was gentle enough for long duration (∼7 hr) imaging of C. elegans embryonic development. Embryonic time was estimated from the hatching point. Embryo morphologies at key milestones were consistent with unperturbed development (Figure S6).
The distribution of phosphorylated GFP-MLC-4 was examined at different developmental stages (Figure 5). Early expression was confined to the seam epidermal cells (Figure 5A). Phosphorylated myosin was localized along the cell periphery, mainly in puncta, but also indiscriminately along all edges of these cells (Figure 5B, arrows). In the stage preceding twitching, the discrete localization becomes less pronounced (Figure 5C), and the peripheral localization of phosphorylated RLC remained, both longitudinal and transverse (arrows) to the dorsal-ventral axis (Figure 5D). At the onset of twitching (Figures 5E and 5F), the transverse component becomes less apparent (Figure 5F, arrows). In contrast, the longitudinal distribution became more pronounced through the later stages of elongation (Figures 5G and 5H) and was maintained through cuticle synthesis (Figures 5I and 5J). The orientation and length of contiguous phosphorylated fibers were quantified in subtraction images using a neurite tracer plugin in FIJI. Post-twitch myosin phosphorylation redistributed perpendicularly to the transverse axis of the egg (Figures 5K and 5L). The length of measurable phospho-myosin fibers significantly increased after the onset of twitching (Figure 5M), compared to measurements made in the comma stage (n = 5 embryos). These changes grew more pronounced in later stages compared to earlier ones as phosphorylated GFP-MLC-4 became more distinctly localized to the seam cells.
Figure 5. RLC Phosphorylation during Embryonic Development in C. elegans.

(A–J) Changes in phosphorylated GFP-MLC-4 distribution were followed using piSPIM. Embryos were imaged starting at the first signs of GFP-MLC-4 expression. Z stacks were taken every 5 min until hatching. Comma (A and B), pre-twitching (C and D) and post-twitching (E and F) 2-fold, late elongation (G and H), and post-cuticle induction (I and J) stages are shown. Maximum intensity projections derived from image volumes for deconvolved S polarization images are shown alongside normalized subtraction images that indicate the location of GFP-MLC-4 phosphorylation (r > 0.27) (A, C, E, G, and I). Parallel striations in (C) and (E) result from under-sampling in the z dimension. Boxed regions of interest were enlarged (B, D, F, H, and J). In the comma stage, (B) phosphorylated myosin is organized around cell exterior (arrows and dashed lines) without apparent preference. Beginning in the twitching stage, myosin phosphorylation primarily becomes organized longitudinally to the embryo axis (compare pre-twitch, D, and post-twitch, F); arrows highlight the transverse organization in the pre-twitch state that is lost once twitching begins). This distribution becomes more pronounced as the embryo develops (H and J, arrows). Scale bars, 10 μm.
(K–M) The orientation (L) and length (M) of contiguous phosphomyosin regions were quantified in maximum intensity projections of subtraction images for embryos at the indicated stages (n = 5 biological replicates). Orientations were normalized to the transverse axis (K) of the egg. Mean values were compared to the comma phase (ANOVA, Dunnett’s multiple comparison test; NS, p > 0.05; ***p < 0.001; ****p < 0.0001; bars indicate SD)
To quantify the amount of myosin RLC phosphorylation at each stage, we devised an approach that takes advantage of the large volume of information generated during a piSPIM experiment. Typically, around 5,000 images are collected that contain both P and S views. Although <1% of the pixels had an adequate signal above background for computational purposes, there were still an ample number of pixels per threedimensional volume (∼104 to ∼105) for quantitative analysis. The variance for a single anisotropic state was estimated using C. elegans embryos expressing GFP-histone (Figure S7A). Unlike GFP-MLC-4, the anisotropy of GFP-histone remained constant until hatching over a ∼6 hr period (Figure S7B). The distribution of GFP pixel anisotropies converges on a singlecomponent Gaussian fit (Figure S7C), indicating the presence of a single anisotropic state. Measured standard deviations were consistent through three independent experiments (Figure S7D) and were used for quantitative analysis of GFPMLC-4 image data.
The mean anisotropies of the two GFP-MLC-4 states were then estimated using quantitative analysis. Pixel anisotropies from a ∼6 hr GFP-MLC-4 imaging experiment (5-min intervals, 60 frames/vol, 55 ms/frame) were pooled together and fit using a two-state Gaussian model. The SD of GFP-histone fluorescence was used as a constraint. Figure 6A shows the distributions of the high-FRET (blue) and phosphorylated MLC (red) components. The analysis was repeated for 5 independent datasets, and the mean anisotropies of the two states converged well (Figure 6B).
Figure 6. Quantification of GFP-MLC-4 FRET Dynamics during C. elegans Embryonic Development.

(A) To calculate the anisotropies of the two GFPMLC-4 conformational states, we compiled data from a piSPIM imaging session of a GFP-MLC-4 expressing embryo. The embryo was imaged from comma to hatching, with one 60-frame z stack acquired every 5 min over an ∼7 hr period. Pixel anisotropy values from ∼5,000 images were pooled together, and the distribution of values was fit to a two-component Gaussian distribution (gray). Individual components for the FRET (blue) and phosphorylated states (red) are shown.
(B) Calculated mean anisotropy values for eachstate are shown from 5 biological replicates. Bars indicate mean ± SD.
(C) Changes in GFP-MLC-4 levels throughout the development was quantified by calculating the total fluorescence for each time point (n = 3 biological replicates, bars = SEM, developmental times were normalized to hatching [min]).
(D and E) Pixel anisotropy values for each time point were then fit to a two-state Gaussian model. Peak amplitudes for each state were then used to calculate the relative percentage of phosphorylated pixels (D, n = 3 biological replicates, bars = SEM), and the quantity (E, n = 3 biological replicates, bars = SEM, FRET pixels are blue, and phosphorylated pixels are red).
GFP-MLC-4 expression and phosphorylation were quantified using the mean anisotropies of the two identified states. Three independent piSPIM datasets spanning from pre-elongation to hatching were analyzed. For each time point, GFPMLC-4 pixel data were extracted, and information from each z stack was pooled together for analysis. Time points were normalized to hatching to estimate the age of the embryo, and the total fluorescence (Figure 6C) was calculated. The percent phosphorylated GFP-MLC-4 (Figure 6D) and quantity of each GFP-MLC-4 state were calculated using values generated from a two-state Gaussian fit (Figure 6E). GFP-MLC-4 fluorescence rises sharply throughout the early elongation period. Once elongation ends, GFP-MLC-4 fluorescence reaches a steady state and then slowly declines until hatching. The percentage of phosphorylated myosin RLCs displayed an inverted trend compared to overall fluorescence. This was strongly reflected by changes in the dephosphorylated pool, which was more dynamic than the phosphorylated RLC pool (Figure 6E). Phosphorylated myosin levels rose steadily through elongation and persisted until the beginning of cuticle synthesis. These results suggest that changes in GFP- MLC-4 expression are uncoupled from regulation of myosin-RLC phosphorylation and function.
DISCUSSION
FRET Reveals RLC Phosphorylation
Taking advantage of the natural dimeric character of myosin RLC, we observe changes in homotransfer FRET between FPlabeled myosin RLC proteins that are associated with phosphorylation. Stimulation of stress fiber formation increased the measured anisotropy, indicating reduced homotransfer. Direct mutation of the phosphorylation sites modulated fluorescence anisotropies in a manner consistent with manipulation of homotransfer FRET in FP-RLCs. Further, changes in RLC anisotropy are independent of binding to fibers, as treatment with latrunculin A did not affect FP-RLC(DD) anisotropy. These results indicate that phosphorylation-mediated effects on RLC-FP homotransfer FRET are the primary mechanism underlying the observed anisotropy changes.
Previous FRET-based approaches to measuring RLC phosphorylation in living cells include in vitro myosin labeling and microinjection (Post et al., 1994, 1995) and a two-color FRETbased sensor (Yamada et al., 2005). Even so, these methods are not easily combined with secondary measures because two-color FRET approaches occupy much of the useful visible spectrum. Here, we show that the anisotropy RLC approach can be flexibly deployed using cyan, green, and red FPs, making it optically compatible with existing reagents. Thus, the RLC phosphorylation biosensor can be paired with other optical tools, including classic cyan/yellow FRET biosensors (Figures 2 and 3), or indicator dyes for marking chemical application with a microfluidic pipette (Figure 4). When combined with piSPIM, the dynamics of myosin RLC phosphorylation can be followed in vivo (Figures 5 and 6).
Phosphorylated RLC regions can be readily identified using a normalized subtraction image processing protocol that takes advantage of their high anisotropy. Scaling the intensity of the isotropic S image allows masking of low anisotropy, dephosphorylated regions when subtracted from the P image. Unlike ratiometric representations, normalized subtraction preserves intensity differences within the image that result from myosin compartmentalization as it binds actin fibers. Thus, image subtraction was effective at identifying phosphorylated RLCs, particularly in images that also contained a substantial pool of inactive myosin. For example, during the peak of GFP-MLC-4 expression, the proportion of dephosphorylated to phosphorylated GFP-MLC-4 is approximately 5 to 1 (Figure 6D).
Compared to other optical sectioning technologies, like confocal or two-photon microscopy, the iSPIM approach is particularly beneficial for polarization imaging (Hedde et al., 2015). Notably, iSPIM allows for full-frame imaging with a highquantum yield camera, thereby reducing scanning in volumetric imaging to a single dimension along the optical detection axis. This increases data collection speeds (in this study, ∼18 frames per second) and enables simultaneous collection of both P and S images using an image splitting device. Incorporating polarization into iSPIM is fairly straightforward. Alternatively to the solution described here, Hedde et al. (2015) constructed a similar configuration using fiber optic-coupled lasers and a custom-built image splitting strategy for polarization imaging in fibroblasts.
The volume of data generated by piSPIM allowed us to perform a more extensive quantitative analysis of RLC phosphorylation than is typically permitted when pixels are pooled together for statistical analysis by hand-selected regions of interest. Although we considered the latter approach, we decided to pursue an alternative data analysis strategy for several reasons. First, the multi-dimensionality of the data was difficult to reduce using hand-selected regions of interest. Second, we needed to identify the anisotropies of both the phosphorylated and the dephosphorylated states to locate phosphorylated RLC by normalized image subtraction. This would have been difficult using hand-selected regions of interest. Processing data at the pixel level also turned out to be computationally efficient, because it allowed us to bypass visualization and subsequent analysis at the whole image level.
Dynamic RLC Phosphorylation in Fibroblasts
Our studies on myosin phosphorylation in single cells revealed noteworthy insights about regulation of the actomyosin cytoskeleton by MLCK. In response to KCl, colocalization of MLCK activation and RLC phosphorylation was not uniform. Although cytoplasmic myosin RLC increased along with MLCK activation in the cytoplasm, nuclear myosin RLC did not, despite MLCK activation. This underscores the value of measuring myosin RLC independently of its regulators. Tighter colocalization of MLCK activation and myosin RLC phosphorylation was observed in a randomly migrating fibroblast. Interestingly, we found colocalization at both leading and trailing edges. MLCK colocalization with phosphorylated RLC persisted for the duration of the structure, suggesting that the MLCK activity may play a role in maintaining actomyosin fibers. Interestingly, the disappearance of both MLCK and myosin phosphorylation was associated with an increase in the rate of retraction. The retraction process was biphasic, where MLCK and myosin phosphorylation associated with the initial phase. Similarly, the disappearance of phosphorylated myosin is associated with faster retraction in response to local application of PDGF. This treatment also inactivated RhoA, which in turn promotes myosin phosphatase activity through decreased phosphorylation by Rho-kinase (Somlyo and Somlyo, 2003).
RLC Phosphorylation Dynamics in Embryonic C.elegans
NMMII phosphorylation has long been thought to be a pivotal control point for embryonic elongation. Direct regulators of MLC-4 phosphorylation, LET-502 kinase, and MEL-11 phosphatase have been shown to be complementary and essential regulators of actomyosin driven shape changes during elongation (Piekny et al., 2000; Wissmann et al., 1997). Genetic evidence points to the complexity of MLC-4 regulation at this developmental stage. NMMII kinases (Gally et al., 2009), upstream GTPases (Martin et al., 2016), and their regulators (Chan et al., 2015; Diogon et al., 2007; Martin et al., 2014) are all thought to provide essential contributions to the developmental program. Indeed, our data show that the percentage of phosphorylated MLC-4 falls throughout elongation, even though gene transcription of LET-502, MEL-11, and MLC-4 rise and peak at the end of this stage (Boeck et al., 2016). In contrast, the amount of phosphorylated MLC-4 then remains steady through cuticle synthesis, suggesting essential functions for MLC-4 in these later stages of development. The mechanisms underlying these observations have yet to be determined, but our approach provides a tool for measuring changes in MLC-4 activity during embryonic development.
Our studies also suggest that the orientation of phosphorylated RLC changes during twitching. Mechanotransduction has been proposed as a driver of cellular differentiation (Zhang et al., 2011), and the alignment of strong mechanical forces along the dorsal:ventral axis (Vuong-Brender et al., 2017) is thought to play a role in shape development during elongation. Unlike in Drosophila (Rauzi et al., 2008; Simone and DiNardo, 2010) and zebrafish (Behrndt et al., 2012; Urven et al., 2006), the overall distribution of myosin does not favor the dorsal:ventral axis pre-twitching. This finding is supported by our piSPIM measurements of RLC phosphorylation. Even so, Vuong-Brender et al. (2017) found evidence that actin fibers begin aligning in the dorsal:ventral axis before twitching, and the force generation (i.e., mechanical stress) becomes increasingly aligned with this axis as elongation progresses. Our measurements suggest that once contraction begins, phosphorylated myosin aligns along this axis and remains throughout the remainder of development. Once cuticle synthesis initiates, the structural need for myosin II likely abates, as we see a steady decrease in the quantity of phosphorylated RLC through hatching.
STAR★METHODS
Detailed methods are provided in the online version of this paper and include the following:
- EXPERIMENTAL MODEL AND SUBJECT DETAILS
-
○Cell culture
-
○C. elegans strain culture
-
○
- METHOD DETAIL
-
○Construct preparation
-
○Widefield microscopy
-
○Antibody staining
-
○Preparation of EGFP-labeled beads
-
○piSPIM setup
-
○
- QUANTIFICATION AND STATISTICAL ANALYSIS
-
○Data analysis for widefield experiments
-
○piSPIM image analysis
-
○Statistical analysis
-
○Normalized Subtraction Image Processing
-
○Phosphomyosin path tracing
-
○Deconvolution
-
○
STAR★METHODS
KEY RESOURCES TABLE
| REAGENT or RESOURCE | SOURCE | IDENTIFIER |
|---|---|---|
| Antibodies | ||
| Phospho-myosin light chain 2 (Thr18,Ser19) | Cell Signaling Technology | 3674P, RRID: AB_10858220 |
| Donkey anti-Rabbit, Alexa 594 conjugate | Jackson Immunoresearch | 711–585-152 RRID: AB_2340621 |
| Chemicals, Peptides, and Recombinant Proteins | ||
| PDGF-BB, human recombinant | PeproTech | Cat# 100–14B |
| Fibronectin, from Bovine plasma | Sigma | Cat# F1141 |
| ML-7 | Millipore | Cat# 475880 |
| LipoD293 | SingaGen | Cat# SL100668 |
| Rhodamine 101 | Sigma | Cat# 83694 |
| HiTrap Chelating HP columns | GE Healthcare | Cat# 17–0408-0 |
| Latrunculin A | Sigma | Cat# L5163 |
| Critical Commercial Assays | ||
| QuikChange XL-II site-directed mutagenesis kit | Agilent | Cat# 200521 |
| Experimental Models: Cell Lines | ||
| REF52 cells | J. Kao lab | RRID:CVCL_6848 |
| Experimental Models: Organisms/Strains | ||
|
C. elegans, Strain ML1148 (GFP-MLC4) mlc-4 (or253)/qC1; mcEx399{mlc-4p::GFP::mlc4WT, rol-6 (su1006) |
Labouesse lab | N/A |
|
C. elegans, Strain BV24 (GFP-histone) ltIs44 [pie-1p-mCherry::PH (PLC1delta1) + unc-119 (+)]; zuIs178 [(his-72 1kb::HIS-72::GFP); unc-119 (+)] V] |
Bao lab | N/A |
| Oligonucleotides | ||
| Primer, myosin RLC forward TTTTCTCGAGTTATGTCCAGCAAGC GGGCC |
Integrated DNA Technologies (IDT) |
N/A |
| Primer, myosin RLC reverse GGCCGGATCCCTAGTCGTCTTTATCCTT | IDT | N/A |
| Primer, RLC T19D/S20D sense CAAGAAGCGGCCACAGCGGGCCG ATGACAATGTCTTCGCAATGTTTGAC |
IDT | N/A |
| Primer, RLC T19/S20D antisense GTCAAACATTGCGAAGACATTGT CATCGGCCCGCTGTGGCCGCTTCTTG |
IDT | N/A |
| Primer, RLC T19A/S20A sense GCCACAGCGGGCCGCAGCCAAT GTCTTCGC |
IDT | N/A |
| Primer, RLC T19A/S20A antisense GCGAAGACATTGGCTGCGGCCC GCTGTGGC |
IDT | N/A |
| mCer3 for MLCK, forward, TTTTACCGGTAGCAAGGG CGAGGAGC | IDT | N/A |
| mCer3 for MLCK, reverse, TTTTCTCGAGGTCACTTG TACAGCTCGT CCATGC |
IDT | N/A |
| Rho-binding domain/CFP fragment forward, TTTTGCTAGCACCATG GCACACCATCACC |
IDT | N/A |
| Rho-binding domain/CFP fragment forward, TTTAGCGGCCGCGCCA CTACCACC |
IDT | N/A |
| mCer3 for RhoA sensor, forward, GGAATGGTGAGCAAGGGCGAGG | IDT | N/A |
| mCer3 for RhoA sensor, forward, TTGAGCTCGAGATCTGAGTCCGG | IDT | N/A |
| Recombinant DNA | ||
| Myosin II RLC, human MYL9 (10398) | Open Biosystems | NM_006097 |
| Plasmid: mCer3-RLC | This paper | N/A |
| Plasmid: mCer3-RLC (T19A/S20A) | This paper | N/A |
| Plasmid: mCer3-RLC (T19D/S20D) | This paper | N/A |
| Plasmid: pEGFP-RLC | This paper | N/A |
| Plasmid: EGFP-RLC (T19A/S20A) | This paper | N/A |
| Plasmid: EGFP-RLC (T19D/S20D) | This paper | N/A |
| Plasmid: H6-EGFP | Rizzo et al., 2006 | N/A |
| Plasmid: mCherry-RLC | This paper | N/A |
| Plasmid: mCherry-RLC (T19A/S20A) | This paper | N/A |
| Plasmid: mCherry-RLC (T19D/S20D) | This paper | N/A |
| Plasmid: MLCK (mCer3) biosensor | This paper | N/A |
| Plasmid: RhoA (mCer3) biosensor | This paper | N/A |
| Software and Algorithms | ||
| Axiovision 4.8 | Carl Zeiss Microscopy | N/A |
| Prism 7.0 | GraphPad | https://www.graphpad.com |
| FIJI | Schindelin et al., 2012 | http://www.fiji.se |
| R | The R project | https://www.r-project.org |
| RStudio | R Studio | https://www.rstudio.com |
| Bioconductor | Bioconductor | http://bioconductor.org |
| MATLAB | Math Works | https://www.mathworks.com |
| Pixelmator 3.6 | Pixelmator | https://www.pixelmator.com/ |
| Graphic | Indeeo | https://graphic.com |
| Excel | Microsoft | https://www.microsoft.com |
| MIPAV | NIH | https://mipav.cit.nih.gov |
| Other | ||
| Dual-view image splitter for widefield | Optical Insights | Model# DV1 |
| ORCA-R2 CCD camera for widefield | Hamamatsu | Cat# C10600–1 OB |
| W-view Gemini image splitter for piSPIM | Hamamatsu | Cat# A12801–01 |
| Wire Grid Polarizers for W-view | Meadowlark Optics | Versalight Polarizers |
| Half wave plate for piSPIM | Thoriabs | Cat# WPH10M-488 |
| iXon EM-CCD for piSPIM | Andor | Model # DU-897T |
CONTACT FOR REAGENT AND RESOURCE SHARING
Please direct all inquiries and requests for reagents or resources to M. Rizzo (mrizzo@som.umaryland.edu).
EXPERIMENTAL MODEL AND SUBJECT DETAILS
Cell culture
REF52 rat embryonic fibroblasts were a generous gift from Dr. Joseph Kao (University of Maryland School of Medicine). They were maintained at 37C in Dulbecco’s Modified Eagle’s Medium (Mediatech) containing 10% fetal bovine serum (Hyclone) and 100U/ml streptomycin and 100U/ml penicillin (Hyclone). Transfections were performed using LipoD293 from SignaGEN, as per the manufacturer’s instructions 24–48 h before experimentation. Before imaging, media was replaced with Hank’s Balanced Salt Solution (GIBCO) supplemented with 0.1% BSA. For imaging, cells were either directly plated on glass-bottom dishes (MatTek) containing No. 1.5 coverslips, or dishes treated with 10 mg/ml FN from human plasma (Sigma) in sterile-filtered PBS for 1 h before plating.
C. elegans strain culture
Strains used in this paper include BV24 ([ltIs44 [pie-1p-mCherry::PH (PLC1delta1) + unc-119 (+)]; zuIs178 [ (his-72 1kb::HIS-72::GFP); unc-119 (+)] V]) and ML1148 [mlc-4 (or253)/qC1; mcEx399;mlc-4p::GFP::mlc4WT, rol-6 (su1006)] (Gally et al., 2009). Strain BV24 was obtained from the Bao lab, and strain ML1148 was obtained from the Labouesse lab. Strains were raised at 20C on NGM media seeded with OP50 E. coli. For imaging, gravid adults were placed in a watch glass containing M9 buffer and were cut in half to liberate embryos. Embryos were transferred via pipette onto a poly-L-lysine coated coverslip in an iSPIM imaging chamber filled with M9 buffer for C. elegans and imaged as previously described (Wu et al., 2011).
METHOD DETAIL
Construct preparation
Human myosin II regulatory light chain was amplified by PCR and subcloned into mCer3-C1 (Markwardt et al., 2011), pEGFP-C1 (Clontech) or mCherry-C1 (Shaner et al., 2004) using XhoI and BamHI restriction sites. Phosphorylation site mutations were made using the QuikChange methodology (Agilent). A brighter variant of an existing MLCK sensor (Isotani et al., 2004) was also generated by swapping the previous CFP for mCer3. To accomplish this, mCer3 was amplified by PCR, and inserted into the existing sensor using XhoI and AgeI restriction sites. Similarly, an existing RhoA (Pertz et al., 2006) sensor was modified to incorporate mCer3 by first amplifying the segment containing ECFP and the Rho-binding domain. This sequence was subcloned into the EGFP position in the pEGFP-N3 vector using NheI and NotI restriction sites. mCer3 was then amplified from the pmCer3-C1 vector and exchanged for ECFP using NheI and BsrGI. The newly made Rho-binding domain-mCer3 sequence was re-amplified and inserted into the original vector using NcoI and NotI restriction sites.
Widefield microscopy
FRETexperimentswereperformedonZeissAxioObserverwidefieldsystemsconfiguredfor fluorescencepolarizationmicroscopy(Desmond et al., 2015). A polarizer was introduced between the light source and fluorescence filter cube (Figure S1A) (Piston and Rizzo, 2008). P and S polarizations were separated using either an Optical Insights Dual-view containing the manufacturer’s polarization-splitting filter set (Desmond et al., 2015) or a custom-configured W-view (Hamamatsu) (Figure S1A). 455 LED illumination was used for exciting mCer3 and the MLCK sensor, and collection used standard high-efficiency filter sets for cyan and yellow fluorescent proteins (Zeiss) located in the microscope reflector turret. 530nm excitation and the Zeiss dsRed high-efficiency filter set were used for mCherry illumination.Alexa-594 imaging was performed with 590nm LED excitation and a matching red Zeiss filter cube (#63HE).A 1.6 × Optovar lens was moved into the collection path for increased magnification for the immunostaining studies. Objective lenses (Zeiss) used in this study were a 20 ×, 0.75 NA plan-apochromat and a 40 ×, 1.3 oil plan-apochromat. Cooled CCDs, either an ORCA-R2 (Hamamatsu) or Axiocam 506 (Zeiss), were used to collect images. Typical exposure times ranged from 0.2 to 1 s per image.
Antibody staining
REF52 cells were fixed and stained as previously described (Ding et al., 2011), using rabbit antibodies for phospho-myosin light chain 2 (Cell Signaling Technologies) and an Alexa 594 conjugated secondary (Jackson Immunoresearch).
Preparation of EGFP-labeled beads
Agarose beads were liberated from HiTrap columns (GE Healthcare) and labeled with recombinant H6EGFP protein. Bead (Piston and Rizzo, 2008) and protein preparation (Rizzo et al., 2006) were performed as previously described.
piSPIM setup
The iSPIM system was modified from our original, symmetric objective design (Wu et al., 2011), by using an asymmetric combination: a 0.3 NA excitation objective (Nikon 10 ×, 3.5mm working distance) to introduce the light-sheet, and a 1.0 NA detection objective (Zeiss, W Plan-Apochromat 63 ×, 2.1mm working distance) to collect fluorescence (Lakdawala et al., 2014). Emitted light was filtered through a 525/50 nm bandpass filter (Semrock). A tube lens (Applied Scientific Instrumentation, f = 250 mm) focused emitted fluorescence through an image splitter (Hamamatsu) equipped with wire grid polarizers (Meadowlark) to separate P and S polarizations (Figure S1B). An electron-multiplying charge coupled device (EM-CCD, Andor, iXon DU-897T) was used for detection. The 488 nm excitation power was set at 200 μW (as measured before the excitation objective), and the excitation polarization was adjusted by a rotatable half-wave plate (Thorlabs) (Figure S1B). The acquisition was modified to a stage-scanning mode in which the sample stage is translated through the stationary light sheet (Kumar et al., 2016). We recorded enough planes per volume for each embryo to fully span the entire embryo (a maximum of 60 planes), spacing planes every 1 μm. The exposure and readout time for each plane was set to 55 ms, corresponding to a maximum total time of 3.3 s per volume. For experiments that spanned from the comma stage to hatching, volumes were acquired every 5 min. Less expansive datasets were included for calculating anisotropies of the two RLC states. Imaging intervals ranged from 1 to 5 min over periods ranging from comma to hatching, with the total number of z stacks ranging from 30 to 100.
QUANTITATIVE AND STATISTICAL ANALYSIS
Data analysis for widefield experiments
Widefield P and S images were first split by selectively duplicating each respective half. Images were then recombined into separate channels and registered either in FIJI using the StackReg package (Thévenaz et al., 1998) or using AxioVision software. Mean pixel values from hand-selected regions of interest were used to quantify cellular and background fluorescence. Color-coded lookup tables for FRET images were applied in FIJI. Kymograph analyses in Figures 2C, 2D, and 3D were performed using both FIJI and R. Individual channel kymographs first generated from aligned images in FIJI and imported into R. Automated scripts were used to calculate anisotropy and FRET values. Threshold values were adjusted to align detected edges within 1 pixel for double FRET sensor studies. Anisotropy and FRET values within 3 microns of the edge were pooled together for analysis.
piSPIM image analysis
The raw images were first background-subtracted and transformed using an ImageJ macro. The transformation deskews the raw images acquired with stage-scanning mode so that they appear as conventional 3D stacks, viewed as if the light-sheet is scanned through a stationary sample (Kumar et al., 2016). Registration of P and S images was implemented in the open-source MIPAV programming environment as previously described (Wu et al., 2013). Data were then analyzed using the R programming language with the EBImage package (Bioconductor). Pixel anisotropy values were calculated for the entire dataset, and data for analysis was extracted using the following constraints: inclusion of intensity values in the P image between 4000 and 15680, and pixel anisotropy values between 0.1 and 0.4. Inclusion criteria were applied uniformly to each dataset. Curve fitting was performed using Prism software (GraphPad).
Statistical analysis
All statistical tests and curve fittings were performed in GraphPad Prism. For Student’s t tests, two-tailed, unpaired tests were run, and p < 0.05 was considered significant. The number of replicates, and nature of error bars (SD, SEM), are indicated in the figure legends.
Normalized Subtraction Image Processing
Scaling factors were calculated from theoretical P and S values and plotted against their anisotropy using the correction or ‘G factor’ (Piston and Rizzo, 2008) appropriate widefield and piSPIM microscopes (Figure S2). To mask pixels with anisotropies less than the determined value, the S image was multiplied by the scaling factor. The scaled S image was then subtracted from the P image using the Image Calculator function in FIJI.
Phosphomyosin path tracing
Quantitative image analysis of phosphomyosin fiber lengths and orientations were performed on maximum intensity projections derived from normalized subtraction images at the indicated embryonic stages. Images were smoothed, and contiguous phosphomyosin regions were traced using the ‘Simple Neurite Tracer’ FIJI plugin. Traces were skeletonized, and path length was quantified using the ‘Analyze Skeleton (2D/3D)’ plugin. Path orientations were measured by hand. Additional segmentation was performed on regions displaying sharp changes of direction at acute or right angles. Orientations were normalized to the transverse axis of the embryo.
Deconvolution
Where noted, constrained, iterative deconvolution was performed on three-dimensional datasets using Axiovision 4.8 software (Carl Zeiss Microscopy). A theoretical point spread function for deconvolution was generated using the specifications of the collecting piSPIM objective lens.
Supplementary Material
Highlights.
Homotransfer FRET reveals phosphorylated NMMII localization
Activated myosin light chain kinase associates with phosphorylated NMMII fibers
Polarization light sheet microscopy enables FRET imaging of C. elegans embryos
Phosphorylated myosin redistributes dorsoventrally at the onset of twitching
ACKNOWLEDGMENTS
This work was supported by NIH (R01DK077140, R01HL122827, R01MH111527, and R21OD018315 to M.A.R.), the intramural program of the National Institute of Biomedical Imaging and Bioengineering at the NIH (1ZIAEB000074 to H.S.), Shenzhen Innovation Funding (JCYJ20170818164343304 and JCYJ20170816172431715 to H.L.), the National Key Technology Research and Development Program of China (2017YFE0104000 to H.L.), and the National Natural Science Foundation of China (61525106, 61427807, and 61701436 to H.L.).
Footnotes
DECLARATION OF INTERESTS
The authors declare no competing interests.
SUPPLEMENTAL INFORMATION
Supplemental Information includes seven figures and can be found with this article online at https://doi.org/10.1016/j.celrep.2018.06.088.
REFERENCES
- Ainla A, Jeffries GD, Brune R, Orwar O, and Jesorka A (2012). A multifunctional pipette. Lab Chip 12, 1255–1261. [DOI] [PMC free article] [PubMed] [Google Scholar]
- Aldaz S, Escudero LM, and Freeman M (2013). Dual role of myosin II during Drosophila imaginal disc metamorphosis. Nat. Commun 4, 1761. [DOI] [PMC free article] [PubMed] [Google Scholar]
- Andrews N, Ramel MC, Kumar S, Alexandrov Y, Kelly DJ, Warren SC, Kerry L, Lockwood N, Frolov A, Frankel P, et al. (2016). Visualising apoptosis in live zebrafish using fluorescence lifetime imaging with optical projection tomography to map FRET biosensor activity in space and time. J. Biophotonics 9, 414–424. [DOI] [PMC free article] [PubMed] [Google Scholar]
- Behrndt M, Salbreux G, Campinho P, Hauschild R, Oswald F, Roensch J, Grill SW, and Heisenberg CP (2012). Forces driving epithelial spreading in zebrafish gastrulation. Science 338, 257–260. [DOI] [PubMed] [Google Scholar]
- Boeck ME, Huynh C, Gevirtzman L, Thompson OA, Wang G, Kasper DM, Reinke V, Hillier LW, and Waterston RH (2016). The time-resolved transcriptome of C. elegans. Genome Res. 26, 1441–1450. [DOI] [PMC free article] [PubMed] [Google Scholar]
- Burnette DT, Manley S, Sengupta P, Sougrat R, Davidson MW, Kachar B, and Lippincott-Schwartz J (2011). A role for actin arcs in the leading-edge advance of migrating cells. Nat. Cell Biol. 13, 371–381. [DOI] [PMC free article] [PubMed] [Google Scholar]
- Case LB, and Waterman CM (2015). Integration of actin dynamics and cell adhesion by a three-dimensional, mechanosensitive molecular clutch. Nat. Cell Biol 17, 955–963. [DOI] [PMC free article] [PubMed] [Google Scholar]
- Chan BG, Rocheleau SK, Smit RB, and Mains PE (2015). The Rho guanine exchange factor RHGF-2 acts through the Rho-binding kinase LET-502 to mediate embryonic elongation in C. elegans. Dev. Biol 405, 250–259. [DOI] [PubMed] [Google Scholar]
- Chew TL, Wolf WA, Gallagher PJ, Matsumura F, and Chisholm RL (2002). A fluorescent resonant energy transfer-based biosensor reveals transient and regional myosin light chain kinase activation in lamella and cleavage furrows. J. Cell Biol 156, 543–553. [DOI] [PMC free article] [PubMed] [Google Scholar]
- Conti MA, and Adelstein RS (2008). Nonmuscle myosin II moves in new directions. J. Cell Sci 121, 11–18. [DOI] [PubMed] [Google Scholar]
- Desmond PF, Muriel J, Markwardt ML, Rizzo MA, and Bloch RJ (2015). Identification of small ankyrin 1 as a novel sarco(endo)plasmic reticulum Ca2+-ATPase 1 (SERCA1) regulatory protein in skeletal muscle. J. Biol. Chem 290, 27854–27867. [DOI] [PMC free article] [PubMed] [Google Scholar]
- Ding SY, Nkobena A, Kraft CA, Markwardt ML, and Rizzo MA (2011). Glucagon-like peptide 1 stimulates post-translational activation of glucokinase in pancreatic beta cells. J. Biol. Chem 286, 16768–16774. [DOI] [PMC free article] [PubMed] [Google Scholar]
- Diogon M, Wissler F, Quintin S, Nagamatsu Y, Sookhareea S, Landmann F, Hutter H, Vitale N, and Labouesse M (2007). The RhoGAP RGA-2 and LET-502/ROCK achieve a balance of actomyosin-dependent forces in C. elegans epidermis to control morphogenesis. Development 134, 2469–2479. [DOI] [PubMed] [Google Scholar]
- Ewald AJ, Brenot A, Duong M, Chan BS, and Werb Z (2008). Collective epithelial migration and cell rearrangements drive mammary branching morphogenesis. Dev. Cell 14, 570–581. [DOI] [PMC free article] [PubMed] [Google Scholar]
- Förster T (1948). Zwischenmolekulare energiewanderung und fluo- reszenz., english translation. Annalen der Physik. 2, 55–74. [Google Scholar]
- Gally C, Wissler F, Zahreddine H, Quintin S, Landmann F, and Labouesse M (2009). Myosin II regulation during C. elegans embryonic elongation: LET-502/ROCK, MRCK-1 and PAK-1, three kinases with different roles. Development 136, 3109–3119. [DOI] [PubMed] [Google Scholar]
- Guo ZV, Li N, Huber D, Ophir E, Gutnisky D, Ting JT, Feng G, and Svoboda K (2014). Flow of cortical activity underlying a tactile decision in mice. Neuron 81, 179–194. [DOI] [PMC free article] [PubMed] [Google Scholar]
- Gutzman JH, Sahu SU, and Kwas C (2015). Non-muscle myosin IIA and IIB differentially regulate cell shape changes during zebrafish brain morphogenesis. Dev. Biol 397, 103–115. [DOI] [PubMed] [Google Scholar]
- Hedde PN, Ranjit S, and Gratton E (2015). 3D fluorescence anisotropy imaging using selective plane illumination microscopy. Opt. Express 23, 22308–22317. [DOI] [PMC free article] [PubMed] [Google Scholar]
- Huisken J, and Stainier DY (2009). Selective plane illumination microscopy techniques in developmental biology. Development 136, 1963–1975. [DOI] [PMC free article] [PubMed] [Google Scholar]
- Ikebe M, Hartshorne DJ, and Elzinga M (1986). Identification, phosphorylation, and dephosphorylation of a second site for myosin light chain kinase on the 20,000-dalton light chain of smooth muscle myosin. J. Biol. Chem 261, 36–39. [PubMed] [Google Scholar]
- Isotani E, Zhi G, Lau KS, Huang J, Mizuno Y, Persechini A, Geguchadze R, Kamm KE, and Stull JT (2004). Real-time evaluation of myosin light chain kinase activation in smooth muscle tissues from a transgenic calmodulin-biosensor mouse. Proc. Natl. Acad. Sci. USA 101, 6279–6284. [DOI] [PMC free article] [PubMed] [Google Scholar]
- Jares-Erijman EA, and Jovin TM (2003). FRET imaging. Nat. Biotechnol 21, 1387–1395. [DOI] [PubMed] [Google Scholar]
- Jones-Tabah J, Clarke PB, and Hébert TE (2017). Measuring G proteincoupled receptor signalling in the brain with resonance energy transfer based biosensors. Curr. Opin. Pharmacol 32, 44–48. [DOI] [PubMed] [Google Scholar]
- Kasza KE, Farrell DL, and Zallen JA (2014). Spatiotemporal control of epithelial remodeling by regulated myosin phosphorylation. Proc. Natl. Acad. Sci. USA 111, 11732–11737. [DOI] [PMC free article] [PubMed] [Google Scholar]
- Kelley M, Yochem J, Krieg M, Calixto A, Heiman MG, Kuzmanov A, Meli V, Chalfie M, Goodman MB, Shaham S, et al. (2015). FBN-1, a fibrillin-related protein, is required for resistance of the epidermis to mechanical deformation during C. elegans embryogenesis. eLife 4, e06565. [DOI] [PMC free article] [PubMed] [Google Scholar]
- Kim HY, Varner VD, and Nelson CM (2013). Apical constriction initiates new bud formation during monopodial branching of the embryonic chicken lung. Development 140, 3146–3155. [DOI] [PMC free article] [PubMed] [Google Scholar]
- Kumar A, Christensen R, Guo M, Chandris P, Duncan W, Wu Y, Santella A, Moyle M, Winter PW, Colón-Ramos D, et al. (2016). Using stageand slit-scanning to improve contrast and optical sectioning in dual-view inverted light sheet microscopy (diSPIM). Biol. Bull 231, 26–39. [DOI] [PMC free article] [PubMed] [Google Scholar]
- Kunida K, Matsuda M, and Aoki K (2012). FRET imaging and statistical signal processing reveal positive and negative feedback loops regulating the morphology of randomly migrating HT-1080 cells. J. Cell Sci. 125, 2381–2392. [DOI] [PubMed] [Google Scholar]
- Kuo J-C, Han X, Hsiao C-T, Yates JR 3rd, and Waterman CM (2011). Analysis of the myosin-II-responsive focal adhesion proteome reveals a role for b-Pix in negative regulation of focal adhesion maturation. Nat. Cell Biol 13, 383–393. [DOI] [PMC free article] [PubMed] [Google Scholar]
- Lakdawala SS, Wu Y, Wawrzusin P, Kabat J, Broadbent AJ, Lamirande EW, Fodor E, Altan-Bonnet N, Shroff H, and Subbarao K (2014). Influenza a virus assembly intermediates fuse in the cytoplasm. PLoS Pathog. 10, e1003971. [DOI] [PMC free article] [PubMed] [Google Scholar]
- Liang X, Holy TE, and Taghert PH (2016). Synchronous Drosophila circadian pacemakers display nonsynchronous Ca2+ rhythms in vivo. Science 351, 976–981. [DOI] [PMC free article] [PubMed] [Google Scholar]
- Mammoto T, and Ingber DE (2010). Mechanical control of tissue and organ development. Development 137, 1407–1420. [DOI] [PMC free article] [PubMed] [Google Scholar]
- Markova O, Sénatore S, Chardés C, and Lenne P-F (2015). Calcium spikes in epithelium: study on Drosophila early embryos. Sci. Rep 5, 11379. [DOI] [PMC free article] [PubMed] [Google Scholar]
- Markwardt ML, Kremers GJ, Kraft CA, Ray K, Cranfill PJ, Wilson KA, Day RN, Wachter RM, Davidson MW, and Rizzo MA (2011). An improved cerulean fluorescent protein with enhanced brightness and reduced reversible photoswitching. PLoS ONE 6, e17896. [DOI] [PMC free article] [PubMed] [Google Scholar]
- Martin E, Harel S, Nkengfac B, Hamiche K, Neault M, and Jenna S (2014). pix-1 controls early elongation in parallel with mel-11 and let-502 in Caenorhabditis elegans. PLoS ONE 9, e94684. [DOI] [PMC free article] [PubMed] [Google Scholar]
- Martin E, Ouellette MH, and Jenna S (2016). Rac1/RhoA antagonism defines cell-to-cell heterogeneity during epidermal morphogenesis in nematodes. J. Cell Biol 215, 483–498. [DOI] [PMC free article] [PubMed] [Google Scholar]
- Mattheyses AL, Hoppe AD, and Axelrod D (2004). Polarized fluorescence resonance energy transfer microscopy. Biophys. J 87, 2787–2797. [DOI] [PMC free article] [PubMed] [Google Scholar]
- Muto A, Ohkura M, Kotani T, Higashijima S, Nakai J, and Kawakami K (2011). Genetic visualization with an improved GCaMP calcium indicator reveals spatiotemporal activation of the spinal motor neurons in zebrafish. Proc. Natl. Acad. Sci. USA 108, 5425–5430. [DOI] [PMC free article] [PubMed] [Google Scholar]
- Padilla-Parra S, and Tramier M (2012). FRET microscopy in the living cell: different approaches, strengths and weaknesses. BioEssays 34, 369–376. [DOI] [PubMed] [Google Scholar]
- Pertz O, Hodgson L, Klemke RL, and Hahn KM (2006). Spatiotemporal dynamics of RhoA activity in migrating cells. Nature 440, 1069–1072. [DOI] [PubMed] [Google Scholar]
- Petrie RJ, Doyle AD, and Yamada KM (2009). Random versus directionally persistent cell migration. Nat. Rev. Mol. Cell Biol 10, 538–549. [DOI] [PMC free article] [PubMed] [Google Scholar]
- Piekny AJ, Wissmann A, and Mains PE (2000). Embryonic morphogenesis in Caenorhabditis elegans integrates the activity of LET-502 Rho-binding kinase, MEL-11 myosin phosphatase, DAF-2 insulin receptor and FEM-2 PP2c phosphatase. Genetics 156, 1671–1689. [DOI] [PMC free article] [PubMed] [Google Scholar]
- Piston DW, and Rizzo MA (2008). FRET by fluorescence polarization microscopy. Methods Cell Biol. 85, 415–430. [DOI] [PubMed] [Google Scholar]
- Post PL, Trybus KM, and Taylor DL (1994). A genetically engineered, protein-based optical biosensor of myosin II regulatory light chain phosphorylation. J. Biol. Chem 269, 12880–12887. [PubMed] [Google Scholar]
- Post PL, DeBiasio RL, and Taylor DL (1995). A fluorescent protein biosensor of myosin II regulatory light chain phosphorylation reports a gradient of phosphorylated myosin II in migrating cells. Mol. Biol. Cell 6, 1755–1768. [DOI] [PMC free article] [PubMed] [Google Scholar]
- Rauzi M, Verant P, Lecuit T, and Lenne PF (2008). Nature and anisotropy of cortical forces orienting Drosophila tissue morphogenesis. Nat. Cell Biol 10, 1401–1410. [DOI] [PubMed] [Google Scholar]
- Ridley AJ, Self AJ, Kasmi F, Paterson HF, Hall A, Marshall CJ, and Ellis C (1993). rho family GTPase activating proteins p190, bcr and rhoGAP show distinct specificities in vitro and in vivo. EMBO J. 12, 5151–5160. [DOI] [PMC free article] [PubMed] [Google Scholar]
- Rizzo MA, and Piston DW (2005). High-contrast imaging of fluorescent protein FRET by fluorescence polarization microscopy. Biophys. J 88, L14–L16. [DOI] [PMC free article] [PubMed] [Google Scholar]
- Rizzo MA, Springer G, Segawa K, Zipfel WR, and Piston DW (2006). Optimization of pairings and detection conditions for measurement of FRET between cyan and yellow fluorescent proteins. Microsc. Microanal 12, 238–254. [DOI] [PubMed] [Google Scholar]
- Rönnstrand L, and Heldin CH (2001). Mechanisms of platelet-derived growth factor-induced chemotaxis. Int. J. Cancer 91, 757–762. [DOI] [PubMed] [Google Scholar]
- Schindelin J, Arganda-Carreras I, Frise E, Kaynig V, Longair M, Pietzsch T, Preibisch S, Rueden C, Saalfeld S, Schmid B, et al. (2012). Fiji: an open-source platform for biological-image analysis. Nat. Methods 9, 676–682. [DOI] [PMC free article] [PubMed] [Google Scholar]
- Shaner NC, Campbell RE, Steinbach PA, Giepmans BN, Palmer AE, and Tsien RY (2004). Improved monomeric red, orange and yellow fluorescent proteins derived from Discosoma sp. red fluorescent protein. Nat. Biotechnol 22, 1567–1572. [DOI] [PubMed] [Google Scholar]
- Siedlik MJ, and Nelson CM (2015). Regulation of tissue morphodynamics: an important role for actomyosin contractility. Curr. Opin. Genet. Dev 32, 80–85. [DOI] [PMC free article] [PubMed] [Google Scholar]
- Simone RP, and DiNardo S (2010). Actomyosin contractility and Discs large contribute to junctional conversion in guiding cell alignment within the Drosophila embryonic epithelium. Development 137, 1385–1394. [DOI] [PMC free article] [PubMed] [Google Scholar]
- Somlyo AP, and Somlyo AV (2003). Ca2+ sensitivity of smooth muscle and nonmuscle myosin II: modulated by G proteins, kinases, and myosin phosphatase. Physiol. Rev 83, 1325–1358. [DOI] [PubMed] [Google Scholar]
- Somlyo AV, Bradshaw D, Ramos S, Murphy C, Myers CE, and Somlyo AP (2000). Rho-kinase inhibitor retards migration and in vivo dissemination of human prostate cancer cells. Biochem. Biophys. Res. Commun 269, 652–659. [DOI] [PubMed] [Google Scholar]
- Thévenaz P, Ruttimann UE, and Unser M (1998). A pyramid approach to subpixel registration based on intensity. IEEE Trans. Image Process 7, 27–41. [DOI] [PubMed] [Google Scholar]
- Urven LE, Yabe T, and Pelegri F (2006). A role for non-muscle myosin II function in furrow maturation in the early zebrafish embryo. J. Cell Sci 119, 4342–4352. [DOI] [PubMed] [Google Scholar]
- Vicente-Manzanares M, Koach MA, Whitmore L, Lamers ML, and Horwitz AF (2008). Segregation and activation of myosin IIB creates a rear in migrating cells. J. Cell Biol 183, 543–554. [DOI] [PMC free article] [PubMed] [Google Scholar]
- Vicente-Manzanares M, Ma X, Adelstein RS, and Horwitz AR (2009). Non-muscle myosin II takes centre stage in cell adhesion and migration. Nat. Rev. Mol. Cell Biol 10, 778–790. [DOI] [PMC free article] [PubMed] [Google Scholar]
- Vuong-Brender TT, Ben Amar M, Pontabry J, and Labouesse M (2017). The interplay of stiffness and force anisotropies drives embryo elongation. eLife 6, e23866. [DOI] [PMC free article] [PubMed] [Google Scholar]
- Vuong-Brender TTK, Boutillon A, Rodriguez D, Lavilley V, and Labouesse M (2018). HMP-1/α-catenin promotes junctional mechanical integrity during morphogenesis. PLoS ONE 13, e0193279. [DOI] [PMC free article] [PubMed] [Google Scholar]
- Wissmann A, Ingles J, McGhee JD, and Mains PE (1997). Caenorhabditis elegans LET-502 is related to Rho-binding kinases and human myotonic dystrophy kinase and interacts genetically with a homolog of the regulatory subunit of smooth muscle myosin phosphatase to affect cell shape. Genes Dev. 11, 409–422. [DOI] [PubMed] [Google Scholar]
- Wu YI, Frey D, Lungu OI, Jaehrig A, Schlichting I, Kuhlman B, and Hahn KM (2009). A genetically encoded photoactivatable Rac controls the motility of living cells. Nature 461, 104–108. [DOI] [PMC free article] [PubMed] [Google Scholar]
- Wu Y, Ghitani A, Christensen R, Santella A, Du Z, Rondeau G, Bao Z, Colön-Ramos D, and Shroff H (2011). Inverted selective plane illumination microscopy (iSPIM) enables coupled cell identity lineaging and neurodevelopmental imaging in Caenorhabditis elegans. Proc. Natl. Acad. Sci. USA 108, 17708–17713. [DOI] [PMC free article] [PubMed] [Google Scholar]
- Wu Y, Wawrzusin P, Senseney J, Fischer RS, Christensen R, Santella A, York AG, Winter PW, Waterman CM, Bao Z, et al. (2013). Spatially isotropic four-dimensional imaging with dual-view plane illumination microscopy. Nat. Biotechnol 31, 1032–1038. [DOI] [PMC free article] [PubMed] [Google Scholar]
- Xu H, Kardash E, Chen S, Raz E, and Lin F (2012). Gbg signaling controls the polarization of zebrafish primordial germ cells by regulating Rac activity. Development 139, 57–62. [DOI] [PMC free article] [PubMed] [Google Scholar]
- Yamada A, Hirose K, Hashimoto A, and Iino M (2005). Real-time imaging of myosin II regulatory light-chain phosphorylation using a new protein biosensor. Biochem. J 385, 589–594. [DOI] [PMC free article] [PubMed] [Google Scholar]
- Zhang H, Landmann F, Zahreddine H, Rodriguez D, Koch M, and Labouesse M (2011). A tension-induced mechanotransduction pathway promotes epithelial morphogenesis. Nature 471, 99–103. [DOI] [PubMed] [Google Scholar]
- Zhao M, Wan X, Li Y, Zhou W, and Peng L (2015). Multiplexed 3D FRET imaging in deep tissue of live embryos. Sci. Rep 5, 13991. [DOI] [PMC free article] [PubMed] [Google Scholar]
Associated Data
This section collects any data citations, data availability statements, or supplementary materials included in this article.