

Abstract
Introduction
The absolute and proportional numbers of elderly patients diagnosed with localized prostate cancer (PCa) are on the rise. We examined treatment trends and reimbursement figures in localized PCa patients aged ≥80 years.
Methods
Between 2000 and 2008, we identified 30 217 localized PCa patients aged ≥80 years in Surveillance, Epidemiology, and End Results (SEER)-Medicare-linked database. Alternative treatment modalities consisted of conservative management (CM), radiation therapy (RT), radical prostatectomy (RP), and primary androgen-deprivation therapy (PADT). For all four modalities, utilization and reimbursements were examined.
Results
PADT was the most frequently used treatment modality between 2000 and 2005. CM became the dominant treatment modality from 2006–2008. RP rates were marginal. RT ranked third, and its annual rate increased from 20.77% in 2000 to 29.13% in 2008. Median individual reimbursement of RT was highest and ranged from $29 343 in 2000 to $31 090 in 2008, followed by RP (from $20 560 in 2000 to $19 580 in 2008), PADT (from $18 901 in 2000 to $8000 in 2008), and CM (from $1824 in 2000 to $1938 in 2008). RT contributed to most of the cumulative annual reimbursements from 2003 (49.24%) to 2008 (72.97%). PADT ranked first from 2000 (54.56%) to 2002 (50.49%), but decreased by 19.40% in 2008. CM’s contribution increased from 4.42% in 2000 to 6.96% in 2008. RP’s share of reimbursements was stable during the study period.
Conclusions
Our results, focusing on localized PCa treatment in patients aged ≥80 years, showed an important increase in rates, median cost, and proportion of cumulative cost related to RT.
Introduction
Prostate cancer (PCa) is the most common non-cutaneous malignancy in American men, with estimates of 161 360 new cases for 2017.1 About one-quarter (24.3%) of patients are diagnosed after 75 years old.2 Elderly patients tend to have more aggressive or advanced tumours at diagnosis than their younger counterparts, but their shorter life expectancy and increasing burden of comorbidities often limit their treatment options.3,4 Contemporary reports and guidelines favour conservative management (CM) for patients with localized PCa with a life expectancy ≤10 years. Moreover, no contemporary guidelines or reports recommend primary androgendeprivation therapy (PADT) in such individuals.5–10 Based on these considerations, we decided to assess the temporal trends of utilization of the four treatment modalities for localized PCa (CM, PADT, radical prostatectomy [RP], radiation therapy [RT]) in elderly patients, as well as their associated cost. Reimbursement figures were used as a proxy of cost, as previously published.11–15 We exclusively focused on clinically localized PCa patients aged ≥80 years within the Surveillance, Epidemiology, and End Results (SEER)-Medicare database. We hypothesized an increased use of CM and decreased use of PADT, as well as low rates of active therapy, such as RT and RP. A concordant decline in cost related to treatment of localized PCa in elderly patients was also expected.
Methods
Data source and study population
The current study relied on the SEER-Medicare insurance program-linked database.16 Between 2000 and 2008, we identified patients aged ≥80 years with clinically localized (stage T1–T2), histologically confirmed PCa (International Classification of Disease for Oncology [ICD-O] site code 61.9, histologic code 8140). Patients not enrolled in Medicare parts A or B and with health maintenance organization enrolment throughout the duration of the study were not considered. Patients were not included if PCa was diagnosed at autopsy or on death certificate only or if PCa was not the first malignancy recorded. Additional exclusions consisted of clinical stage T3 or T4 tumours, lymph node invasion and/or distant metastases, and patients with unknown clinical stage.
We exclusively focused on patients who received primary treatment within six months after diagnosis. We classified treatment as either CM, RP, any form of RT, or PADT. CM was defined as absence of active treatment within the first six months following diagnosis. We defined active treatment using Common Procedural Terminology, fourth edition (CPT-4), Health-care Common Procedure Coding System (HCPCS), and International Classification of Disease, Ninth Revision (ICD-9) codes for RP, any form of RT, and PADT. RP group included patients who underwent surgery, with or without additional ADT or external-beam RT. The RT group included patients with or without additional ADT. ADT included chemical (GnRH agonist or anti-androgen or both) or surgical castration. The final population resulted in 30 217 assessable patients aged ≥80 years with localized PCa.
Covariates
For each patient, age at diagnosis, year of diagnosis, race, marital status, U.S. region (Midwest, Northeast, South, and West according to the U.S. Census Bureau), and population density were recorded. Socioeconomic status (SES) was defined according to three county-attribute variables (income, education, poverty levels), as previously described.16 The Charlson Comorbidity Index (CCI) was derived from Medicare claims recorded up to one year before PCa diagnosis, using a previously validated algorithm and categorized as 0 vs. 1 vs. ≥2.17 Tumour characteristics assessed included clinical stage (T1 or T2) and World Health Organization (WHO) grade (well-differentiated, moderately differentiated, and poorly differentiated disease).
Medicare reimbursements
We identified the amounts paid by Medicare for all individual inpatient, outpatient, and physician services related to PCa diagnosis (code 185) for the first 12 months following diagnosis, during each calendar year of the study (2000–2008). The amounts related to individual reimbursements were tabulated according to each primary PCa treatment (CM vs. PADT vs. RT vs. RP) and were stratified by year of diagnosis. Thus, generated amounts were used to tabulate annual reimbursement figures for each individual treatment modality. Subsequently, total annual reimbursement figures were calculated using the sum of all four examined treatment modalities. Finally, proportion contribution to the total annual reimbursements were calculated for each of the four examined treatment modalities. Costs were reported in 2016 U.S. dollars, after adjustment for annual U.S. inflation rate.18 All reimbursement values were adjusted for age at diagnosis, year of diagnosis, race, marital status, U.S. regions, population density, SES, clinical stage, WHO grade, and CCI using a log linear regression.
Statistical analyses
We first examined the temporal utilization trends for each of the four alternative treatment modalities and graphically depicted it using the lowess smoother weighted function, with corresponding 95% confidence intervals (CI). The same methodology was used to assess the median annual reimbursement amount trends for each of the four treatment modalities (RT, PADT, RP and CM), as well as the trends of each treatment’s contribution to the proportion of the total annual Medicare reimbursement amounts. Central tendencies and dispersion measures were tabulated for each year of observation. Linear regression was used to test the slope of rates and cost of all examined treatment modalities over time. All statistical tests were performed using the RStudio graphical interface v.0.98 for R software environment v.3.0.2 (R Foundation, Vienna, Austria). All tests were two-sided, with a significance level set at p<0.05.
Results
Overall, 30 217 patients aged ≥80 years were identified between 2000 and 2008. Of those, 12 026 (39.8%), 10 820 (35.8%), 7251 (24.0%), and 120 (0.4%) were treated with PADT, CM, RT, and RP, respectively (Table 1).
Table 1.
Descriptive characteristics of 30 217 patients aged ≥80 years with localized prostate cancer treated with either CM, RP, RT, or PADT between 2000 and 2008 within SEER-Medicare database
| Variables | Treatment modalities | |||
|---|---|---|---|---|
|
|
||||
| CM n=10 820 (35.8%) |
RP n=120 (0.4%) |
RT n=7251 (24.0%) |
PADT n=12 026 (39.8%) |
|
| Age at diagnosis, year | ||||
| Median | 83 | 81.5 | 82 | 84 |
| Range | 80–102 | 80–94 | 80–97 | 82–107 |
| Socioeconomic status, n (%) | ||||
| Low | 5529 (51.1) | * | 3854 (53.2) | 5953 (49.5) |
| High | 5167 (47.8) | 62 (51.7) | 3337 (46) | 5912 (49.2) |
| Unknown | 124 (1.1) | * | 60 (0.8) | 161 (1.3) |
| Charlson Comorbidity Index, n (%) | ||||
| 0 | 4771 (44.1) | 60 (50.0) | 3451 (47.6) | 5134 (42.7) |
| 1 | 1930 (17.8) | 20 (16.7) | 1421 (19.6) | 2350 (19.5) |
| 2 | 4119 (38.1) | 40 (33.3) | 2379 (32.8) | 4542 (37.8) |
| U.S. region**, n (%) | ||||
| Midwest | 1538 (14.2) | 11 (9.2) | 975 (13.4) | 1757 (14.6) |
| Northeast | 2017 (18.6) | 11 (9.2) | 1751 (24.1) | 2420 (20.1) |
| South | 2332 (21.6) | 12 (10.0) | 1523 (21.0) | 2893 (24.1) |
| West | 4933 (45.6) | 86 (71.6) | 3002 (41.4) | 4956 (41.2) |
| Marital status, n (%) | ||||
| Married | 5829 (53.9) | 90 (75.0) | 5066 (69.9) | 6177 (51.4) |
| Unmarried | 2971 (27.5) | * | 1586 (21.9) | 2887 (24.0) |
| Unknown | 2020 (18.7) | * | 599 (8.3) | 2962 (24.6) |
| Population density, n (%) | ||||
| Urban | 9082 (83.9) | * | 6269 (86.5) | 9,741 (81.0) |
| Rural | 1738 (16.1) | * | 982 (13.5) | 2,285 (19.0) |
| Grade, n (%) | ||||
| Well-differentiated | 557 (5.1) | * | 78 (1.1) | 182 (1.5) |
| Moderately differentiated | 6348 (58.7) | * | 3164 (43.6) | 4805 (40.0) |
| Poorly differentiated | 3382 (31.2) | 69 (57.5) | 3889 (53.6) | 6676 (55.5) |
| Undifferentiated/anaplastic | 29 (0.3) | * | 28 (0.4) | 58 (0.5) |
| Unknown | 504 (4.7) | * | 92 (1.3) | 305 (2.5) |
| Race, n (%) | ||||
| White | 9077 (83.9) | * | 6112 (84.3) | 9947 (82.7) |
| Black | 1077 (9.9) | * | 495 (6.8) | 1155 (9.6) |
| Other | 647 (6.0) | * | * | 904 (7.5) |
| Unknown | 19 (0.2) | * | * | 20 (0.2) |
Masked for protection of patient confidentiality reasons, as per National Cancer Institute regulations.
Based on regions designated by the U.S. Census Bureau.
CM: conservative management; PADT: primary androgen-deprivation therapy; RP: radical prostatectomy; RT: radiation therapy; SEER: Surveillance, Epidemiology, and End Results.
During the study period, the number of patients treated annually with one of the four examined treatment modalities ranged from 2603 in 2008 to 3755 in 2002 (Table 2). The two dominant treatment modalities throughout the study period were CM and PADT (Fig. 1). Specifically, PADT ranked first between 2000 (43.13%) and 2005 (38.48%) (Table 2, Fig. 1). Thereafter, its annual rate decreased to 29.53% in 2008 (p<0.001) (Table 2, Fig. 1). CM ranked second between 2000 (35.75%) and 2005 (36.08%) (Table 2, Fig. 1). Thereafter, CM became the dominant treatment modality (from 36.50% in 2006 to 40.91% in 2008). The most important increase in CM use was observed between years 2003 (33.14%) and 2008 (40.91%) (p=0.02) (Table 2, Fig. 1). RT ranked third and its annual rate (Table 2) increased from 20.77% in 2000 to 29.13% in 2008 (p<0.001) (Fig. 1). The most important increase in RT use was observed between year 2003 (21.82%) and 2008 (29.13%). RP ranked fourth and its annual use (Table 2) was marginal, with stable rates from 0.35% in 2000 to 0.43% 2008 (p=0.2) (Fig. 1).
Table 2.
Annual utilization rates of alternative treatment modalities, namely CM, RP, RT, and PADT for patients aged ≥80 years with localized prostate cancer and their annual share of cost recorded for the initial 12 months following diagnosis, between 2000–20008, within SEER-Medicare database
| Year of study | 2000 | 2001 | 2002 | 2003 | 2004 | 2005 | 2006 | 2007 | 2008 |
|---|---|---|---|---|---|---|---|---|---|
| Number of patients treated, n | 3331 | 3594 | 3755 | 3539 | 3543 | 3279 | 3391 | 3182 | 2603 |
| Rate of treatment (%) | |||||||||
| CM | 35.75 | 35.33 | 34.53 | 33.14 | 34.23 | 36.08 | 36.50 | 37.83 | 40.91 |
| RP | 0.35 | 0.38 | 0.40 | 0.38 | 0.41 | 0.38 | 0.42 | 0.46 | 0.43 |
| RT | 20.77 | 20.95 | 21.19 | 21.82 | 23.15 | 25.06 | 27.08 | 28.51 | 29.13 |
| PADT | 43.13 | 43.34 | 43.88 | 44.66 | 42.21 | 38.48 | 36.00 | 33.20 | 29.53 |
| Cumulative cost, U.S. $ | 52 498 205 | 56 231 917 | 67 372 730 | 63 587 682 | 57 734 801 | 46 782 316 | 50 321 689 | 46 155 006 | 31 566 236 |
| Proportion of cost (%) | |||||||||
| CM | 4.42 | 4.05 | 3.81 | 3.69 | 4.31 | 5.00 | 5.21 | 5.80 | 6.96 |
| RP | 0.37 | 0.44 | 0.44 | 0.38 | 0.37 | 0.36 | 0.54 | 0.66 | 0.67 |
| RT | 40.65 | 42.62 | 45.26 | 49.24 | 56.12 | 62.99 | 67.55 | 70.84 | 72.97 |
| PADT | 54.56 | 52.89 | 50.49 | 46.69 | 39.20 | 31.65 | 26.70 | 22.70 | 19.40 |
CM: conservative management; PADT: primary androgen deprivation therapy; RP: radical prostatectomy; RT: radiation therapy; SEER: Surveillance, Epidemiology, and End Results.
Fig. 1.
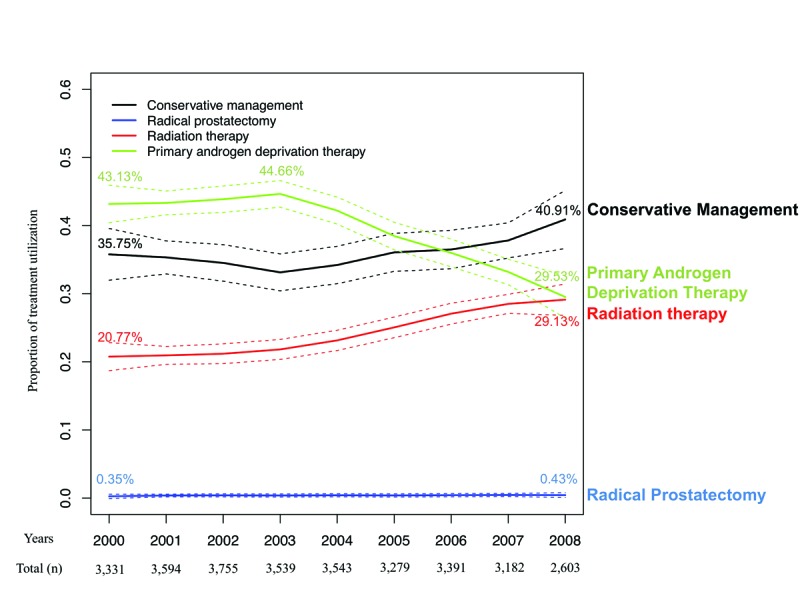
Temporal trends of treatments utilization for patients aged ≥80 years with localized prostate cancer: conservative management (CM) vs. radical prostatectomy (RP) vs. radiation therapy (RT) vs. primary androgendeprivation therapy (PADT), as recorded in 30 217 patients between 2000 and 2008, within Surveillance, Epidemiology, and End Results (SEER)-Medicare database (dotted lines: 95% confidence interval).
The median annual reimbursement trends, estimating costs for the treatment of an individual patient related to each of the four examined treatment modalities, are shown in Figs. 2A–D. The median reimbursements for RT ranged from $29 343 in 2000 to $31 090 in 2008 (p=0.7) vs. for PADT from $18 901 in 2000 to $8000 in 2008 (p<0.001). The median reimbursements for RP ranged from $20 560 in 2000 to $19 580 in 2008 (p=0.9), with the lowest average reimbursement value of $13 412 in 2004. RT ranked first within each of the nine examined study years. CM ranked last. Specifically, the median reimbursement for CM ranged from $1824 in 2000 to $1938 in 2008 (p=0.01). On a proportion basis, in year 2000, relative to RT, PADT reimbursement amounts represented 64.4% vs. 70.1% for RP vs. 6.2% for CM. In 2008, the same percentages were 25.7% for PADT vs. 63.0% for RP vs. 6.2% for CM.
Fig. 2.

Median annual reimbursement trends according to each treatment modality, for localized prostate patients aged ≥80 years within Surveillance, Epidemiology, and End Results (SEER)-Medicare database, between 2000 and 2008. (A) radiation therapy (n=7251); (B) primary androgen-deprivation therapy (n=12 026); (C) radical prostatectomy (n=120);and (D) conservative management (n=10 820). All reimbursement values were adjusted for patient and tumour characteristics.
The total reimbursement amount for all four treatment modalities examined was $52 498 205 in 2000 vs. $31 566 236 in 2008 (Table 2). The highest total reimbursement amount was recorded in 2002 ($67 372 730).
Proportionately (Table 2), PADT reimbursements ranked first (Fig. 3) between year 2000 (54.56%) and 2002 (50.49%), and second thereafter (Table 2). RT reimbursements ranked second (Fig. 3) from year 2000 (40.65%) to 2002 (45.26%), and first thereafter (Table 2). In 2008, RT accounted for the highest proportion of annual reimbursements recorded for the four examined treatment modalities (72.97%). CM reimbursements ranked third (Fig. 3) and contributed to 4.42% of the total amount in 2000 and to 6.96% in 2008 (p=0.009) (Table 2). RP share of cost remained stable during the study period (0.37% in 2000 and 0.67% in 2008; p=0.08) (Table 2, Fig. 3).
Fig. 3.
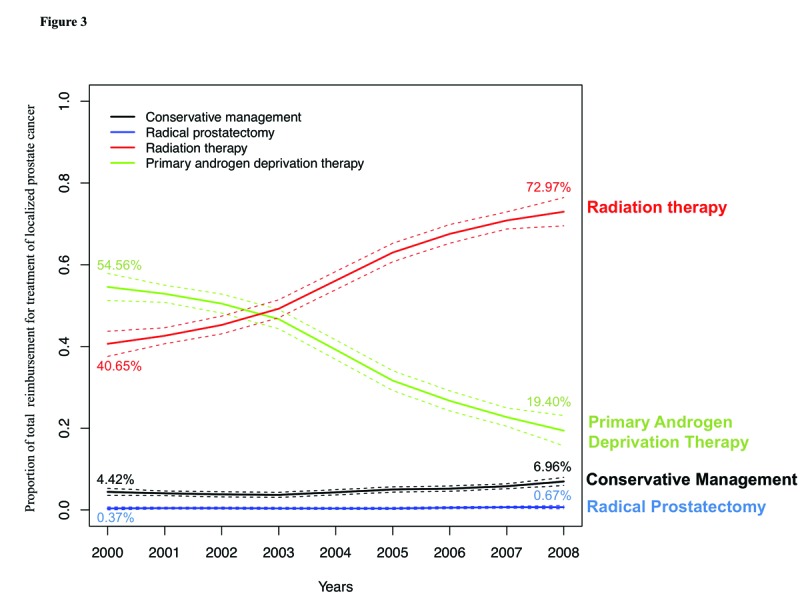
Temporal trends depicting the proportion of the total annual reimbursement related to each of the four treatment modalities for localized prostate cancer: conservative management (CM) vs. radical prostatectomy (RP) vs. radiation therapy (RT) vs. primary androgen-deprivation therapy (PADT), as recorded in 30 217 patients aged ≥80 years between 2000 and 2008, within Surveillance, Epidemiology, and End Results (SEER)-Medicare database. Annual cumulative reimbursement reflects a period of 12 months from diagnosis (dotted lines: 95% confidence interval). All reimbursement values were adjusted for patient and tumour characteristics.
Discussion
In the current study, we hypothesized an increase in the use of CM and a decrease in the use of PADT for localized PCa patients aged ≥80 years. We also postulated that the rates of RT or RP would be low, given the advanced age of the study cohort. Moreover, a concordant decline in cost related to treatment of localized PCa in elderly patients was expected.
Our results confirmed some of our hypotheses. Specifically, the two main treatment modalities used in patients aged ≥80 years were CM and PADT. Throughout the study years, we observed a decrease in PADT rates and an increase in CM rates. PADT was the dominant treatment modality until 2005. Thereafter, CM accounted for the highest treatment rates. Moreover, unexpectedly and despite the advanced age of the study cohort, RT rates also increased significantly between 2003 and 2008. RT represented the third most frequently used modality of the four examined treatments in patients aged ≥80 years. Finally, RP rates remained marginally low during the study period.
Although RT was only the third most frequently used treatment modality, it accounted for the biggest share of cost between 2003 and 2008. The latter stems from its high median cost, which ranged from $29 343 to $31 090, and exceeded the median cost of all other examined treatment modalities. PADT’s share of cost decreased during the study period, from 54.56% in year 2000 to 19.40% in year 2008, with respective medians of $18 901 and $8000. These figures resulted in PADT being the second most important contributor to cumulative cost. CM’s contribution to cumulative annual cost also increased from 4.42% in 2000 to 6.96% in 2008, with its median cost ranging from $1824 in 2000 to $1938 in 2008. RP cost share remained stable and marginal during the study period. It is also of note that the total annual reimbursements for all four treatment modalities for localized PCa in patients aged ≥80 years decreased between years 2000 ($52 498 205) and 2008 ($31 566 236).
Of those observations, several require a comment. First, the proportion of cumulative cost related to RT sharply increased over the study period and nearly doubled. This happened out of proportion with the increase in RT rates. Indeed, the median cost of RT also increased over the study period and exceeded the median cost of all other treatment modalities throughout the study period. This finding is consistent with modifications in treatment patterns that occurred in the field of radiation oncology. Specifically, we witnessed an increased rate of costly variants of RT, such as intensity-modulated and proton beam therapy.15,19 It is surprising though, that the uptake of such costly procedures occurred at such rapid rate in elderly patients, whose life expectancy might not be sufficient to warrant the use of any definitive therapy. Unfortunately, our database and its observational form do not allow to fully explore and justify the rationale of treatment selection. Despite the high cost of RT, the concordant decrease in PADT rates and the increase in CM rates jointly resulted in an overall decline in the total cost related to the treatment of localized PCa in patients aged ≥80 years. It is also of note that as of 2008, the reimbursement figures for all treatment modalities declined due to a drop implemented by Medicare administrative.20
Other studies reported utilization rates of alternative treatment modalities for localized PCa in older patients.21–25 Of those, all focused on men aged ≥75 years or younger. For example, a study by Hoffman et al21 found treatment rates comparable to ours. Specifically, they observed that compared to their younger counterparts, men aged ≥75 years were more likely to be treated with either PADT or CM, instead of RT or RP. However, other studies reported somewhat different findings. For example, Roberts et al23 and Konety et al25 reported utilization rates of alternative treatment modalities for localized PCa that ranged from 27–43% for PADT, 34–52% for RT, 18–19% for CM, and 4% for RP. It is of note that the proportions of RT use are higher and CM use lower in those reports than in the current study. These differences could be explained by difference in the definition of elderly age that was used. We exclusively relied on patients aged ≥80 years, whereas others used age ≥75 years. Younger patients are more likely to undergo active treatment, such as RT, due to better health status and longer life expectancy. It is well-accepted that RT is more frequently used than RP in elderly patients since no general anesthesia is required and fewer anesthesiarelated adverse events may be expected.24,26
Even though we advocate caution with respect to the use of definitive treatment modalities in the elderly, we wish to remind the reader of existing guidelines. The Society of Geriatric Oncology (SGO) has established guidelines for management of PCa in older men.27 According to these guidelines, clinicians should consider patient comorbidities, dependence status, and nutritional status, along with tumour characteristics more than chronological age to establish the health status and life expectancy of elderly patients with localized PCa. According to these guidelines, healthy patients aged ≥80 years with life expectancy of ≥10 years should benefit from active therapy. This is based on similar cancer control outcomes in such selectively identified individuals, compared to their younger counterparts.28,29 On the other hand, patients with poor health status and low life expectancy should undergo CM, as their probability of dying of cancer-related causes is low.26,30 This said, no recommendation stipulates the use of PADT for localized PCa in any patient, including those aged ≥80 years. Moreover, changes in Medicare reimbursement policies for PADT further discouraged the use of this modality.31
To the best of our knowledge, we are the first to examine the patterns of use of alternative treatment modalities for localized PCa and their cost in patients aged ≥80 years. This assessment is important, as the aging of the population will contribute to increasingly higher proportion of elderly individuals diagnosed with localized PCa. This, in turn, will require from clinicians a careful selection of treatment modalities for elderly patients and judicious use of health resources and health dollars.
Our study is not devoid of limitations. First, it relies on the SEER-Medicare database, as well as Medicare reimbursements, that are specific to the U.S. Hence, the patterns observed in terms of use and cost according to the type of treatment may be different in the presence of other insurance providers and in analyses based on institutional charges. Moreover, differences in treatment assignment and cost figures could be observed in countries other than the U.S. In consequence, future studies are needed to confirm our findings. Moreover, our cost analyses relied on reimbursements related to PCa in the first year following diagnosis using the ICD-9 PCa diagnostic code (185). This methodology may result in potential misclassification due to omission or excessive use of this code. However, this potential limitation applies equally to all examined treatment modalities. Additionally, combination of RP and RT with other treatment modalities, such as ADT, may affect cost estimates. Last but not least, we examined trends between 2000 and 2008. However, cost and utilization rate figures may have changed in more contemporary years. For example, cost of most contemporary RT may have escalated even further. The reimbursement figures may or may have not followed that trend. Conversely, the most contemporary rates of RT use might have decreased in patients aged ≥80 years.
Conclusion
Our results, focusing on localized PCa treatment in patients aged ≥80 years, showed that a surprisingly elevated proportion of elderly patients received RT. Moreover, an important increase in rates, median cost, and proportion of cumulative cost related to RT was observed during the study period.
Footnotes
Competing interests: The authors report no competing personal or financial interests related to this work.
This paper has been peer-reviewed.
References
- 1.Siegel RL, Miller KD, Jemal A. Cancer statistics, 2017. CA Cancer J Clin. 2017;67:7–30. doi: 10.3322/caac.21387. [DOI] [PubMed] [Google Scholar]
- 2.Howlader N, Noone AM, Krapcho M, et al. SEER cancer statistics review, 1975–2012. National Cancer Institute; [Accessed June 7, 2018]. [Updated Nov. 18, 2015]. Avaialble at https://seer.cancer.gov/archive/csr/1975_2012/ [Google Scholar]
- 3.Bechis SK, Carroll PR, Cooperberg MR. Impact of age at diagnosis on prostate cancer treatment and survival. J Clin Oncol. 2011;29:235–41. doi: 10.1200/JCO.2010.30.2075. [DOI] [PMC free article] [PubMed] [Google Scholar]
- 4.Sun L, Caire AA, Robertson CN, et al. Men older than 70 years have higher risk prostate cancer and poorer survival in the early and late prostate-specific antigen eras. J Urol. 2009;182:2242–8. doi: 10.1016/j.juro.2009.07.034. [DOI] [PubMed] [Google Scholar]
- 5.Guidelines on prostate cancer. European Association of Urology; 2017. [Accessed June 7, 2018]. Available at http://uroweb.org/guideline/prostate-cancer/ [Google Scholar]
- 6.National Comprehensive Cancer Network. Clinical practice guidelines in pncology. Prostate cancer, 2017. [Accessed June 7, 2018]. Available at https://www.nccn.org/professionals/physician_gls/f_guidelines.asp.
- 7.Thompson I, Thrasher JB, Aus G, et al. Guideline for the management of clinically localized prostate cancer: 2007 update. J Urol. 2007;177:2106–31. doi: 10.1016/j.juro.2007.03.003. [DOI] [PubMed] [Google Scholar]
- 8.Sammon JD, Abdollah F, Reznor G, et al. Patterns of declining use and the adverse effect of primary androgen deprivation on all-cause mortality in elderly men with prostate cancer. Eur Urol. 2015;68:32–9. doi: 10.1016/j.eururo.2014.10.018. [DOI] [PubMed] [Google Scholar]
- 9.Albertsen PC, Hanley JA, Fine J. 20-year outcomes following conservative management of clinically localized prostate cancer. JAMA. 2005;293:2095–2101. doi: 10.1001/jama.293.17.2095. [DOI] [PubMed] [Google Scholar]
- 10.Lu-Yao GL, Albertsen PC, Moore DF, et al. Fifteen-year survival outcomes following primary androgen-deprivation therapy for localized prostate cancer. JAMA. 2014;174:1460–7. doi: 10.1001/jamainternmed.2014.3028. [DOI] [PMC free article] [PubMed] [Google Scholar]
- 11.Wang SY, Wang R, Yu JB, et al. Understanding regional variation in Medicare expenditures for initial episodes of prostate cancer care. Medical Care. 2014;52:680–7. doi: 10.1097/MLR.0000000000000158. [DOI] [PMC free article] [PubMed] [Google Scholar]
- 12.Warren JL, Yabroff KR, Meekins A, et al. Evaluation of trends in the cost of initial cancer treatment. J Natl Cancer Inst. 2008;100:888–97. doi: 10.1093/jnci/djn175. [DOI] [PMC free article] [PubMed] [Google Scholar]
- 13.Zeliadt SB, Etzioni R, Ramsey SD, et al. Trends in treatment costs for localized prostate cancer: The healthy screenee effect. Medical Care. 2007;45:154–9. doi: 10.1097/01.mlr.0000241044.09778.3f. [DOI] [PubMed] [Google Scholar]
- 14.Snyder CF, Frick KD, Blackford AL, et al. How does initial treatment choice affect short-term and long-term costs for clinically localized prostate cancer? Cancer. 2010;116:5391–9. doi: 10.1002/cncr.25517. [DOI] [PubMed] [Google Scholar]
- 15.Nguyen PL, Gu X, Lipsitz SR, et al. Cost implications of the rapid adoption of newer technologies for treating prostate cancer. J Clin Oncol. 2011;29:1517–24. doi: 10.1200/JCO.2010.31.1217. [DOI] [PMC free article] [PubMed] [Google Scholar]
- 16.Warren JL, Klabunde CN, Schrag D, et al. Overview of the SEER-Medicare data: Content, research applications, and generalizability to the U.S. elderly population. Med Care. 2002;40(8 Suppl):IV-3–18. doi: 10.1097/00005650-200208001-00002. [DOI] [PubMed] [Google Scholar]
- 17.Deyo RA, Cherkin DC, Ciol MA. Adapting a clinical comorbidity index for use with ICD-9-CM administrative databases. J Clin Epidemiol. 1992;45:613–9. doi: 10.1016/0895-4356(92)90133-8. [DOI] [PubMed] [Google Scholar]
- 18.U.S. Inflation Calculator. Historical inflation rates: 1914–2017. [Accessed 2016]. Available at http://www.usinflationcalculator.com/inflation/historical-inflation-rates/
- 19.Sheets NC, Goldin GH, Meyer AM, et al. Intensity-modulated radiation therapy, proton therapy, or conformal radiation therapy and morbidity and disease control in localized prostate cancer. JAMA. 2012;307:1611–20. doi: 10.1001/jama.2012.460. [DOI] [PMC free article] [PubMed] [Google Scholar]
- 20.Rosenthal MB. Non-payment for performance? Medicare’s new reimbursement rule. N Engl J Med. 2007;357:1573–5. doi: 10.1056/NEJMp078184. [DOI] [PubMed] [Google Scholar]
- 21.Hoffman RM, Shi Y, Freedland SJ, et al. Treatment patterns for older veterans with localized prostate cancer. Cancer Epidemiol. 2015;39:769–77. doi: 10.1016/j.canep.2015.07.005. [DOI] [PMC free article] [PubMed] [Google Scholar]
- 22.Konety BR, Sharp VJ, Raut H, et al. Screening and management of prostate cancer in elderly men: The Iowa Prostate Cancer Consensus. Urology. 2008;71:511–4. doi: 10.1016/j.urology.2007.09.019. [DOI] [PubMed] [Google Scholar]
- 23.Roberts CB, Albertsen PC, Shao YH, et al. Patterns and correlates of prostate cancer treatment in older men. Am J Med. 2011;124:235–43. doi: 10.1016/j.amjmed.2010.10.016. [DOI] [PMC free article] [PubMed] [Google Scholar]
- 24.Bian SX, Hoffman KE. Management of prostate cancer in elderly men. Sem Rad Oncol. 2013;23:198–205. doi: 10.1016/j.semradonc.2013.01.007. [DOI] [PubMed] [Google Scholar]
- 25.Konety BR, Cowan JE, Carroll PR, et al. Patterns of primary and secondary therapy for prostate cancer in elderly men: Analysis of data from CaPSURE. J Urol. 2008;179:1797–1803. doi: 10.1016/j.juro.2008.01.044. [DOI] [PubMed] [Google Scholar]
- 26.Abdollah F, Sun M, Thuret R, et al. A competing-risks analysis of survival after alternative treatment modalities for prostate cancer patients: 1988–2006. Eur Urol. 2011;59:88–95. doi: 10.1016/j.eururo.2010.10.003. [DOI] [PubMed] [Google Scholar]
- 27.Droz JP, Aapro M, Balducci L, et al. Management of prostate cancer in older patients: Updated recommendations of a working group of the International Society of Geriatric Oncology. Lancet Oncol. 2014;15:e404–14. doi: 10.1016/S1470-2045(14)70018-X. [DOI] [PubMed] [Google Scholar]
- 28.Gandaglia G, Karakiewicz PI, Abdollah F, et al. The effect of age at diagnosis on prostate cancer mortality: A grade-for-grade and stage-for-stage analysis. Eur J Surg Oncol. 2014;40:1706–15. doi: 10.1016/j.ejso.2014.05.001. [DOI] [PubMed] [Google Scholar]
- 29.Siddiqui SA, Sengupta S, Slezak JM, et al. Impact of patient age at treatment on outcome following radical retropubic prostatectomy for prostate cancer. J Urol. 2006;175:952–7. doi: 10.1016/S0022-5347(05)00339-3. [DOI] [PubMed] [Google Scholar]
- 30.Albertsen PC, Moore DF, Shih W, et al. Impact of comorbidity on survival among men with localized prostate cancer. J Clin Oncol. 2011;29:1335–41. doi: 10.1200/JCO.2010.31.2330. [DOI] [PMC free article] [PubMed] [Google Scholar]
- 31.Shahinian VB, Kuo YF, Gilbert SM. Reimbursement policy and androgen-deprivation therapy for prostate cancer. N Engl J Med. 2010;363:1822–32. doi: 10.1056/NEJMsa0910784. [DOI] [PubMed] [Google Scholar]