

Abstract
We quantified measles transmissibility during a measles outbreak in Ohio in 2014 to evaluate the impact of public health responses. Case incidence and the serial interval (time between symptom onset in primary cases and secondary cases) were used to assess trends in the effective reproduction number R (the average number of secondary cases generated per case). A mathematical model was parameterized using early R values to determine the size and duration of the outbreak that would have occurred if containment measures had not been initiated, as well as the impact of vaccination. As containment started, we found a 4-fold decline in R (from approximately 4 to 1) over the course of 2 weeks and maintenance of R < 1 as control measures continued. Under a conservative scenario, the model estimated 8,472 cases (90% confidence interval (CI): 8,447, 8,489) over 195 days (90% CI: 179, 223) without control efforts and 715 cases (90% CI: 103, 1,338) over 128 days (90% CI: 117, 139) when vaccination was included; 7,757 fewer cases (90% CI: 7,130, 8,365) and 67 fewer outbreak days (90% CI: 48, 98) were attributed to vaccination. Vaccination may not account entirely for transmission reductions, suggesting that changes in community behavior (social distancing) and other control efforts (isolation, quarantining) are important. Our findings highlight the benefits of measles outbreak response and of understanding behavior change dynamics.
Keywords: disease outbreaks, disease transmission, measles, outbreak response, reproduction number, transmissibility, United States
Measles is a highly contagious viral disease that can lead to serious complications and death. Even with repeated importations of measles into the United States, most introductions do not result in additional transmission; outbreaks are generally small (1), and endemic measles transmission in the United States was declared eliminated in 2000 (2). The success of the US measles elimination program is credited to high measles-mumps-rubella (MMR) vaccine coverage, as well as the rapid implementation of control measures once cases are reported (2). Yet, the relative contributions of baseline coverage and of various simultaneous control measures (vaccination, isolation, quarantine) in preventing large outbreaks are not fully understood (3). Because outbreak responses by public health agencies are labor-intensive and costly (4), efforts to measure the effectiveness of these interventions are important.
On March 21, 2014, the return of 2 unvaccinated Amish men to Ohio from the Philippines, where they had been unknowingly infected with measles, led to the largest outbreak of measles in the United States in more than 2 decades (5, 6). The outbreak provided an opportunity to measure the impact of public health responses in mitigating measles transmission in an underimmunized community. We aimed to quantify measles transmissibility during the outbreak and to evaluate the effect of public health responses in limiting the size and duration of the outbreak.
METHODS
Transmissibility was measured by estimating the effective reproduction number, R, which is the average number of cases generated by a single infectious individual (7). The goal of outbreak response is to reduce R below the threshold value of 1; transmission wanes when R is maintained at less than 1, bringing an outbreak under control. Employing a ready-to-use tool (8), we estimated R from case incidence time-series data and the distribution of the serial interval (the time between the onset of symptoms in primary cases and secondary cases) (9). We tracked R over time during the outbreak and correlated changes in transmissibility with control efforts. Two distinct time-varying estimates of R were measured: the instantaneous reproduction number (Rt) and the case reproduction number (Rc) (8). Rt measures the expected transmissibility at calendar time t, based on the ratio of the number of new infections in that time step to the total infectiousness of previous cases. Thus, Rt can be estimated in real time, as new cases are identified (8). Rc measures the actual transmissibility of cases with symptom onset at calendar time t, and it is calculated once all secondary cases have been detected; thus, it is retrospective (8, 10). To maintain precision, we calculated Rt and Rc for each day of the outbreak over the course of a 14-day time window ending on that day (8). Details on these methods are available elsewhere (8, 10). We applied the estimation procedures to outbreak notification data (incidence by the date of rash onset) using a serial interval for measles derived from household studies (a gamma distribution with a mean of 11.1 days and a standard deviation of 2.47 days) (9).
To evaluate the probable size and duration of the outbreak that would have occurred if control measures had not been introduced, we simulated potential outbreak trajectories using a continuous-time stochastic susceptible-exposed-infectious-recovered compartmental model; stochastic variability was incorporated using the adaptive tau-leaping algorithm (11). The model tracks 4 classes of persons: those who are 1) susceptible to infection and disease (S); 2) exposed but not yet infectious and asymptomatic (E); 3) infectious with symptoms (I); and 4) recovered and immune (R) (Figure 1). All persons in the S class can be infected at a rate λ(t), the force of infection, and move into the E class. Exposed persons then become infectious, and they progress from the E class into the I class at a rate σ. Finally, individuals recover (i.e., become immune) and move from the I class into the R class at a rate γ.
Figure 1.
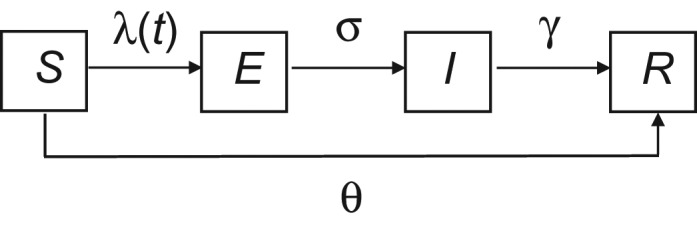
Schematic representation of disease states, flow between states, and parameters controlling flow in a model of a measles outbreak in an Amish community, Ohio, 2014. The model represents a constant (closed) population in which individuals are either susceptible to (S) or recovered from (R) measles infection and disease, and into which measles introduction occurs (i.e., a particular number of infectious persons (I) is introduced). Persons in the susceptible pool become exposed at the force of infection, λ(t), and then progress through the exposed preinfectious (E) and infectious (I) stages before arriving in the removed compartment (R), where individuals are immune. σ and γ denote the rates at which individuals progress into the I and R compartments, respectively. The model tracks, each day, the number of persons in each of the compartments, and it incorporates stochasticity using the adaptive tau-leaping algorithm (11). The effect of the measles-mumps-rubella vaccination campaign is represented by θ, the number of unvaccinated persons who received a dose of measles-mumps-rubella vaccine during containment efforts. Unvaccinated persons are removed from the S compartment and added to the R compartment (bypassing E and I) based on the date on which measles-mumps-rubella vaccine was administered.
Static model inputs are detailed in Table 1. λ(t) is proportional to β, the per capita rate at which 2 persons come into sufficient contact to lead to infection per unit of time, and to the number of infectious persons at time t (It). The rate β itself can be written as a combination of 3 parameters: the basic reproduction number R0 (the average number of cases generated by a single infectious individual if the entire population is susceptible), the duration of infectiousness, and the population size. R0 may vary considerably for the same disease in different populations (7). However, R0 in a particular population can be estimated from R and ≥1-dose MMR vaccine coverage (VC) as R = sR0. The variable s represents the proportion of the population that is susceptible,
where VE is the median vaccine effectiveness of 1 dose of MMR (93%) (12) and sU is the proportion of unvaccinated persons who are susceptible (i.e., not immune through previous exposure), so that
Table 1.
Fixed Input Parameters for Several Possible Scenarios in a Model of a Measles Outbreak in an Amish Community, Ohio, 2014
| Parameter | Symbol | Formula | Value | Source |
|---|---|---|---|---|
| Transmission probability | β | R0/ND | N/A | |
| Scenario 1a | 2.74 × 10⁻⁵ contacts per day | |||
| Scenario 2b | 6.12 ×10⁻⁵ contacts per day | |||
| Basic reproduction number | R0 | R/s | N/A | |
| Scenario 1 | 7.14 | |||
| Scenario 2 | 16.0 | |||
| Reproduction number of cases prior to initiation of control measures | R | N/A | 4.22 | Likelihood-based estimation procedure (8, 10) |
| Proportion of the population that is susceptible at outset | s | VCc (1 − VEd,e) + sUf,g (1 − VC) | N/A | |
| Scenario 1 | 0.59 | |||
| Scenario 2 | 0.26 | |||
| Population size | N | S + E + I + R | 32,630 | Young Center for Anabaptist and Pietist Studies, Elizabethtown College (14) |
| Average preinfectious or latency period | N/A | N/A | 10 days | CDC measles surveillance manual (16) and ACIP recommendations (12) |
| Average duration of infectiousness | D | N/A | 9 days | CDC measles surveillance manual (16) and ACIP recommendations (12) |
| Infectiousness rate (proportion of exposed persons who become infectious) | σ | 1/average preinfectious or latency period | 0.1 persons per day | N/A |
| Recovery rate (proportion of infectious persons who become immune) | γ | 1/average duration of infectiousness | 0.1 persons per day | N/A |
Abbreviations: ACIP, Advisory Committee on Immunization Practices; CDC, Centers for Disease Control and Prevention; MMR, measles-mumps-rubella; N/A, not applicable.
a Assuming ≥1-dose MMR vaccine coverage of 14% to calculate s (lower bound)—from a coverage assessment in a subset of affected Amish families (5).
b Assuming ≥1-dose MMR vaccine coverage of 68% to calculate s (upper bound)—from the literature (13).
cVC represents vaccine coverage (≥1 dose of MMR vaccine).
dVE represents vaccine effectiveness (median effectiveness of 1 dose of MMR vaccine).
eVE = 93% (12).
fsU represents the proportion of unvaccinated persons who are susceptible.
g unvax.S = 67.5%—from a household transmission study conducted during the outbreak.
Immunization levels in the Amish community were unknown. Thus, we modeled 2 distinct scenarios, using lower and upper bounds in VC. A lower bound in VC of 14% was derived from a coverage assessment carried out in a subset of affected Amish families (62 households with measles cases selected by convenience sampling, totaling 451 persons) (5); these data were obtained through review of vaccination cards and of the Ohio immunization registry (ImpactSIIS) (5). An upper bound in VC of 68% was obtained from a recent study showing that this was the proportion of Amish children in the surrounding area (Holmes County, Ohio) who were reported to have received 1 or more doses of any vaccine (13). The estimate of sU was based on a measles attack rate of 67.5% among 160 exposed unvaccinated family members—part of a household transmission study conducted during the outbreak. Lower and upper bounds in VC were then used to calculate the corresponding R0 and β parameters to model a range of possible scenarios. Reassuringly, our R0 estimates ranged between 7 and 16 (Table 1), consistent with prior estimates for measles in various settings (range, 5–18) (7). Notably, in any given population with a particular contact pattern, the transmissibility potential of measles would be described by a single R0 value; the true R0 for this community was probably somewhere within the range estimated.
The σ and γ parameters are inversely proportional, respectively, to the preinfectious period (the time period between infection and onset of infectiousness) and the duration of infectiousness.
We assumed random mixing and a finite population size of 32,630 persons—the estimated Amish population in the affected settlement during 2014 (14). Due to natural (and maternal) immunity, as well as vaccine coverage prior to the outbreak, a proportion of the population was assumed to be recovered at the outset, bypassing the S class, although they were allowed to make contacts and thus were accounted for in the calculation of incidence.
To assess the impact of the vaccination campaign, we queried the Ohio immunization registry for the number of doses of MMR vaccine given by local health departments in affected counties during the period in which vaccine clinics were offered (April 22–July 24, 2014). Unvaccinated persons who received MMR vaccine were removed from the S class and added to the R class based on the date of vaccine receipt; during broad vaccination campaigns, MMR vaccine may reach unvaccinated persons before or around the time of exposure (5, 15), and when administered within 72 hours after exposure, it can protect or modify the clinical course of measles (12, 16).
Five hundred iterations of the model were run for each of the 2 scenarios, in the absence and presence of the vaccination campaign. The median size and duration of predicted outbreak trajectories, and the corresponding daily changes in Rc, are presented and compared with what was observed. We modeled transmission in the affected Amish community only, without potential spillover to the general (non-Amish) population, where immunity levels are high and almost no measles spread was seen (5).
To evaluate the appropriateness of using early estimates of R to inform the susceptible-exposed-infectious-recovered model, we compared the expected number of cases (as predicted by the model) and the observed number of cases during the first 29 days of the outbreak, prior to initiation of the control measures.
We conducted sensitivity analyses to examine 1) the choice of time window width used to estimate Rt; 2) the use of symptom onset instead of rash onset to estimate R; 3) the impact of advancing or delaying the vaccination campaign by 1 week (to evaluate delays in vaccine protection (immunological response) and outbreak response); 4) a range of measles VE (84.8%–97.0%) at baseline (17); 5) a measles VE of 90.5% for campaign doses (18); and 6) a shorter infectious period of 5 days (19).
Analyses were performed in R 3.2.3 (R Foundation for Statistical Computing, Vienna, Austria).
Since the investigation was part of a public health response, it was not considered by the Centers for Disease and Control and Prevention to be research and was designated as exempt from the human subjects policy.
RESULTS
The outbreak affected one of the largest Amish communities in North America, located in the Holmes County, Ohio, area (14). A total of 383 confirmed measles cases were reported over 121 days. Vigorous containment efforts were instituted by local health departments to limit measles spread, including the delivery of MMR vaccine to 8,726 unvaccinated persons (5).
The epidemic curve and the estimated Rt and Rc are shown in Figure 2. Rt increased from an initial value of 1.2 (90% confidence interval (CI): 0.4, 2.8) at the end of the third week to a maximum value of 9.6 (90% CI: 6.6, 13.4) in the middle of the fifth week, and then varied between 3.1 and 4.6 from the middle of the sixth week to the middle of the seventh week. Thereafter, as the vaccination campaign started to get under way, estimates declined over a period of 2 weeks, with Rt falling below 1 by the middle of the ninth week. As the campaign continued, Rt remained below 1 during the next 2 months, except at the very end of the epidemic, when it increased from a minimum value of 0.2 (90% CI: 0.1, 0.3) to 1.4 (90% CI: 0.7, 2.5). This late increase in Rt occurred after the introduction of measles into a single unimmunized family consisting of 6 persons, 4 of whom developed measles. Similar patterns in transmissibility were observed with Rc—that is, high initial values with variability, a steady decrease as control measures started, and maintenance below 1 thereafter.
Figure 2.

Daily numbers of measles cases and daily estimates of the instantaneous and case reproduction numbers during a measles outbreak in an Amish community, Ohio, 2014. A) Daily total numbers of confirmed outbreak-associated measles case-patients according to day of rash onset (n = 383). For 3 case-patients, the date of rash onset could not be determined, so the date of illness onset +2 days (the median number of days between illness onset and rash for all other cases) is shown. One laboratory-confirmed case-patient did not develop rash, so the date of illness onset is shown. B) Daily estimates of the instantaneous reproduction number Rt over sliding 14-day windows. The black line shows the median estimate, the gray areas the 90% confidence intervals, and the horizontal dashed line the threshold value Rt = 1. C) Daily estimates of the case reproduction number (Rc) over sliding 14-day windows. The circles show the mean estimate, the vertical bars the 90% confidence intervals, and the horizontal dashed line the threshold value Rc = 1. As expected, estimates of Rc were ahead of the estimates of Rt, with the highest estimate of Rc occurring around the end of the third week, approximately 1 serial interval (11–12 days) before the peak in Rt; the peak in Rt in the middle of the fifth week indicates increased transmissibility among cases with rash onset 1 generation before (8). Superimposed in all 3 panels is the cumulative number of daily doses of measles-mumps-rubella (MMR) vaccine given at local health department vaccination clinics during the outbreak (gray dotted lines).
The distribution of the expected number of cases (as determined by the model) during the first 29 days of the outbreak, prior to initiation of control measures, captured well the number of observed cases; the observed and projected daily case incidence tracked each other well in the early stages of the outbreak, and the number of observed cases consistently fell between the 25th and 50th percentiles of the predicted data for the range of scenarios that were evaluated.
The ranges of possible outbreak sizes and durations projected by the model are shown in Table 2. Under the first scenario, assuming an initial VC of 14%, the model estimated that approximately 19,000 measles cases would have arisen over 215 days if no control efforts had been introduced and that approximately 9,500 measles cases would have arisen over 260 days when the vaccination campaign was included; the model attributed approximately 9,500 fewer cases to vaccination efforts. Under the second scenario, assuming an initial VC of 68%, the model estimated that there would have been approximately 8,500 measles cases presenting over 200 days if no control efforts had been introduced and approximately 700 measles cases presenting over 130 days when the vaccination campaign was included; approximately 7,700 fewer cases and 65 fewer outbreak days were attributed to vaccination efforts.
Table 2.
Model Predictions of the Sizes and Durations of Measles Outbreaks in an Amish Community in Ohio in 2014, With and Without a Measles-Mumps-Rubella Vaccination Campaigna, and Based on 2 Initial Levels (Lower and Upper Bounds) of Measles-Mumps-Rubella Vaccine Coverage Prior to Initiation of Containment Efforts
| Assumed MMR Vaccine Coverageb | No. of Measles Case-Patientsc | Duration of Measles Outbreakc | Absolute Reduction in No. of Case-Patients and Duration of Outbreak | |||||||||
|---|---|---|---|---|---|---|---|---|---|---|---|---|
| Vaccination Campaign Not Included | Vaccination Campaign Included | Vaccination Campaign Not Included | Vaccination Campaign Included | |||||||||
| No. of Patients | 90% CI | No. of Patients | 90% CI | Duration, days | 90% CI | Duration, days | 90% CI | No. of Patients | 90% CI | Duration, days | 90% CI | |
| 14% (lower bound) | 18,978 | 18,944, 19,003 | 9,430 | 9,109, 9,844 | 213 | 195, 241 | 257 | 201, 308 | 9,548 | 9,128, 9,866 | −44 | −95, 22 |
| 68% (upper bound) | 8,472 | 8,447, 8,489 | 715 | 103, 1,338 | 195 | 179, 223 | 128 | 117, 139 | 7,757 | 7,130, 8,365 | 67 | 48, 98 |
Abbreviations: CI, confidence interval; MMR, measles-mumps-rubella.
a County health department clinics offering MMR vaccination were held from day 30 to day 123 of the outbreak; first doses of MMR were delivered to 8,726 unvaccinated persons.
b ≥1-dose MMR coverage.
c Median values and 90% CIs generated from 500 model simulations.
Results based on anecdotal immunization levels in the community of 40%–50% reported by local health departments are presented in Figure 3. Assuming an initial VC of 45%, in the absence of containment measures, the model predicted an outbreak with a median of approximately 13,000 cases. When the vaccination campaign was included, the model predicted a smaller outbreak, with a median of approximately 3,400 cases (Figure 3A); the 9,600 fewer cases were attributed to vaccination efforts. When model predictions that included the vaccination campaign were compared with what was observed (Figure 3B), approximately 3,000 excess cases were projected by the model, which may be accounted for by other factors (e.g., changes in community behavior, including social distancing, and other control efforts such as isolation and quarantining).
Figure 3.

Projected and observed daily incidence of measles cases during a measles outbreak in an Amish community, Ohio, 2014. A) Comparison of model trajectories with and without the measles-mumps-rubella vaccination campaign. B) Comparison of the model trajectories including the vaccination campaign with the observed epidemic curve (which included other control measures). Results from 100 iterations of the modeled epidemic curves are presented, assuming an initial vaccination coverage of 45%; the black dots show the median daily measles case incidence of all iterations. Note that the scales of the y-axes differ. Cumulative case incidence was as follows: model without vaccination—12,946 cases (90% confidence interval (CI): 12,919, 12,968) over the course of 207 days (90% CI: 187, 233); model with vaccination campaign—3,353 cases (90% CI: 2,551, 4,003) over the course of 247 days (90% CI: 183, 370); observed with control interventions—383 cases over the course of 121 days.
A comparison of the changes in the observed and projected daily estimates of Rc is shown in Figure 4. The observed Rc trajectory (which represents the effect of the vaccination campaign, other control efforts, and changes in community behavior) indicated a rapid decline in measles transmissibility over time. By contrast, declines in transmissibility were slower because of a depletion of susceptible persons due to infection plus the vaccination campaign (model with the vaccination campaign) and because of a depletion of susceptible persons due to infection alone (model without the vaccination campaign).
Figure 4.

Observed and projected daily estimates of the case reproduction number (Rc) and proportion of decline in Rc attributed to community and public health social distancing during a measles outbreak in an Amish community, Ohio, 2014. A) Observed and projected daily estimates of the case reproduction number (Rc) over sliding 14-day windows; the dotted and dotted-dashed lines show the median Rc of 100 model trajectories without and with the measles-mumps-rubella vaccination campaign, respectively, assuming an initial vaccination coverage of 45%. The diamonds show the observed mean Rc estimate (which included other control measures and changes in community behavior), the bars represent the 90% confidence intervals, and the horizontal dashed line indicates the threshold value Rc = 1. Observed and projected Rc estimates were derived from the likelihood-based estimation procedure and directly from the models, respectively. B) Proportion of decline in Rc attributable to changes in community behavior (social distancing) and other control efforts (isolation, quarantining) during the outbreak; data presented cover the period from the initiation of containment efforts to the time when projected estimates of Rc fall below 1. The reduction in transmissibility that could be ascribed to these factors varied from approximately 30% to 90% during the outbreak.
Sensitivity analyses found that varying several of the assumptions in this evaluation resulted in little change in the overall patterns of measles transmissibility. These included varying the choice of time window used to estimate R (see Web Figure 1 in the Web Appendix, available at https://academic.oup.com/aje); the use of daily counts of onset of symptoms (instead of onset of rash) to estimate R (Web Figure 2); an evaluation of a range of measles VE’s at baseline (Web Table 1); an evaluation of the effect of vaccination, assuming an effectiveness of 90.5% for campaign doses (Web Table 2); and an evaluation of delays in vaccine protection (immunological response) and outbreak response (Web Table 3).
DISCUSSION
Through monitoring of measles communicability during this outbreak, we showed that containment efforts probably contributed to reducing the spread of measles, and we demonstrated that launching comprehensive and timely public health responses can help avert the occurrence of large outbreaks in underimmunized populations. These findings corroborate previous results from an individual-based model also showing the potential for measles spread to other North American Amish communities in the absence of outbreak responses (6). As containment measures started to get under way, we found an approximately 4-fold reduction in transmissibility (Rt declined from 4.6 to 1) over the course of 2 weeks and subsequent maintenance of Rt below unity as control measures continued. Based on the observed epidemic curve, in the absence of vaccination or behavioral changes, cases could have continued to double approximately every 5 days in the early stages of the outbreak (see Web Appendix), and assuming a conservative scenario (initial vaccination coverage of 68%), the number of affected persons might have increased to approximately 8,400—that is, more than 20 times the number of cases observed (383 cases). Outbreaks of this magnitude have not been seen in the United States since elimination was declared (1). Based on hospitalization rates for measles in this community (5) and postelimination measles case-fatality ratios (20), such an outbreak could have resulted in approximately 275 hospitalizations and approximately 9 deaths (12 hospitalizations and no deaths were reported during the outbreak).
Evidence supporting immunization as a response to measles outbreaks is increasing. In a review of vaccination during outbreaks in middle- and low-income countries, Cairns et al. (3) noted an impact in 16 (42%) of 38 published articles, and updated World Health Organization guidelines recommend the use of this strategy in countries with measles mortality reduction goals (21). Fewer studies have evaluated the benefits of vaccination during outbreaks in elimination settings (5, 22–27), where background immunization coverage is high and outbreaks occur in undervaccinated subpopulations. In such evaluations, it is often challenging to account for a depletion of susceptible persons due to infection, or for other aspects related to outbreak control and community behavior—isolation of cases, quarantining of susceptible contacts, and self-imposed social distancing (e.g., limited attendance at church gatherings or social events because of measles awareness).
Our results suggest that the vaccination campaign could not have accounted entirely for the observed decrease in transmissibility (Figure 4). By immediately reducing the number of susceptible contacts each ill individual makes, these other factors seem to play an important role. Based on initial coverage of approximately 45%, we showed that approximately 3,000 fewer cases might be attributed to community engagement and behavioral changes. Yet, any factor that affects the force of infection during an outbreak, including spatial and social heterogeneity in mixing, unevenness in MMR vaccine coverage, or varying effects of control interventions in different areas (e.g., targeting primarily those exposed), could also have curbed transmission. Data on each of the components of outbreak response (particularly isolation and quarantining) are needed to disentangle their relative effectiveness (28), and quantifying and modeling the dynamics of behavior change in response to epidemics is a particular challenge and priority.
Our evaluation highlighted a few interesting aspects of measles transmissibility and outbreak control. First, considerable variability in transmission was evident early during the outbreak; estimates of Rc varied between 3.1 and 10.2 before interventions began. This variability may be an artifact of the estimation method, resulting from an initially low number of incident cases (8), or a reflection of differences in the contact rates of the first several case-patients. The latter could be an observation bias—if the first few cases generate many other cases, the outbreak gets past the chance of initial extinction and can spread beyond the initial cluster. Second, cases continued to occur for approximately 2 months after R fell below 1, indicating that sustained transmission can occur when R is near unity, and that both elimination efforts and outbreak control measures should aim to reduce R to a point as close to 0 as possible. A similar effect was observed in a previous outbreak of influenza (29) and could have resulted from interaction with the behavioral or public health response, where cases cause small clusters of secondary cases that are largely contained but might seed other sub-outbreaks elsewhere (30). Third, measures designed to control an exceedingly contagious disease like measles are likely to be more successful when the susceptible population is embedded in a general population with high uptake of MMR vaccine.
The measles containment strategies (16) implemented during this outbreak could serve as a guide on how to halt propagation of the disease in nonimmunized subpopulations in elimination settings. In the World Health Organization’s Region of the Americas, for example, despite 1-dose measles vaccine coverage being maintained at 90% or more since 1998 (31) and a declaration of measles elimination in 2016 (32), recent outbreaks reported in Ecuador (33), Canada (34), the United States (1, 35), and Brazil (36) indicate that coverage is not homogenous. These outbreaks ranged considerably in size and duration (147–1,065 confirmed measles cases and durations of 9 weeks to 1.5 years) and were characterized by varying containment efforts. In the United States, reports of measles cases are expected within 24 hours of confirmation (16), triggering the implementation of enhanced surveillance and measures to limit spread. Key elements in curtailing transmission include isolation of case-patients until they are no longer infectious, vaccination of susceptible contacts, and quarantining of susceptible contacts who cannot be vaccinated (16).
Our analysis had several limitations. First, often not all causes of heterogeneity can be accounted for in models. Measles was reported in 9 Ohio counties (5), and homogenous mixing does not account for more complex spatial patterns of spread in this community or for preferential mixing by age. However, at least part of the heterogeneity in contact rates is captured by the initial R values, which we then use to obtain the projected model estimates. Similarly, any underlying heterogeneity in immunity was unknown, yet a broad range of coverage scenarios were modeled, and an impact of control measures was evident under a conservative scenario. Notably, the model also assumes a homogenous effect of vaccination efforts, which may underestimate their impact. In addition, final outbreak sizes and the impact of the interventions depend on the estimated population at risk, and we did not measure the impact of the response in limiting spread to other Amish communities, including those outside Ohio (6). Because of these caveats, the trajectories we present should not be viewed as exact projections, but they characterize probable trends in transmissibility and in the potential for control.
Second, case underascertainment might have occurred; however, enhanced surveillance, widespread knowledge of the outbreak, and established relationships with the community probably improved case identification (5). Importantly, estimates of R would not be affected as long as surveillance does not change considerably during the outbreak (8, 10), and sudden decreases or increases in case reporting were unlikely.
Third, we chose an infectious period of 9 days based on outbreak control guidelines (16, 37, 38), which may be closer to the maximum duration of infectiousness and may be long for models assuming that this period is the mean of an exponential distribution. However, the number of cases prevented by vaccination using a shorter infectious period (19) was still significant, and our base model tracked the initial outbreak trajectory better (Web Table 4).
Fourth, we did not account for imperfect or delayed vaccine protection from campaign doses. However, sensitivity analyses using a lower VE (18) and delaying vaccine protection by 1 week did not have a substantial impact on our findings.
Finally, this was an evaluation of a single outbreak; our findings may not be generalizable to all communities where measles importations occur, and the assumption of homogenous mixing may not be applicable to other measles outbreaks in postelimination settings.
These findings demonstrate the substantial public health impact of rapid measles containment efforts in an unvaccinated community in an elimination setting. Our results reinforce the World Health Organization’s measles elimination strategy, which includes outbreak preparedness as one of the core components to achieve elimination targets in 5 of the 6 World Health Organization regions by 2020 (21). Measles elimination is a fragile state (39), and the data provided here may serve as an impetus for local and international health organizations to allocate resources to build and maintain capacity for measles outbreak readiness, including in countries where measles incidence is sufficiently low or elimination has been achieved. The single best means of measles containment, however, is maintaining high initial levels of vaccination coverage across the population.
Supplementary Material
ACKNOWLEDGMENTS
Author affiliations: Division of Viral Diseases, Centers for Disease Control and Prevention, Atlanta, Georgia (Paul A. Gastañaduy, Gregory S. Wallace); Centre for the Mathematical Modelling of Infectious Diseases, London School of Hygiene and Tropical Medicine, London, United Kingdom (Sebastian Funk); Division of Nutrition, Physical Activity, and Obesity, Centers for Disease Control and Prevention, Atlanta, Georgia (Prabasaj Paul); Ohio Department of Health, Columbus, Ohio (Lilith Tatham, Nicholas Fisher, Jeremy Budd, Brian Fowler, Sietske de Fijter, Mary DiOrio); and Department of Ecology and Evolutionary Biology, Woodrow Wilson School of Public and International Affairs, Princeton University, Princeton, New Jersey (Bryan Grenfell).
This work was supported by the Medical Research Council (fellowship MR/K021680/1 to S.F.); the Bill and Melinda Gates Foundation (grant OPP1091919); the RAPIDD Program of the Science and Technology Directorate, US Department of Homeland Security; the Fogarty International Center, National Institutes of Health; and a Centers for Disease Control and Prevention research award (award 200-2015-M-87505) to Princeton University (B.G.).
We are indebted to the personnel who led case investigations and vaccination clinics at the following departments of health in jurisdictions affected by the outbreak: Ashland County-City Health Department, Coshocton County Health Department, Holmes County Health Department, Knox County Health Department, Richland County Public Health, and Wayne County Health Department.
The findings and conclusions presented in this report are those of the authors and do not necessarily represent the official position of the Centers for Disease Control and Prevention.
Conflict of interest: none declared.
Abbreviations
- CI
confidence interval
- MMR
measles-mumps-rubella
REFERENCES
- 1. Fiebelkorn AP, Redd SB, Gastañaduy PA, et al. . A comparison of postelimination measles epidemiology in the United States, 2009–2014 versus 2001–2008. J Pediatric Infect Dis Soc. 2017;6(1):40–48. [DOI] [PMC free article] [PubMed] [Google Scholar]
- 2. Papania MJ, Wallace GS, Rota PA, et al. . Elimination of endemic measles, rubella, and congenital rubella syndrome from the Western Hemisphere: the US experience. JAMA Pediatr. 2014;168(2):148–155. [DOI] [PubMed] [Google Scholar]
- 3. Cairns KL, Perry RT, Ryman TK, et al. . Should outbreak response immunization be recommended for measles outbreaks in middle- and low-income countries? An update. J Infect Dis. 2011;204(suppl 1):S35–S46. [DOI] [PubMed] [Google Scholar]
- 4. Ortega-Sanchez IR, Vijayaraghavan M, Barskey AE, et al. . The economic burden of sixteen measles outbreaks on United States public health departments in 2011. Vaccine. 2014;32(11):1311–1317. [DOI] [PubMed] [Google Scholar]
- 5. Gastañaduy PA, Budd J, Fisher N, et al. . A measles outbreak in an underimmunized Amish community in Ohio. N Engl J Med. 2016;375(14):1343–1354. [DOI] [PubMed] [Google Scholar]
- 6. Thompson KM, Kisjes KH. Modeling measles transmission in the North American Amish and options for outbreak response. Risk Anal. 2016;36(7):1404–1417. [DOI] [PubMed] [Google Scholar]
- 7. Anderson RM, May RM. Infectious Diseases of Humans: Dynamics and Control. New York, NY: Oxford University Press; 1991. [Google Scholar]
- 8. Cori A, Ferguson NM, Fraser C, et al. . A new framework and software to estimate time-varying reproduction numbers during epidemics. Am J Epidemiol. 2013;178(9):1505–1512. [DOI] [PMC free article] [PubMed] [Google Scholar]
- 9. Klinkenberg D, Nishiura H. The correlation between infectivity and incubation period of measles, estimated from households with two cases. J Theor Biol. 2011;284(1):52–60. [DOI] [PubMed] [Google Scholar]
- 10. Wallinga J, Teunis P. Different epidemic curves for severe acute respiratory syndrome reveal similar impacts of control measures. Am J Epidemiol. 2004;160(6):509–516. [DOI] [PMC free article] [PubMed] [Google Scholar]
- 11. Johnson P. adaptivetau: Efficient Stochastic Simulations in R. Vienna, Austria:R Foundation for Statistical Computing; 2014. https://cran.r-project.org/web/packages/adaptivetau/vignettes/adaptivetau.pdf. Accessed February 1, 2016. [Google Scholar]
- 12. McLean HQ, Fiebelkorn AP, Temte JL, et al. . Prevention of measles, rubella, congenital rubella syndrome, and mumps, 2013: summary recommendations of the Advisory Committee on Immunization Practices (ACIP). MMWR Recomm Rep. 2013;62(RR-04):1–34. [PubMed] [Google Scholar]
- 13. Wenger OK, McManus MD, Bower JR, et al. . Underimmunization in Ohio’s Amish: parental fears are a greater obstacle than access to care. Pediatrics. 2011;128(1):79–85. [DOI] [PubMed] [Google Scholar]
- 14. Young Center for Anabaptist and Pietist Studies, Elizabethtown College Twelve Largest Amish Settlements, 2014. Elizabethtown, PA: Elizabethtown College; 2014. https://groups.etown.edu/amishstudies/files/2016/09/Twelve-Largest-Amish-Settlements-2014.pdf. Accessed March 21, 2014. [Google Scholar]
- 15. Hales CM, Johnson E, Helgenberger L, et al. . Measles outbreak associated with low vaccine effectiveness among adults in Pohnpei State, Federated States of Micronesia, 2014. Open Forum Infect Dis. 2016;3(2):ofw064. [DOI] [PMC free article] [PubMed] [Google Scholar]
- 16. Gastañaduy PA, Redd SB, Clemmons NS, et al. . Chapter 7: measles. In: Roush SW, Baldy LM, eds. Manual for the Surveillance of Vaccine-Preventable Diseases [electronic textbook]. 6th ed Atlanta, GA: Centers for Disease Control and Prevention; 2013:7.1–7.22. http://www.cdc.gov/vaccines/pubs/surv-manual/chpt07-measles.pdf. Accessed September 22, 2015. [Google Scholar]
- 17. Uzicanin A, Zimmerman L. Field effectiveness of live attenuated measles-containing vaccines: a review of published literature. J Infect Dis. 2011;204(suppl 1):S133–S148. [DOI] [PubMed] [Google Scholar]
- 18. Barrabeig I, Rovira A, Rius C, et al. . Effectiveness of measles vaccination for control of exposed children. Pediatr Infect Dis J. 2011;30(1):78–80. [DOI] [PubMed] [Google Scholar]
- 19. Keeling MJ, Grenfell BT. Understanding the persistence of measles: reconciling theory, simulation and observation. Proc Biol Sci. 2002;269(1489):335–343. [DOI] [PMC free article] [PubMed] [Google Scholar]
- 20. Fiebelkorn AP, Redd SB, Gallagher K, et al. . Measles in the United States during the postelimination era. J Infect Dis. 2010;202(10):1520–1528. [DOI] [PubMed] [Google Scholar]
- 21. World Health Organization Global Measles and Rubella Strategic Plan: 2012–2020. Geneva, Switzerland: World Health Organization;2012. http://apps.who.int/iris/bitstream/10665/44855/1/9789241503396_eng.pdf. Accessed April 23, 2016. [Google Scholar]
- 22. Enanoria WT, Liu F, Zipprich J, et al. . The effect of contact investigations and public health interventions in the control and prevention of measles transmission: a simulation study. PLoS One. 2016;11(12):e0167160. [DOI] [PMC free article] [PubMed] [Google Scholar]
- 23. Braeye T, Sabbe M, Hutse V, et al. . Obstacles in measles elimination: an in-depth description of a measles outbreak in Ghent, Belgium, spring 2011. Arch Public Health. 2013;71:17. [DOI] [PMC free article] [PubMed] [Google Scholar]
- 24. Breakwell L, Moturi E, Helgenberger L, et al. . Measles outbreak associated with vaccine failure in adults—Federated States of Micronesia, February–August 2014. MMWR Morb Mortal Wkly Rep. 2015;64(38):1088–1092. [DOI] [PubMed] [Google Scholar]
- 25. Chatterji M, Baldwin AM, Prakash R, et al. . Public health response to a measles outbreak in a large correctional facility, Queensland, 2013. Commun Dis Intell Q Rep. 2014;38(4):E294–E297. [PubMed] [Google Scholar]
- 26. Jones G, Haeghebaert S, Merlin B, et al. . Measles outbreak in a refugee settlement in Calais, France: January to February 2016. Euro Surveill. 2016;21(11):30167. [DOI] [PubMed] [Google Scholar]
- 27. O’Connor B, Cotter S, Heslin J, et al. . Catching measles in an appropriately vaccinated group: a well-circumscribed outbreak in the South East of Ireland, September–November 2013. Epidemiol Infect. 2016;144(15):3131–3138. [DOI] [PMC free article] [PubMed] [Google Scholar]
- 28. Lipsitch M, Bergstrom CT. Invited commentary: real-time tracking of control measures for emerging infections. Am J Epidemiol. 2004;160(6):517–519. [DOI] [PubMed] [Google Scholar]
- 29. Nishiura H. Time variations in the transmissibility of pandemic influenza in Prussia, Germany, from 1918–19. Theor Biol Med Model. 2007;4:20. [DOI] [PMC free article] [PubMed] [Google Scholar]
- 30. Funk S, Jansen VAA. The talk of the town: modelling the spread of information and changes in behaviour In: Manfredi P, d’Onofrio A, eds. Modeling the Interplay Between Human Behavior and the Spread of Infectious Diseases. New York, NY: Springer Science+Business Media; 2013:93–102. [Google Scholar]
- 31. Castillo-Solorzano CC, Matus CR, Flannery B, et al. . The Americas: paving the road toward global measles eradication. J Infect Dis. 2011;204(suppl 1):S270–S278. [DOI] [PubMed] [Google Scholar]
- 32. Pan American Health Organization Region of the Americas is declared free of measles. 2016. http://www.paho.org/hq/index.php?option=com_content&view=article&id=12528:ron-americas-declared-free-measles&Itemid=1926&lang=en. Accessed October 25, 2016.
- 33. Le NK, Mhaskar R, Hoare I, et al. . Reemergence of measles in the Americas: the genotype B3 2011–2012 outbreak in Ecuador. Vaccines (Basel). 2017;5(2):E15. [DOI] [PMC free article] [PubMed] [Google Scholar]
- 34. De Serres G, Markowski F, Toth E, et al. . Largest measles epidemic in North America in a decade—Quebec, Canada, 2011: contribution of susceptibility, serendipity, and superspreading events. J Infect Dis. 2013;207(6):990–998. [DOI] [PubMed] [Google Scholar]
- 35. Zipprich J, Winter K, Hacker J, et al. . Measles outbreak—California, December 2014–February 2015. MMWR Morb Mortal Wkly Rep. 2015;64(6):153–154. [PMC free article] [PubMed] [Google Scholar]
- 36. Leite RD, Barreto JL, Sousa AQ. Measles reemergence in Ceará, northeast Brazil, 15 years after elimination. Emerg Infect Dis. 2015;21(9):1681–1683. [DOI] [PMC free article] [PubMed] [Google Scholar]
- 37. Measles and Rubella Elimination Working Group Guidelines for the Prevention and Control of Measles Outbreaks in Canada. Ottawa, ON, Canada: Public Health Agency of Canada; 2013. (Canada Communicable Disease Report, vol. 39, ACS-3). http://www.phac-aspc.gc.ca/publicat/ccdr-rmtc/13vol39/acs-dcc-3/assets/pdf/meas-roug-eng.pdf. Accessed January 13, 2017. [DOI] [PMC free article] [PubMed] [Google Scholar]
- 38. Communicable Diseases Network Australia Measles: CDNA National Guidelines for Public Health Units. Canberra, ACT, Australia: Australian Government Department of Health;2015. http://www.health.gov.au/internet/main/publishing.nsf/Content/BD2AD79FD34BFD14CA257BF0001D3C59/$File/Measles-SoNG-final-April2015.pdf. Accessed January 13, 2017. [Google Scholar]
- 39. Hinman AR, Hahn C, Maldonado Y, et al. . Verification and Documentation of Elimination of Measles and Rubella as Endemic Diseases From the United States: Summary and Conclusions of an External Expert Panel. Atlanta, GA: Centers for Disease Control and Prevention; 2011. https://www.cdc.gov/measles/downloads/expert-panel-elimination-measles.pdf. Accessed July 19, 2016. [Google Scholar]
Associated Data
This section collects any data citations, data availability statements, or supplementary materials included in this article.