Abstract
Adult neurogenesis in the dentate gyrus of the hippocampus is highly regulated by environmental influences, and functionally implicated in behavioral responses to stress and antidepressants1,2,3,4. However, how adult-born neurons regulate dentate gyrus information processing to protect from stress-induced anxiety-like behavior is unknown. Here we show that neurogenesis confers resilience to chronic stress by inhibiting the activity of mature granule cells in the ventral dentate gyrus (vDG), a subregion implicated in mood regulation. We found that chemogenetic inhibition of adult-born neurons in the vDG promotes susceptibility to social defeat stress while increasing neurogenesis confers resilience to chronic stress. Using in vivo calcium (Ca2+) imaging to record neuronal activity from large cell populations in the vDG, we show that increased neurogenesis results in a decrease in the activity of “stress-responsive cells” that are active preferentially during attacks or while mice explore anxiogenic environments. These effects on dentate gyrus activity are necessary and sufficient for stress resilience, as direct silencing of the vDG confers resilience, while excitation promotes susceptibility. Our results suggest that the activity of the vDG may be a key factor in determining individual levels of vulnerability to stress and related psychiatric disorders.
The hippocampus is a functionally heterogeneous structure along its dorsal-ventral axis5. While the dorsal pole predominantly regulates cognition, the ventral pole has been implicated in stress responses and anxiety6,7. Within the dentate gyrus region of the hippocampus, young granule neurons continue to be generated in adulthood6,8–10. These adult-born neurons undergo a critical developmental period of heightened synaptic plasticity at 4–6 weeks post mitosis, during which they exert distinct contributions to behavior11–13. Consistent with the role of the ventral hippocampus in mood regulation, adult-born neurons mediate some of the behavioral effects of antidepressants,2,14 and protect against stress-induced neuroendocrine and behavioral impairments.1,15,16
To investigate whether the activity of adult-born granule cells (abGCs) in the ventral dentate gyrus (vDG) is required to protect from stress-induced anxiety-like behaviors, we generated a new loss-of-function model to chemogenetically silence abGCs in vivo. We expressed the inhibitory designer receptor exclusively activated by designer drugs (DREADD), hM4Di, in abGCs by crossing a transgenic mouse line with a tamoxifen (TMX)-inducible CreERT2 recombinase, expressed under the control of the Nestin gene promoter,17 to mice expressing STOP-floxed hM4Di18 (Nestin-CreERT +/−; stop-mCherry-hM4Difl/fl; referred to as i-hM4Di mice). In vitro electrophysiology confirmed that the DREADD receptor agonist, clozapine-N-oxide (CNO), decreased abGC activity (Extended Data Fig. 1). We then silenced abGCs in vivo, using cannula-mediated delivery of CNO directly into the vDG every day during a subthreshold social defeat paradigm of 5 days (Fig. 1a,b). This short paradigm was used because it is not sufficient to alter behavior in CRE− control mice19. However, silencing abGCs with CNO produced robust avoidance in a social interaction test (Fig. 1c) and reduced center exploration in the open field in defeated i-hM4Di mice that express hM4Di in young neurons (CRE+) (Fig. 1d, Extended Data Fig. 2a-d).
Figure 1. Silencing adult-born neurons promotes stress susceptibility and increases vDG excitability.
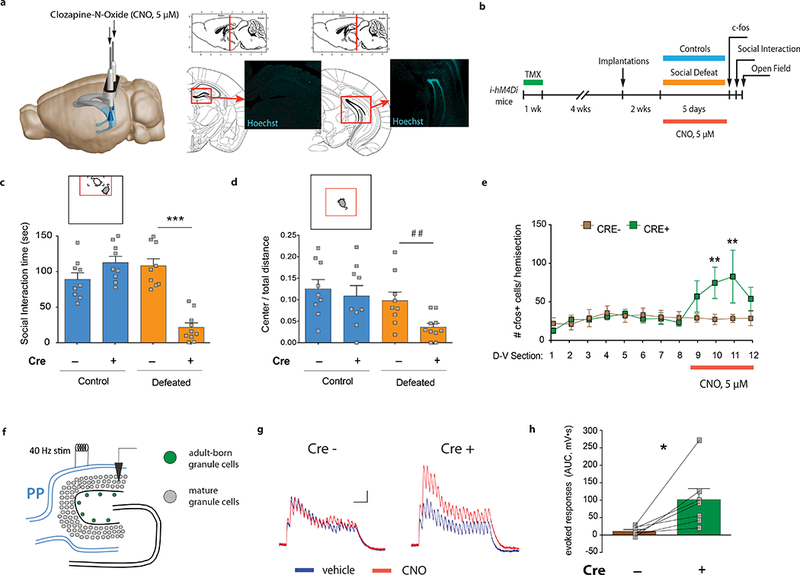
| a, Cannula placement and Hoechst33342 dye infusions into the vDG. Image adapted from Allen Institute Brain Explorer 2 (http://mouse.brain-map.org/static/brainexplorer). b, Experimental design for subthreshold defeat. TMX, tamoxifen; CNO, clozapine-N-oxide. c, Silencing abGCs decreases social interaction time (Interaction F1,33=40.98, ***P<0.001; genotype F1,33=13.46, ***P=0.0009; stress F1,33=17.7, ***P=0.0002; post-hoc test, ***P<0.001; N=9, 9, 9, 10). d, Silencing abGCs decreases open field center exploration (Interaction F1,33=1.4, P=0.25; genotype F1,33=4.2, *P =0.048; stress F1,33=6.9, *P =0.01; planned comparison t-test, ##P=0.009; N=9, 9, 9, 10). e, Quantification of c-fos+ cells (Interaction F11,176=2.1, *P=0.02; genotype F1,16=1.2, P=0.28; dorsal-ventral F11,176=2.2, *P=0.01; post-hoc test, section 10: **P=0.008, section 11: **P=0.002, NCRE−=8, NCRE+=10). D-V; dorsal-ventral axis. f, Schematic and g, representative responses of mature granule cells (mGCs) to perforant path (PP) stimulation in vitro. Scale bars: 2 mV, 100 ms. h, Area under the curve (AUC) quantification of evoked responses (paired t-test, *P=0.02; N=7). Error bars, ± s.e.m.
To investigate how silencing abGCs affects the activity of the vDG in response to stress, we then examined expression of the immediate early gene c-fos as a proxy marker for neuronal activity. The number of c-fos+ cells was selectively increased in the vDG upon silencing of abGCs during stress in vivo (Fig. 1e). Consistent with this effect, in vitro electrophysiological recordings from mature vDG granule cells showed increased evoked responses to perforant path stimulation after silencing abGCs with CNO (Fig. 1f-h). These results indicate that silencing young neurons increases the activity of mature granule cells in response to stress, and causes decreased social behavior and increased anxiety-like behavior.
Environmental influences that promote resilience to stress, such as enrichment or voluntary exercise, have been shown to increase neurogenesis20,21. We thus wanted to test whether increasing neurogenesis was sufficient to confer stress resilience. To do this, we used a gain-of-function model to increase neurogenesis by inducible deletion of the proapoptotic gene, BAX, from adult neural stem cells and their progeny (Nestin-CreER T2 +/−; Baxfl/fl; referred to as iBax mice22) (Fig. 2a). iBax mice were subjected to a chronic version of social defeat stress (10 days)23 and subsequently tested in the social interaction test and in the open field (Fig. 2b). Deletion of BAX from adult neural stem cells (CRE+) produced a ~2-fold increase in young Dcx-positive neurons (Fig. 2c) and a ~6-fold increase in cell survival compared to control mice (CRE−) (Extended Data Fig. 3a,b). In contrast to the 5-day subthreshold defeat paradigm (Fig. 1b), chronic defeat for 10 days (Fig. 2b) produces robust social avoidance and anxiety-like behavior. Defeated CRE− mice spent ~42% less time interacting with a novel mouse than undefeated mice, while defeated iBax mice with increased neurogenesis (CRE+) showed control levels of social interaction (Fig. 2d). Similar effects were observed in the open field, in which defeated CRE− mice showed ~50% less center exploration than undefeated mice, while defeated iBax mice exhibited control levels of center exploration (Fig. 2e, Extended Data Fig. 2e-h). These results suggest that increased neurogenesis can confer resilience to chronic stress. To strengthen this conclusion, we showed that ablating neurogenesis by focal X-ray irradiation of the vDG abolished these pro-resilience effects (Extended Data Fig. 3c-j), confirming that abGCs located specifically in the vDG are responsible for the stress resilience of iBax mice.
Figure 2. Increasing neurogenesis confers stress resilience and attenuates vDG excitability.
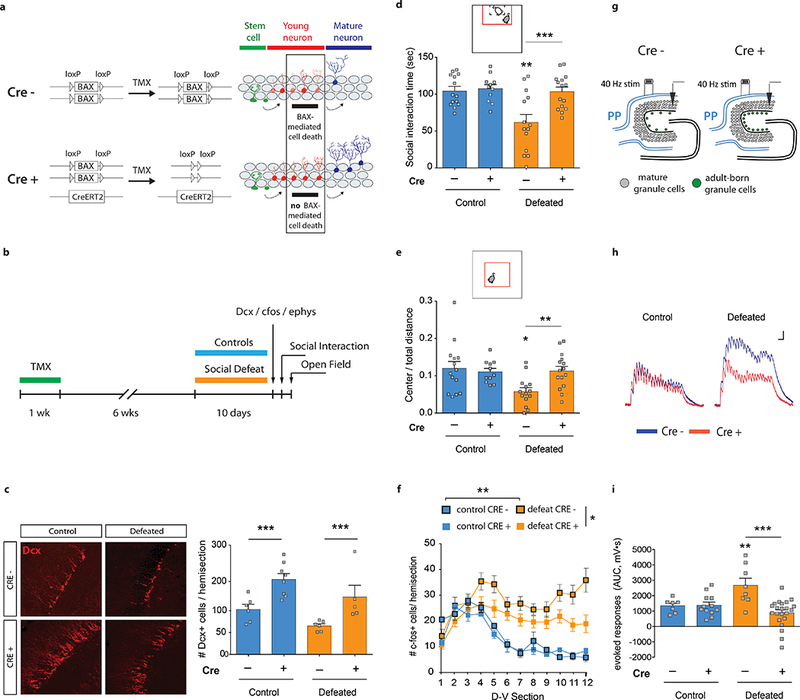
| a, Gain-of-function strategy to increase neurogenesis (iBax mice). TMX, tamoxifen. b, Experimental design for chronic defeat. c, Quantification of Dcx+ cells (Interaction F1,21=0.007, P=0.9; genotype F1,21=20.1, ***P=0.0002; stress F1,21=6.7 *P=0.02; N=6, 8, 6, 5). d, Social interaction time (Interaction F1,50=6.5, *P=0.014; genotype F1,50=9.0, **P=0.004; stress F1,50=9.5, **P=0.003; post-hoc test, ***P=0.002; N=14, 11, 14, 15). e, Open field center exploration (Interaction F1,50=5.7, *P=0.021; genotype F1,50=2.9, P=0.097; stress F1,50=4.9, *P=0.032; post-hoc test, **P=0.004; N=14, 11, 14, 15). f, Quantification of c-fos+ cells (Interaction F33,319=3.1, ***P<0.001; stress F3,29=5.5, **P=0.004; dorsal-ventral F11,319=8.5, ***P<0.0001; post hoc test, **Pcontrol,CRE− vs defeat,CRE−=0.007; NControl,CRE−=3, NDefeat,CRE−=12; *Pdefeat,CRE− vs defeat,CRE+=0.015; NControl,CRE+=3, NDefeat,CRE+=15). CRE+ iBax mice have less stress-induced c-fos+ cells than CRE− mice (Interaction F11,275=2.1, *P=0.02; genotype F1,25=5.8, *P=0.02; dorsal-ventral F11,275=10.7, ***P<0.001; NDefeat,CRE−=12, NDefeat,CRE+=15). D-V; dorsal-ventral axis. g, Schematic and h, representative recordings from mGCs upon PP stimulation in vitro. Scale bars: 1 mV, 50 ms i, Area under the curve (AUC) quantification of evoked responses (Interaction F1,45=11.05, **P=0.0018; genotype F1,45=10.1, **P=0.003; stress F1,45=2.3, P=0.13; post-hoc test, ***P<0.001; N=7, 12, 8, 22). Error bars, ± s.e.m.
We next investigated the activity of the vDG in iBax mice. Chronic social defeat increased the number of c-fos+ cells in the vDG (sections 4–12) compared to undefeated controls, while this effect was attenuated in iBax mice (Fig. 2f). In vitro electrophysiological recordings in CRE− mice showed increased evoked responses compared with undefeated controls. This effect was absent in iBax mice (Fig. 2g-i). These findings show that increased neurogenesis reduces chronic stress-induced elevation.
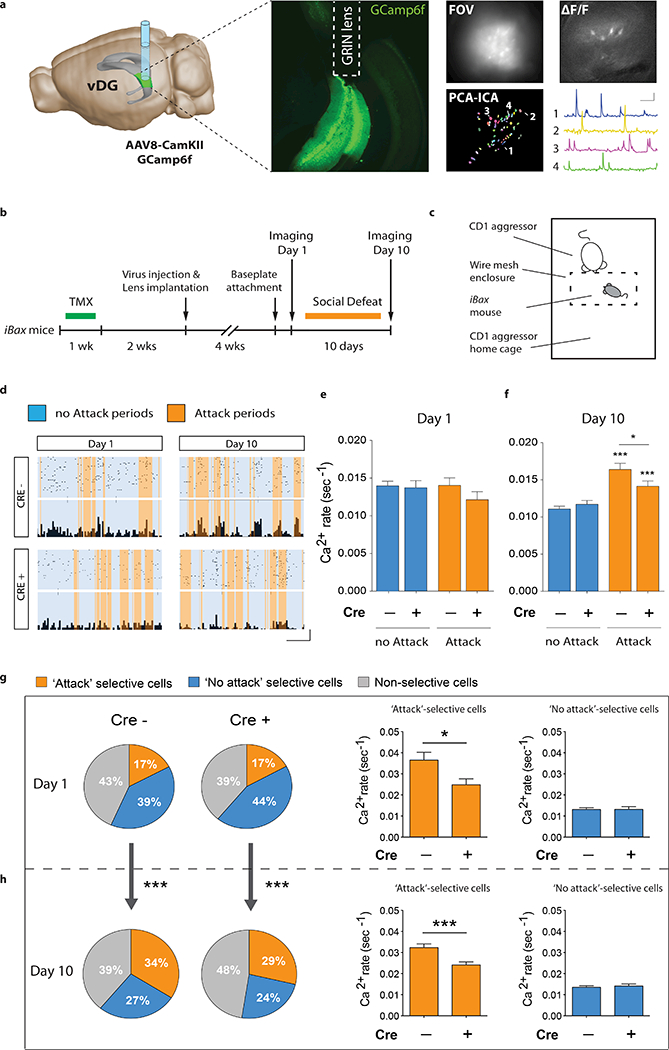
To determine how stress-related information is represented in the vDG and modulated by neurogenesis, we used in vivo calcium (Ca2+) imaging of mature granule cells (Fig. 3a) while mice were attacked by an aggressor mouse through a protective wire-mesh enclosure (Fig. 3b,c). On the first day of defeat (Day 1), no significant Ca2+ transient rate differences were observed between ‘no-attack’ and ‘attack’ periods (Fig. 3d,e). After chronic defeat (Day 10), vDG granule cells showed increased Ca2+ transient rates during ‘attack’ bouts compared to ‘no-attack’ bouts in CRE− mice. This effect was attenuated in iBax mice (Fig. 3d,f; Extended Data Fig. 4a-d).
Figure 3. Neurogenesis inhibits vDG activity after chronic stress.
| a, Left panel: Schematic illustrating GRIN lens placement and GCamp6f expression. Image adapted from Allen Institute Brain Explorer 2 (http://mouse.brain-map.org/static/brainexplorer). Right panel: Representative images of FOV, ΔF/F signals, PCA-ICA, and Ca2+ transients. Scale bar: 50 sec, 5 s.d. b, Experimental design. c, Mice were imaged in a protective wire mesh enclosure inside the aggressor cage. d, Representative rasterplots of Ca2+ transient events. Each line represents one cell. Bottom panels show cumulative Ca2+ transient rates. Scale bar: 50 sec, 0.015 Ca2+ transient event rate. Representative 280 sec periods from a 600 sec recording are shown. e, Ca2+ transient rates on Day 1 (‘no-attack’: Mann Whitney U=52962, P=0.16; ‘attack’: U=55260, P=0.59; NCRE−=460, NCRE+=246). f, Ca2+ transient rates are increased during attack periods on Day 10 (Wilcoxon matched-pairs signed rank, ***PCRE−<0.0001; NCRE−=620; ***PCRE+=0.0002; NCRE+=592). CRE+ iBax mice show lower attack responses than CRE− mice (U=169211, *P=0.017). g, Cell selectivity on Day 1. Ca2+ transient rates of ‘attack’ selective cells on Day 1 (U=1272, *P=0.027; NCRE−=80, NCRE+=42). Ca2+ transient rates of ‘no-attack’ selective cells on Day 1 (U=8825, P=0.19; NCRE−=180, NCRE+=108). h, Cell selectivity analysis on Day 10 showed more ‘attack’ selective cells compared to Day 1 (Chi-squared test: Χ2CRE−(2)=40.13, ***PCRE−<0.0001, NCRE−=620; Χ2CRE+(2)=36.14, ***PCRE+<0.0001, NCRE+=592). Ca2+ transient rates of ‘attack’ selective cells on Day 10 (U=12725, ***P<0.0001; NCRE−=211, NCRE+=169). Ca2+ transient rates of ‘no-attack’ selective cells on Day 10 (U=11544, P=0.72; NCRE−=169, NCRE+=140). Data distributions are shown in Extended Data Figures 8 and 10. Error bars, ± s.e.m.
To assess whether mature vDG granule cells display heterogeneous responses to attacks, we then used cell selectivity analyses and identified a subset of cells (17%) in CRE− mice and in iBax mice that were active selectively during attack bouts on the first day of defeat (Fig. 3g). These attack-selective cells exhibited lower Ca2+ transient rates during attack periods in iBax mice than in CRE− mice (Fig. 3h). No rate differences were observed in ‘no-attack’-selective cells during periods of no attacks (Fig. 3i), or in ‘non-selective’ cells (Extended Data Fig. 5a,b). After chronic defeat (Day 10), the fraction of ‘attack’-selective cells was significantly increased compared to Day 1 (CRE−: 34%; CRE+ (iBax): 29%) (Fig. 3j). Again, Ca2+ transient rates of ‘attack’-selective cells during ‘attack’ periods were lower in iBax mice than in CRE− mice (Fig. 3k), while no rate differences were observed in ‘no-attack’-selective cells during periods of no attacks (Fig. 3l) or in non-selective cells (Extended Data Fig. 5c). These results suggest that increased neurogenesis in iBax mice results in a decrease in the activity of ‘attack-selective’ cells in the vDG. Similar results were obtained when considering the area under significant Ca2+ transients, amplitudes, or cumulative frequency distributions, (Extended Data Figs. 5, 6). This neurogenesis-dependent reduction in vDG activity extended to stress-induced anxiety-like behavior in the social interaction test and in the open field test (Extended Data Figs. 4e-o, 7,8). Together, these results suggest that abGCs inhibit the activity of mature granule cells in the vDG, which in turn results in decreased anxiety-like behaviors after chronic stress.
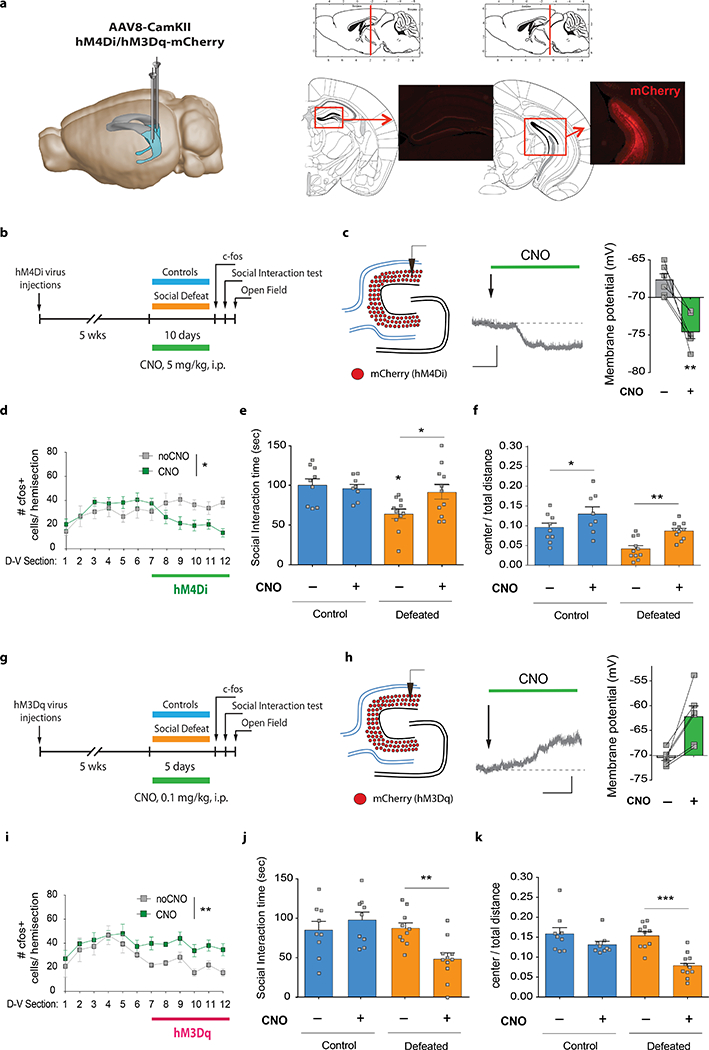
Finally, to test whether vDG inhibition is sufficient to confer resilience, we directly silenced mature granule cells using viral-mediated expression of hM4Di (Fig. 4a,b). CNO hyperpolarized hM4Di–expressing granule cells in vitro (Fig. 4c) and reduced the chronic stress-induced increase in c-fos+ cells in the vDG in vivo (Fig. 4d). Direct silencing of mature granule cells counteracted the chronic defeat-induced reduction in social interaction time (Fig. 4e) and open field center exploration (Fig. 4f), suggesting that vDG inhibition is sufficient to confer stress resilience. Conversely, direct excitation of mature vDG granule cells by activating virally-expressed hM3Dq receptors with CNO (Fig. 4g) depolarized hM3Dq–expressing neurons in vitro (Fig. 4h) and increased the number of c-fos+ cells in vivo after subthreshold defeat (Fig. 4i). This direct excitation resulted in reduced social interaction time (Fig. 4j) and open field center exploration (Fig. 4k), indicating that vDG excitation is sufficient to promote stress susceptibility. In addition, the stress susceptible phenotype of i-hM4Di mice was counteracted by simultaneously inhibiting mature granule cells, while the resilient phenotype of iBax mice was abolished by directly exciting mature GCs (Extended Data Fig. 9). Overall, these data demonstrate that the behavioral effects of neurogenesis are mediated by a modulation of mature granule cell activity.
Figure 4 |. Direct modulation of vDG activity can regulate stress resilience.
a, Virus injections and mCherry expression. Image adapted from Allen Institute Brain Explorer 2 (http://mouse.brain-map.org/static/brainexplorer). b, Experimental design for vDG inhibition during chronic defeat (10 days). c, Resting membrane potential of hM4Di infected cells (paired t-test, **P=0.004, N=6). Scale bars: 5 mV, 2 min. d, Quantification of c-fos+ cells after chronic defeat (sections 7–12: Interaction F5,40=3.5, *P=0.01; CNO F1,8=6.9, *P=0.03; dorsal-ventral F5,40=1.3, P=0.29; NnoCNO=4, NCNO=6). e, Social interaction time (Interaction F1,35=4.2, *P=0.049; CNO F1,35=2.2, P=0.15; stress F1,35=6.9, *P=0.013; post-hoc test, *P=0.01; N=9, 8, 11, 11). f, Open field center exploration (Interaction F1,35=0.1, P=0.73; CNO F1,35=14.4, ***P=0.0006; stress F1,35=19.2, ***P=0.0001; post-hoc test, control veh vs. CNO, *P=0.03; defeat veh vs. CNO, **P=0.004; N=9, 8, 11, 11). g, Experimental design for vDG excitation during subthreshold defeat (5 days). h, Resting membrane potential of hM3Dq infected cells (paired t-test, **p=0.009, N=6). Scale bars: 5mV, 2min. i, Quantification of c-fos+ cells after subthreshold defeat (sections 7–12: Interaction F5,35=0.15, P=0.98; CNO F1,7=12.3, **P=0.009; dorsal-ventral F5,35=4.8, **P=0.002; NnoCNO=4, NCNO=5). j, Social interaction time (Interaction F1,35=8.4, **P=0.007; CNO F1,35=2.1, P=0.15; stress F1,35=6.9, *P=0.012; post-hoc test, **P=0.003; N=9, 9, 10, 11). k, Open field center exploration (Interaction F1,35=4.7, *P=0.037; CNO F1,35=21.4, ***P<0.0001; stress F1,35=6.6, *P=0.014; post-hoc test, ***P<0.0001; N=9, 9, 10, 11). Error bars, ± s.e.m.
Determining how neurogenesis regulates dentate gyrus information processing is crucial for our understanding of how adult-born neurons affect behavior. Recent work has shown that adult-born neurons can inhibit mature granule cells via a mechanism potentially implicating GABAergic hilar interneurons during hippocampus-dependent tasks13,24–26. Furthermore, the ventral CA1 contains cells that specifically encode anxiety-related information27, and glutamatergic efferents from the ventral hippocampus can promote anxiety-like behavior27–29 (but see also Extended Data Fig. 10). Here we show that the vDG contains a population of cells that selectively respond to stressful stimuli, that this population of ‘stress-responsive cells’ is inhibited by adult-born neurons, and that this inhibition protects against the anxiogenic effects of a chronic social defeat paradigm.
Taken together, our results show that regulation of vDG activity confers resilience to chronic stress, and suggest that strategies aimed at inhibiting the vDG may be protective against stress-related psychiatric disorders, such as anxiety and depression.
Methods |
Animal Subjects.
Husbandry.
Mice were housed in groups of 3–5 per cage with ad libitum access to food and water on a 12:12-h light/dark schedule. All behavioral testing was conducted during the light period.
Experimental mice.
i-hM4Di and iBax mice were bred in house. C57/BL6J wild-type mice were used for AAV8-CamKII-hM4Di-mCherry and AAV8-CamKII-hM3Dq-mCherry injections and purchased from Jackson laboratories (Ben Harbor, ME). At least 3 separate cohorts of male mice were run for all experiments, each including CRE− and CRE+ littermates from heterozygote breedings.
Aggressor mice.
Single-housed CD1 retired breeder mice (Charles River, 3 months of age) were used as aggressors in social defeat experiments.
Procedures were conducted in accordance with the U.S. NIH Guide for the Care and Use of Laboratory Animals and New York State Psychiatric Institute Institutional Animal Care and Use Committee at Columbia University and the Research Foundation for Mental Hygiene.
Viral Constructs.
AAV8-CamKII-GCamp6f was packaged and supplied by the UPenn vector core at a titer of 4.3 × 1033 vg/ml. Virus was diluted to a titer of 1.5 × 10¹³ vg/ml for injections. AAV8-CamKII-hM4Di-mCherry and AAV8-CamKII-hM3Dq-mCherry were purchased from Addgene at a titer of 3–4 × 10¹² vg/ml.
Drugs.
Tamoxifen administration.
8-week-old control, i-hM4Di and iBax mice were administered tamoxifen (Sigma) pretreatment as indicated in the figure timelines. Tamoxifen was dissolved in 100% ethanol, suspended in corn oil and administered daily by intraperitoneal injection at 100 mg/kg for 5 consecutive days.
Clozapine-N-oxide (CNO) administration.
For in vivo silencing of abGCs in i-hM4Di mice, CNO was dissolved in 100% dimethylsulfoxide (DMSO) and diluted with 0.9% saline to a final concentration of 5 μM CNO and 0.001% DMSO. A volume of 400 nl CNO were infused bilaterally into the vDG every day 20 min before each social defeat session. To silence mGCs in the vDG, CNO (5 mg/kg) was injected intraperitoneally (i.p.) every day 30 min before each social defeat session into mice expressing AAV8-CamKII-hM4Di-mCherry. To excite mGCs, CNO (0.1 mg/kg) was i.p. injected every day 30 min before each social defeat session into mice expressing AAV8-CamKII-hM3Dq-mCherry in the vDG (see ‘viral injections’ below).
Chronic Social Defeat stress.
Chronic Social Defeat Stress experiments were performed as previously described.30,31
Aggression Screening:
CD1 retired breeders were screened for aggression prior to the start of the social defeat experiments. During the 3-day screening procedure, a novel C57/Bl6J mouse was introduced into the home cage of the CD1 mouse every day and the latency to attack during a 3-min testing session was recorded. CD1 mice that attacked on at least the two last screening days in less than 60 seconds were used as aggressors.
Subthreshold Social Defeat Stress:
For subthreshold social defeat stress, experimental mice were physically defeated by a new CD1 aggressor mouse for 5 min every day for 5 days. After every daily defeat session, experimental mice were housed across a perforated plexiglass divider in the same cage with the aggressor for 24h to allow continuous visual, olfactory and auditory contact, but no further physical defeat. Control mice were housed 2 per cage across a divider and paired with a novel control mouse every day. After 5 days, all mice were single-housed.
Chronic Social Defeat Stress:
For chronic exposure to social defeat stress, experimental mice were physically defeated as described above but for a total duration of 10 days. All mice were single-housed after the 10th day of defeat.
Behavioral testing.
The Social Interaction Test was conducted 24 hours after the end of the last social defeat exposure on DAY 11 (for chronic defeat), or on DAY 6 (for sub-chronic defeat). The Open Field Test was then conducted on DAY 12 (for chronic defeat) or on DAY 7 (for sub-chronic defeat). All behavioral testing was performed between 10 a.m. and 2 p.m.
Social Interaction test.
During this 2-trial test, experimental mice were first placed into an arena (40cm × 40cm × 40cm) for 150 sec (Trial 1). The arena contained an empty wire mesh enclosure (10cm × 7cm × 7cm) alongside the middle of one of the arena walls. After trial 1, a novel CD1 mouse was placed into the wire-mesh enclosure and the experimental mouse was re-introduced into the arena for another 150 sec (Trial 2). Ethovision XT software (Noldus, Boston, MA) was used to analyze the time that experimental mice spent in a social interaction zone that was defined to be 24cm × 14cm around the wire mesh enclosure with the new CD1 mouse during trial 2. In addition, the time mice spent in the corners (9cm × 9cm) opposite the social interaction zone was also recorded.
Open Field test.
Mice were placed in an open field arena (40cm × 40cm × 40cm, Kinder Scientific, Poway, CA) at 650lux for 10min. Behavior was recorded with MotorMonitor software (Kinder Scientific) and the time mice spent in the center of the open field arena (20cm × 20cm × 20cm), as well as total distance traveled, were analyzed.
Attack behavior.
Aggressive behavior of CD1 mice towards experimental iBax mice during in vivo Ca2+ imaging was manually scored using Observer XT software (Noldus) by an experimenter blind to the experimental condition. ‘Attacks’ were defined as biting the wire mesh enclosure containing the experimental mouse, and paw reaching into the enclosure.
Stereotactic surgeries.
For all surgical procedures, mice were anesthetized with 1.5% isoflurane at an oxygen flow rate of 1 L/min and positioned in a stereotaxic frame (David Kopf, Tujunga, CA) on a T/pump warm water re-circulator (Stryker, Kalamazoo, MI). Eyes were lubricated with opthalamic ointment. Fur was shaved and the incision site sterilized with betadine/ ethanol swabs prior to surgery. Subcutaneous carprofen (5 mg/kg) was provided peri-operatively and for 3 days post-operatively for analgesia.
Bilateral cannula implantations.
Bilateral guide cannulas for intra-hippocampal infusions of CNO were custom-made (Plastics One, Roanoke, VA) to target the ventral dentate gyrus (vDG). The center-to-center spacing of the guide cannulas was 5.6 mm to fit a medial-lateral (ML) distance of 2.8 mm from the midline. Guide cannulas were cut at a length of 2.2 mm. Infusion cannulas were cut to fit the 2.2 mm guide cannulas with a 1mm projection to reach a dorsal-ventral (DV) coordinate of 3.2 mm (from brain). Craniotomies were opened bilaterally with a dental drill at anterior-posterior (AP) −3.6 mm, and medial-lateral (ML) ±2.8 mm from the bregma line and midline, respectively. Cannulas were placed at an AP distance of −3.6 mm from Bregma and slowly lowered into the brain with the infusion cannula attached to reach DV −3.2 mm. Two fully threaded 1/16” microscrews (Antrin Miniature Specialities, Inc) were implanted into the skull anterior to the cannula and the cannula was affixed to the skull and screws using Loctite 454 (Henkel). Infusion cannulas were removed and replaced by dummy cannulas of 2.2 mm length to fit the guide cannula without a projection into the vDG. Dummy cannulas stayed in place to protect guide cannulas from clogging. Mice were allowed to recover from surgery 2 weeks prior to social defeat. Cannula placements into the vDG were confirmed using infusions of Hoechst33342 dye (1 μg/ml).
Viral Injections.
For AAV8-CamKII-hM4Di-mCherry and AAV8-CamKII-hM3Dq-mCherry virus injections into the vDG, 400 nl of virus were bilaterally injected with a 10 μl NanoFil syringe and a 33g beveled needle (World Precision Instruments, Sarasota, FL) at a constant speed of 100 nl/min. Craniotomies were performed as described above, and virus was injected bilaterally at −3.6 mm AP, ±2.8 mm ML, and −3.2 mm DV. After each injection, the needle was left at the injection site inside the brain for an additional 5 min to aid diffusion from the needle tip and to prevent backflow. The needle was then slowly retracted and the scalp incision closed with Vetbond 3M. Each animal was monitored and received carprofen (subcutaneous, 5 mg/kg) for pain management for 3 days after surgery. Mice were housed for 5 weeks postoperatively before the start of social defeat to allow recovery from surgery and sufficient viral expression.
Gradient Refractory Index (GRIN) lens implantations.
For in vivo Ca2+ imaging, mice underwent a single surgery in which 400 nl of AAV8-CamkII-GCamp6f virus were injected unilaterally with a 10 μl NanoFil syringe and a 33g beveled needle (World Precision Instruments, Sarasota, FL) at a constant speed of 100 nl/min prior to implanting a GRIN lens over the injection site. GRIN lenses were 6.1 mm long with a 0.5 mm diameter for vDG imaging (Inscopix, Palo Alto, CA). GRIN lens implantation was performed as previously described27,32. Briefly, a craniotomy centered at the lens implantation site was made and dura was carefully removed from the brain surface and cleaned with a stream of sterile saline and absorptive spears (Fine Science Tools, Foster City, CA). No brain tissue was aspirated prior to lowering the GRIN lens. Three 1/16” microscrews (Antrin Miniature Specialities, Inc) were inserted in evenly spaced locations around the implantation site. The lens was lowered in 0.1 mm DV steps and then fixed to the skull with dental cement (Dentsply, Sinora, PA). Viral injections coordinates were −3.6 mm AP, ±2.8 mm ML, −3.2 mm DV (from brain). Lens placement coordinates were −3.6 mm AP, ±2.8 mm ML, −2.9 mm DV (from brain). At the completion of surgery, the lens was protected with liquid mold rubber (Smooth On, Lower Macungie, PA), and imaging experiments commenced 4 weeks later.
Focal x-ray irradiation of the ventral dentate gyrus.
Irradiation was performed similar to previous reports33. Briefly, 6 week old iBax mice were anesthetized with 6 mg/kg sodium pentobarbital (Nembutal, Oak Pharmaceuticals, IL), placed in a stereotaxic frame and rotated 90° clockwise along the coronal plane. A lead shield containing a 3.5 × 3.5mm2 sliding window was positioned at 1 mm below to 2.5 mm above the interaural line to expose the ventral hippocampus to X-irradiation using an X-RAD 320 X-ray system (PXI; North Branford, CT) operated at 300 kV and 12 mA using a 2-mm Al filter. Three 2.5 Gy doses were delivered with a 2-day inter-dose interval for a total of 7.5 Gy over a 1-week period. Mice were allowed to recover for 1 week after irradiation and were then injected with TMX as described above to induce Cre recombinase-mediated excision of the BAX gene in neural stem cells. Sham animals were anesthetized but not irradiated. Chronic social defeat stress was carried out six weeks after TMX injection. Two successive cohorts were run.
In vivo Ca2+ imaging.
Four weeks after GRIN lens implantations, mice were checked for GCamp expression with a miniaturized microscope (Inscopix, Palo Alto, CA) as previously described27,32. Mice were briefly anesthetized with 1.5% isoflurane at 1 L/min oxygen flow, and head-fixed into a stereotaxic frame. The protective rubber mold was removed from the lens and a magnetic baseplate was attached to the miniature microscope and lowered over the implanted GRIN lens to assess the Field Of View (FOV) for GCamp6f-expressing neurons. If GCamp6f-expressing neurons were visible, the baseplate was affixed in place onto the headcap with dental cement. Ca2+ imaging sessions in freely moving mice were commenced one day after baseplating. For Ca2+ imaging on social defeat Day 1 and Day 10, experimental mice were physically defeated for 5 min by a CD1 aggressor mouse without the miniature microscope attached to the baseplate. After defeat, mice were briefly anesthetized (<5 min) in order to attach the miniature microscope to the baseplate for imaging. Mice were allowed to recover from anesthesia for 30 min and placed in a protective wire-mesh enclosure (13 cm × 7 cm × 9 cm) in the home cage of the aggressor. Mice were adapted to the aggressor cage and the imaging setup for 10 min without the CD1 aggressor present in the cage. The CD1 aggressor was then introduced into the cage for 10min. After 10 days of social defeat, mice were imaged in the Social Interaction test (Day 11) and in the Open Field test (Day 12). Ca2+ videos were recorded with nVista acquisition software (Inscopix, Palo Alto, CA), and triggered with a TTL pulse from EthoVision XT10 and Noldus IO box system to allow for simultaneous acquisition of synchronized Ca2+ and behavioral videos. Ca2+ videos were acquired at 15 frames/ sec with 66.56 ms exposure. An optimal LED power was selected for each mouse based on GCamp6f fluorescence intensity in the FOV (pixel values) to prevent oversaturation of ΔF/F changes in GCamp6f fluorescence. The same LED settings were maintained for each mouse throughout the series of imaging sessions. Two subsequent cohorts were run for Ca2+ imaging experiments, consisting of 6–8 mice per cohort.
Ca2+ image processing.
Image processing was performed using Mosaic software (version 1.2, Inscopix, Palo Alto, CA). Videos were spatially down-sampled by a binning factor of 4 (16x) and lateral brain movement was corrected using the registration engine Turboreg,34,35 which utilizes a single reference frame and high-contrast features in the image to shift frames with motion to matching XY positions throughout the video. Black borders from XY translation after motion correction were cropped and fluorescence changes were detected by generating a ΔF/F0 video using a minimum z-projection image of the entire movie as the reference F0 to normalize fluorescence signals to minimum fluorescence of pixels within the frame. Videos were then temporally down-sampled by a binning factor of 3 (to 5 frames/ sec). Putative single cells and their respective Ca2+ transients were isolated with an automated cell-segmentation algorithm that employs independent and principal component analyses on ΔF/F0 videos36. Identified putative cells were then sorted upon visual inspection to select for units with appropriate spatial configuration and GCamp6f Ca2+ dynamics consistent with signals from individual neurons. Ca2+ transient events were then defined by a Ca2+ event detection algorithm that identifies large amplitude peaks with fast rise times and exponential decays (parameters: tau= 200 ms, Ca2+ transient event minimum size = 6 median average deviation).
Ca2+ data analysis.
Ca2+ transient event rates and mouse behavior were analyzed with custom functions in MATLAB (Mathworks, Natick, MA). To calculate the rate of Ca2+ transients per neuron while mice were being attacked by CD1 aggressors, ‘attack’ vs. ‘no-attack’ periods were manually scored using Observer XT software as described above. Ca2+ transient event rates were calculated as the total number of Ca2+ events during the attack epochs, divided by the total lengths of all attack epochs per recording session. The bin sizes therefore depend on the total time the aggressive mouse was attacking the experimental mouse, which ranged from 62 – 150 sec for ‘attack’ epochs. Consequently, ‘no-attack’ epochs ranged from 450 – 538 sec (i.e., 600 sec - ‘attack epochs’). Occupancy in different arena zones in the Social Interaction test (SI zone vs. corner zones), or in the Open Field test was defined using EthoVision XT software. Ca2+ transient rates were calculated as the total number of Ca2+ events during exploration of the SI zone, corner zone, and open field, and divided by the total lengths of the respective epochs per recording session. All behavioral data were exported as a logical output at 30 frames/sec. Behavior was down-sampled to 5 frames/sec to match Ca2+ transient data sampling. Logical indexing was used to calculate Ca2+ transient rates in different behavioral conditions (i.e., ‘attack’ vs. ‘no attack’, SI zone vs. corner zones). Ca2+ transient rates for distances away from the center in the open field arena were calculated as the mean firing rate per position for each individual time frame. The area under significant Ca2+ transients (AUC) was obtained from a subset of cells by applying a moving average smoothing filter to calculate the baseline Ca2+ activity during each 10min defeat recording session. The area between the Ca2+ activity trace and the smoothed baseline was then calculated from the beginning to the end of each significant Ca2+ transient. AUC rates were calculated by summing AUC values from all significant events within a specific behavioral epoch (i.e., ‘attack’ or ‘no-attack’) and by dividing these summed AUC values by the total time of the respective behavioral epoch (i.e., by the total lengths of all ‘attack’ or ‘no-attack’ periods). Amplitude rates were calculated by dividing the total summed amplitude of all significant Ca2+ transient events per cell within each behavioral epoch by the total length of the behavioral epoch.
Cell Selectivity Analysis.
For defining cell selectivity, Ca2+ events were shuffled in time for individual cells (1000 iterations). Shuffled rates were re-calculated with logical behavioral indexing to generate null-distributions of condition or zone Ca2+ transient event rates for each cell. A cell was considered selective for a condition or zone if its Ca2+ transient event rate difference between conditions or zones exceeded a 1.5 standard deviation threshold from the null distribution (during defeat: ‘attack’ vs. ‘no attack’; SI test: SI zone vs. corner zones vs. not in any zone; Open Field: center vs. periphery). Cells with Ca2+ transient event rate ratios at the boundary between the tentative non-selective area and the tentative zone-selective area were fitted using a linear regression to produce a population threshold line. The smallest shift of the coefficients in the linear population threshold line that resulted in grouping ‘non-selective cells’ with no aggregate zone preference was chosen. For cell selectivity analysis in the social interaction test, if a mouse did not enter either the SI zone or the corner zone then it was excluded from the selectivity analysis because one could not determine whether a cell was exclusively selective for either zone.
In vitro electrophysiology.
One hour after the last social defeat session, mice were anesthetized by isoflurane inhalation, decapitated, and brains rapidly removed. DG coronal slices (350μm) were cut on a vibratome (Leica VT1000S) in ice cold partial sucrose artificial cerebrospinal fluid (ACSF) solution (in mM): 80 NaCl, 3.5 KCl, 4.5 MgSO4, 0.5 CaCl2, 1.25 H2PO4, 25 NaHCO3, 10 glucose, and 90 sucrose equilibrated with 95% O2 / 5% CO2 and stored in the same solution at 37°C for 30 minutes, then at room temperature until use. Recordings were made at 30–32°C (TC324-B; Warner Instrument Corp) in ACSF (in mM: 124 NaCl, 2.5 KCl, 1 NaH2PO4, 25 NaHCO3, 20 glucose, 1 MgCl2, 2 CaCl2). Whole-cell recordings (−70 mV) were obtained using a patch pipette (4.5–6.5 M) containing (in mM): 135 KMethylSulfate, 5 KCl, 0.1 EGTA-Na, 10 HEPES, 2 NaCl, 5 ATP, 0.4 GTP, 10 phosphocreatine, 0.2% biocytin (pH 7.2; 280–290 mOsm). Patch pipettes were made from borosciliate glass (A-M Systems) using a micropipette puller (Model P-1000; Sutter Instruments). Recordings were made without correction for junction potentials. Granule cells were visualized and targeted via infrared-differential interference contrast (IR-DIC; 40x objective) optics on an Axioskop-2 FS (Zeiss). Adult-born and mature granule cells were differentiated based on somatic location, input resistance, and spike patterns37,38. Post-hoc analysis of biocytin fills was used to confirm cell identity (see below). For experiments requiring perforant path stimulation, a concentric bipolar stimulating electrode (FHC) controlled by a stimulus isolator (ISO-flex, AMPI Instruments) was positioned on the DG molecular layer (triggered at 0.03 Hz). Perforant path inputs were stimulated at 40 Hz (20 pulses every 25 ms). Current and voltage signals were recorded with a MultiClamp 700B amplifier (Molecular Devices, USA), digitized at 5–10 kHz, and filtered at 2.5–4 kHz. Data were acquired and analyzed using Axograph (Axograph Scientific, Sydney, Australia). Evoked synaptic responses were quantified by calculating the area under the curve (AUC =cumulative area above (+) and below (−) baseline in mV•s).
Immunohistochemistry.
Perfusions and sectioning.
One hour after the last social defeat session, mice were anesthetized with ketamine/ xylazine (100 mg/ml ketamine, 20 mg/ml xylazine) and transcardially perfused with 30 ml cold saline, followed by 30 ml ice-cold paraformaldehyde (PFA; wt/vol) in saline. Brains were dissected and post-fixed overnight in 4% PFA at 4°C. Brains were then cryoprotected in 30% sucrose (wt/vol) with 0.02% NaN3 (wt/vol) for two days at 4°C and subsequently frozen in optimum cutting temperature (OCT) compound (Tissue Tek, Torrance, CA) and stored at −80°C until cryostat sectioning. Serial sections (35 μM) were cut through the entire hippocampus on a cryostat (Leica CM3050S) and stored in phosphate-buffered saline (PBS) with 0.02% NaN3 until further processing by immunohistochemistry.
Immunohistochemistry.
Sections were washed three times for 10 min in PBS and 0.3% Triton X-100 (PBST), treated with 1% H2O2 (wt/vol) in 1:1 PBS and methanol for 15 min to quench endogenous peroxidase activity, incubated in 10% normal donkey serum (NDS; wt/vol) in PBST for 2 hrs, and then incubated overnight at 4°C in primary antibody in PBST + 10% NDS (goat anti-Dcx, C-18, 1:500; rabbit anti-c-fos, sc-52, 1:500, both from Santa Cruz Biotechnology; rabbit anti-mCherry, 1:500, ab167453; chicken anti-eYFP, 1:500, ab13970, both from Abcam; Cy2 streptavidin, 1:500, 016–160-084, Jackson to label biocytin-filled cells). The next day, sections were washed three times for 10 min in PBST and incubated in secondary antibody (Cy3 donkey anti-goat, 1:500, 705–165-147; Cy2 donkey anti-rabbit, 1:500, 711–225-152; Cy3 donkey anti-rabbit, 1:500, 711–165-152; biotinylated donkey anti-chicken, 1:250, 703–065-155; all from Jackson ImmunoResearch) in PBST + 10% NDS for 2 h at 21–26°C. For eYFP stainings, sections were washed three times for 10 min in PBST and incubated in tertiary antibody (Cy2 streptavidin, 1:500, 016–220-084, Jackson) in PBST + 10% NDS for 2 hrs at 21–26°C. All sections were then washed three times for 10 min in PBST, incubated in Hoechst33342 dye (1:10,000) in PBS for 5 min, and washed again three times for 10 min in PBS. Sections were then mounted onto glass slides and coverslipped with Aqua Poly/Mount (PolySciences) for microscopic analysis.
BrdU administration and immunohistochemistry.
iBax mice were administered BrdU (150 mg/kg, intraperitoneal, dissolved in saline) on two consecutive days 48 h after the last tamoxifen injection. BrdU-injected mice underwent chronic social defeat stress (10 days) and were perfused following the last social defeat session on day 10. For BrdU immunohistochemistry, sections were washed three times for 10 min in TBS and then exposed to citrate buffer (10 mM citric acid, pH 6.0 at 95°C) for 2 h. After three 10 min washes in TBS, sections were incubated for 2 hrs in 10% normal donkey serum and then incubated overnight at 4°C with primary antibody in TBS (anti-BrdU rat monoclonal, BU1/75 (ICR1), Serotec, 1:100). The next day, sections were washed three times for 10 min with TBS and incubated for 2 hrs with secondary antibody (Cy3-conjugated goat anti-rat, A10522, Molecular Probes, 1:500) before processing for microscopy as described above.
Cell counting.
Immunoreactive cells (cfos, Dcx, BrdU) were counted by an experimenter blind to the experimental conditions on a Zeiss Axioplan-2 upright microscope. For each mouse, both hemispheres were counted on every sixth section along the longitudinal axis of the hippocampus (12 sections in total). Cell counts were averaged across both hemispheres for each section. To assess lateral septum activation, c-fos was counted in both hemispheres at bregma level 0.14mm.
Confocal Microscopy.
To identify co-localization of mCherry/biocytin, z-stacks of immunolabeled sections were obtained using a confocal scanning microscope (Leica TCS SP8, Leica Microsystems Inc.) equipped with three simultaneous PMT detectors. Fluorescence from Cy2 was excited at 488 nm and detected at 505–550 nm, and fluorescence from Cy3 was excited at 552 nm and detected at 600–650 nm. For 488- and 552-nm excitation, the beam path included a TD 488/552/638 beamsplitter. All z-stacks were imaged with a dry Leica 20X objective (NA 0.70, working distance 0.5 mm), with a FOV of 553.6 μm × 553.6 μm, a pixel size of 0.54 × 0.54 μm, optical sectioning of 2.36 μm, a z step of 3 μm, and a total z-thickness of 60–80 μm. Acquisition parameters included a speed of 400Hz, pixel dwell time of 600 ns, and no line or frame averaging, resulting in a frame rate of 0.15 f/s. Z-stacks of the area of interest were obtained using LAS X software (Leica Application Suite X 3.1.1.15751).
Statistics.
Behavioral data, Dcx expression, BrdU labeling, and EPSP charges were analyzed using Two-Way ANOVA to assess genotype (CRE− vs. CRE+) and stress effects (control vs. defeated), or to assess treatment (vehicle vs. CNO) and stress effects (control vs. defeated), or to assess irradiation (sham vs. X-ray) and genotype (CRE− vs. CRE+) effects. Fisher’s LSD post hoc test was used to compare individual groups when significant interactions were found. Planned comparison t-tests were used where appropriate when main effects were significant without significant interactions. Repeated-measures Two-Way ANOVA was used to assess c-fos expression. Paired two-tailed student’s t-tests were used to compare changes in EPSP charge in CRE− and CRE+ i-hM4Di mice, and changes in membrane potential AAV8-CamKII-hM4Di and AAV8-CamkII-hM3Dq infected cells (all before and after bath application of CNO). Paired one-tailed student’s t-tests were used to compare changes in spiking, input resistance, and membrane potential of abGCs upon bath application of CNO. Unpaired two-tailed student’s t-test was used to assess differences in attack duration and number of attacks per mouse. Unpaired two-tailed student’s t-test was also used to compare behavioral data of CRE− mice and CRE+ iBax mice after social defeat in in vivo imaging experiments. Ca2+ transient rate data was analyzed using Mann Whitney t-test (unpaired comparison) and Wilcoxon matched pairs signed rank test (paired comparison). Chi-squared test of proportions was used to assess changes in cell selectivity from Day 1 to Day 10 of defeat. Kruskal-Wallis One-Way ANOVA with Dunn’s post hoc test was used to assess Ca2+ transient rate changes for 5 cm distance bins away from the center point of the open field. The two-sample Kolmogorov-Smirnoff test was used to assess differences in cumulative frequency distributions of Ca2+ data between CRE− and CRE+ iBax mice.
Data was confirmed to be normally distributed using the Shapiro-Wilk test except where noted. Ca2+ transient rate data was not normally distributed. All statistical analyses were carried out using GraphPad Prism Software (version 6.0). Data was considered significant if p<0.05, except when multiple comparisons were performed on non-parametric data in which case α was set to 0.05/n where n was the number of hypotheses tested.
Data Availability Statement
The source data supporting the findings of this study are included in this manuscript. Additional source data will be available from the corresponding authors (C.A. and R.H.) upon reasonable request.
Code Availability Statement
Custom MATLAB scripts are available from the corresponding authors (C.A. and R.H.) upon reasonable request.
Extended Data
Extended Data Fig. 1 |. Silencing adult-born neurons in i-hM4Di mice.
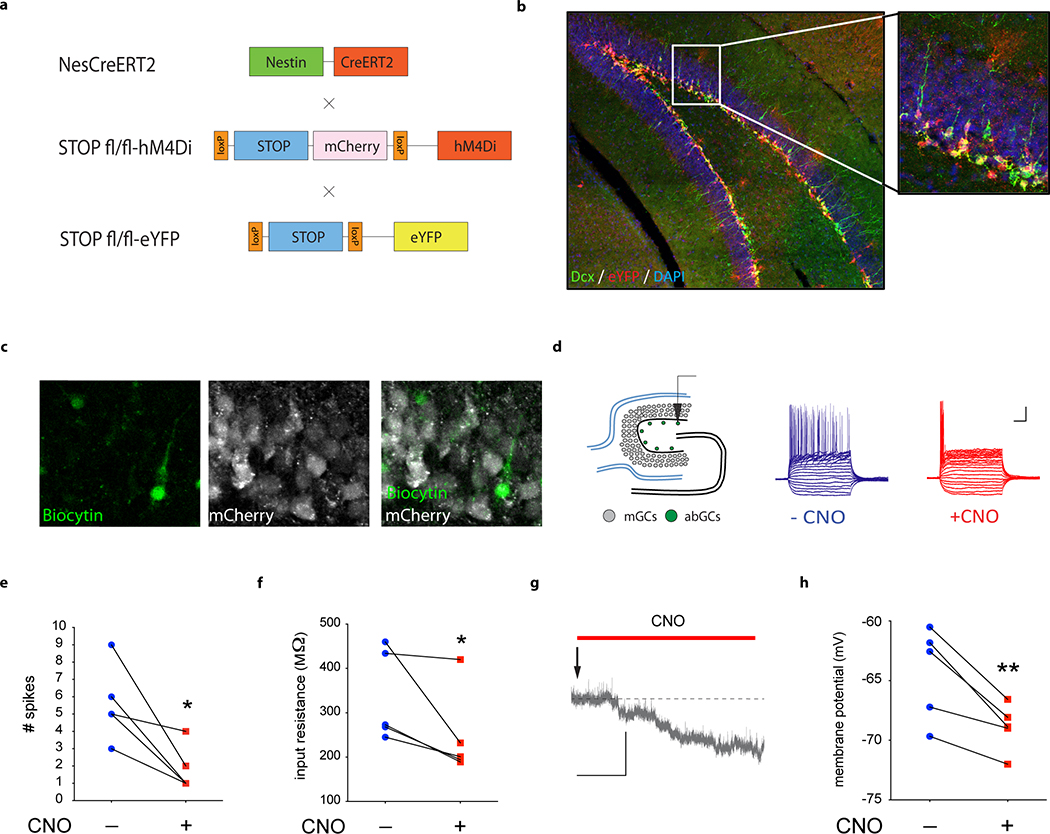
a, Mice expressing a tamoxifen (TMX)-inducible CreERT2 recombinase expressed under the control of the Nestin gene promoter17 were crossed to mice expressing STOP-floxed hM4Di under the control of the CAG promoter18. The eYFP reporter gene was used to visualize recombination by crossing Nestin-CreERT2 +/−; stop-mCherry -hM4Di fl/fl mice to stop-eYFP fl/fl mice (Nestin-CreER T2 +/−; stop-mCherry -hM4Di fl/− ; stop-eYFP fl/−). b, Cre-mediated recombination in Dcx-positive adult-born neurons was visualized using eYFP/ Dcx co-labelling. c, Biocytin was injected into adult-born granule cells (abGCs) during in vitro whole-cell recordings. Expression of hM4Di in recorded abGCs was confirmed by biocytin+/mCherry-immunofluorescence. d, Schematic illustrating 500 ms current-step injections into abGCs. Representative recordings from abGCs before and after bath application of CNO (5 μM) are shown. mGCs, mature granule cells; Scale bar: 20 mV, 100 ms e, Bath application of CNO decreases spiking of hM4Di-expressing abGCs (paired, two-tailed t-test, *P=0.024, N=5). f, CNO decreases input resistance of abGCs (paired, one-tailed t-test, *P=0.037, N=5). g, Representative resting membrane potential trace of abGCs upon bath application of CNO. h, CNO decreases resting membrane potential of abGCs (paired, one-tailed t-test, **P=0.006, N=5); Scale bar: 5 mV, 1 min. Error bars, ± s.e.m.
Extended Data Fig. 2 |. i-hM4Di mice and iBax mice behavior: time in corner of the social interaction test and time in center of the open field.
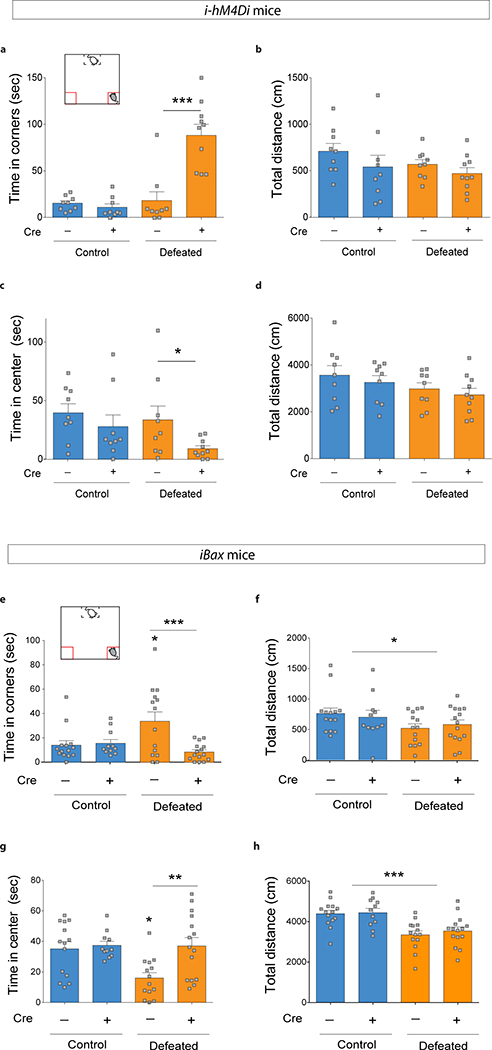
a-d, i-hM4Di mice. a, Silencing abGCs in CRE+ i-hM4Di mice increased the time spent in the corner of the social interaction test after subthreshold defeat (Interaction F1,33=23.0, ***P<0.0001, genotype effect F1,33=17.96, ***P=0.0002, stress effect F1,33=26.7, ***P<0.0001, post hoc test, ***P<0.0001). b, No difference in total distance travelled in the social interaction test (Interaction F1,33=0.17, P=0.68; genotype effect F1,33=2.5, P=0.12; stress effect F1,33=1.6, P=0.22) c, Time spent in the center of the open field after subthreshold defeat (Interaction F1,33=0.57, P=0.46, genotype effect F1,33=4.63, *P=0.04, stress effect F1,33=2.14, P=0.15; planned comparison t-test: CRE− defeat vs. CRE+ defeat, *P=0.045). d, No difference in total distance travelled in the open field (Interaction F1,33=0.007, P=0.93; genotype effect F1,33=0.79, P=0.38; stress effect F1,33=3.22, P=0.08). N=9, 9, 9, 10. e-h, iBax mice. e, Chronic defeat (10 days) increased the time CRE− mice spent in the corner during the social interaction test. This effect was absent in CRE+ iBax mice (Interaction F1,50=7.9, **P=0.007; genotype effect F1,50=6.3, *P=0.016; stress effect F1,50=1.7, P=0.19; post-hoc test, ***P=0.0003). f, Chronic defeat decreased the total distance travelled in the social interaction test without genotype effects (Interaction F1,50=0.5, P=0.48; genotype effect F1,50=0.00001, P=0.99; stress effect F1,50=4.4, *P=0.04) g, Chronic defeat decreased the time CRE− mice spent in the center of the open field. This effect was absent in CRE+ iBax mice (Interaction F1,50=4.5, *P=0.039; genotype effect, F1,50=6.9, *P=0.01; stress effect, F1,50=4.8, *P=0.03; post-hoc test, **P=0.001). h, Chronic defeat decreased the total distance travelled in the open field without genotype effects (Interaction F1,50=0.12, P=0.73; genotype effect, F1,50=0.39, P=0.54; stress effect F1,50=25.2, ***P<0.0001). N=14, 11, 14, 15. Error bars, ± s.e.m.
Extended Data Fig. 3 |. iBax mice show higher levels of adult-born cell survival and ventral X-ray irradiation abolishes stress resilience.
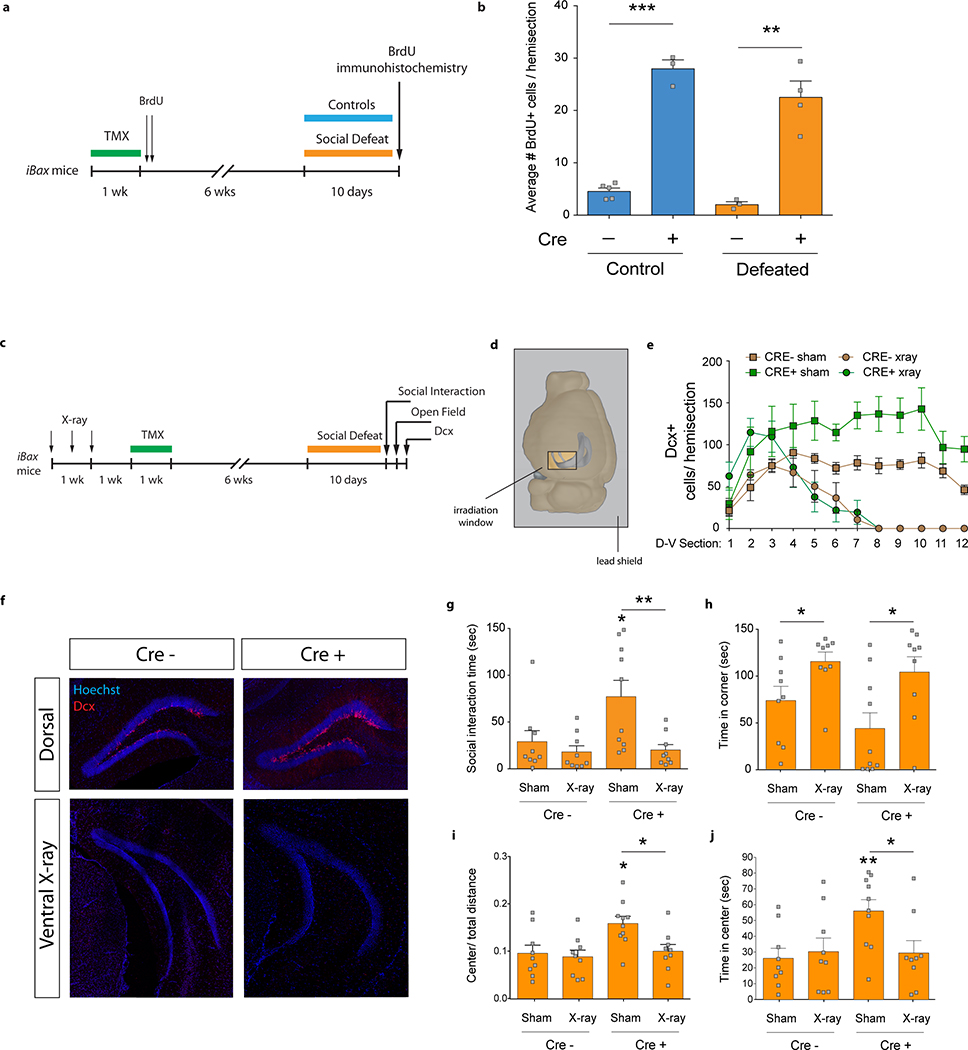
a, Experimental timeline for cell survival assessment using BrdU incorporation. b, The number of cells that have incorporated BrdU at 8 weeks after BrdU injection is increased in undefeated mice and in defeated CRE+ iBax mice compared to CRE− control mice (Interaction F1,11=0.69, P=0.43; genotype effect F1,11=138.9, ***P<0.0001; stress effect F1,11=4.8, P=0.05; planned comparison t-test, control CRE− vs. CRE+, ***P<0.001; defeat CRE− vs. CRE+, **P=0.002; N=5, 3, 3, 4). c, Experimental timeline for X-ray irradiation. d, Schematic indicating sliding window position of a protective lead shield during X-ray irradiation of the vDG. e, Ventral X-ray irradiation eliminated Dcx+ cells in the vDG in CRE− and CRE+ mice. D-V, dorsal-ventral axis. NCRE− sham=5, NCRE+ sham=4, NCRE− xray=5, NCRE+ xray=5. f, Representative images of Dcx expression in the dorsal DG and the ventral DG in X-ray irradiated mice. g, CRE+ iBax mice showed longer social interaction times than CRE− mice after chronic defeat. This effect was abolished by ventral X-ray irradiation (Interaction F1,33=3.8, P=0.06; genotype effect F1,33=4.5, *P=0.04; X-ray effect, F1,33=8.4, **P=0.007; planned comparison t-test, CRE− sham vs. CRE+ sham, *P=0.04; CRE+ sham vs. CRE+ X-ray, **P=0.008; N=9, 9, 10, 9). h, Ventral X-ray irradiation increased time spent in the corner in both genotypes (Interaction F1,33=0.38, P=0.54; genotype effect, F1,33=1.8, P=0.18; X-ray effect, F1,33=11.6, **P=0.0018; planned comparison t-test, CRE− sham vs. CRE− x-ray, *P=0.04; CRE+ sham vs. CRE+ x-ray, *P=0.02; N=9, 9, 10, 9). i, CRE+ iBax mice show increased center/ total distance in the open field than CRE− mice. Ventral X-ray irradiation abolished this effect (Interaction F1,33=2.9, P=0.1; genotype effect, F1,33=6.1, *P=0.019; X-ray effect, F1,33=4.8, *P=0.036; planned comparison t-test, CRE− sham vs. CRE+ sham, *P=0.01; CRE+ sham vs. CRE+ X-ray, *P=0.01; N=9, 9, 10, 9). j, CRE+ iBax mice show increased time spent in the center of the open field than CRE− mice. Ventral X-ray irradiation abolished this effect (Interaction F1,33=4.2, *P=0.049; genotype effect F1,33=3.7, P=0.06; X-ray effect, F1,33=2.2, P=0.15; post-hoc test, CRE− sham vs. CRE+ sham, **P=0.008; CRE+ sham vs. CRE+ X-ray, *P=0.02; N=9, 9, 10, 9). Error bars, ± s.e.m.
Extended Data Fig. 4 |. iBax mice: Number of attacks and lengths of attacks during social defeat, and behavior after 10 days of chronic social defeat for all imaged mice.
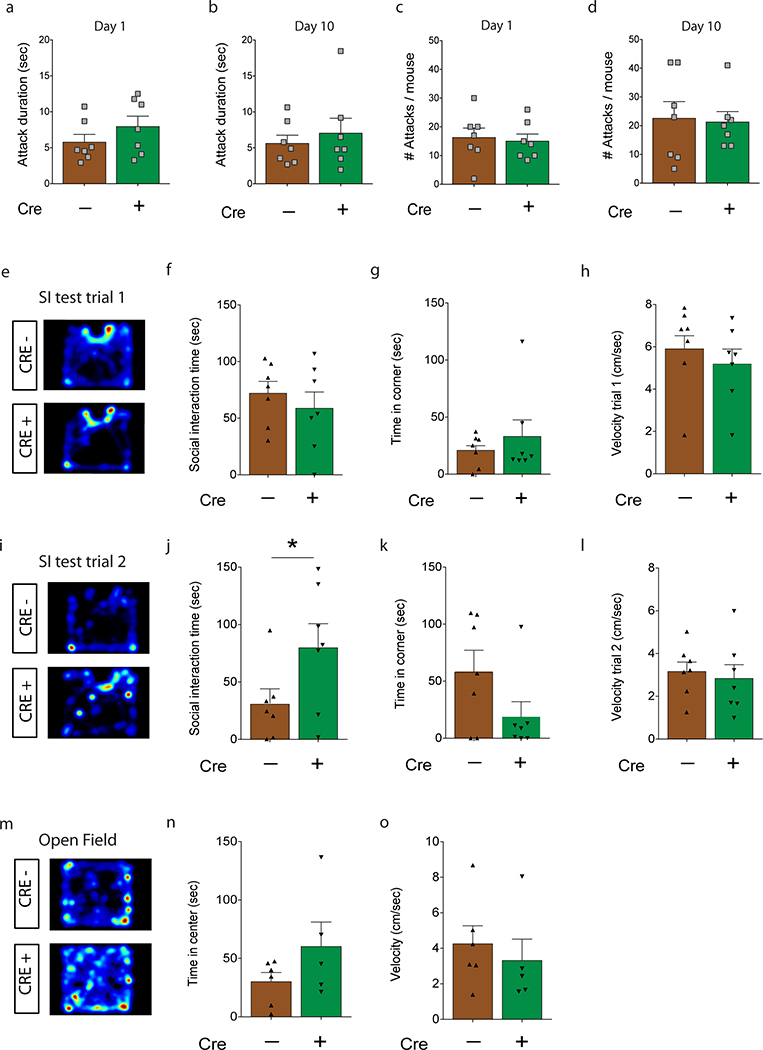
a, No difference in average duration of attacks on the first day of social defat (unpaired, two-tailed t-test, P=0.25; N=7, 7), or b, on the last day of social defat (P=0.56; N=7, 7). c, No difference in the average number of attacks on the first day of social defat (P=0.76; N=7, 7), or d, on the last day of social defat (P=0.85; N=7, 7). e, Representative heatmap of time spent in the social interaction test during the 1st trial (without CD1 mouse). f, No differences in time in the interaction zone during the 1st trial (unpaired, two-tailed t-test, P=0.47; N=7,7). g, No differences in time in the corner zone during the 1st trial (P=0.46; N=7,7). h, No differences in velocity during the 1st trial (P=0.43; N=7,7). i, Representative heatmap of time spent in the social interaction test during the 2nd trial (with CD1). j, CRE+ iBax mice spent longer in the interaction zone during the 2nd trial than CRE− mice (*P=0.049; N=7,7). k, CRE+ iBax mice spent less time in the corner zone during the 2nd trial than CRE− mice (P=0.1; N=7,7). l, No differences in velocity during the 2nd trial (P=0.65; N=7,7). m, Representative heatmap of time spent in the open field test. n, Time spent in the center of the open field (P=0.18; NCRE−=6, NCRE+=5). o, No differences in velocity in the open field (P=0.56; NCRE−=6, NCRE+=5). Error bars, ± s.e.m.
Extended Data Fig. 5 |. Ca2+ transient rates of non-selective cells, area under the curve (AUC) rates, and amplitude rates of significant Ca2+ transients on social defeat Day 1 and Day 10.
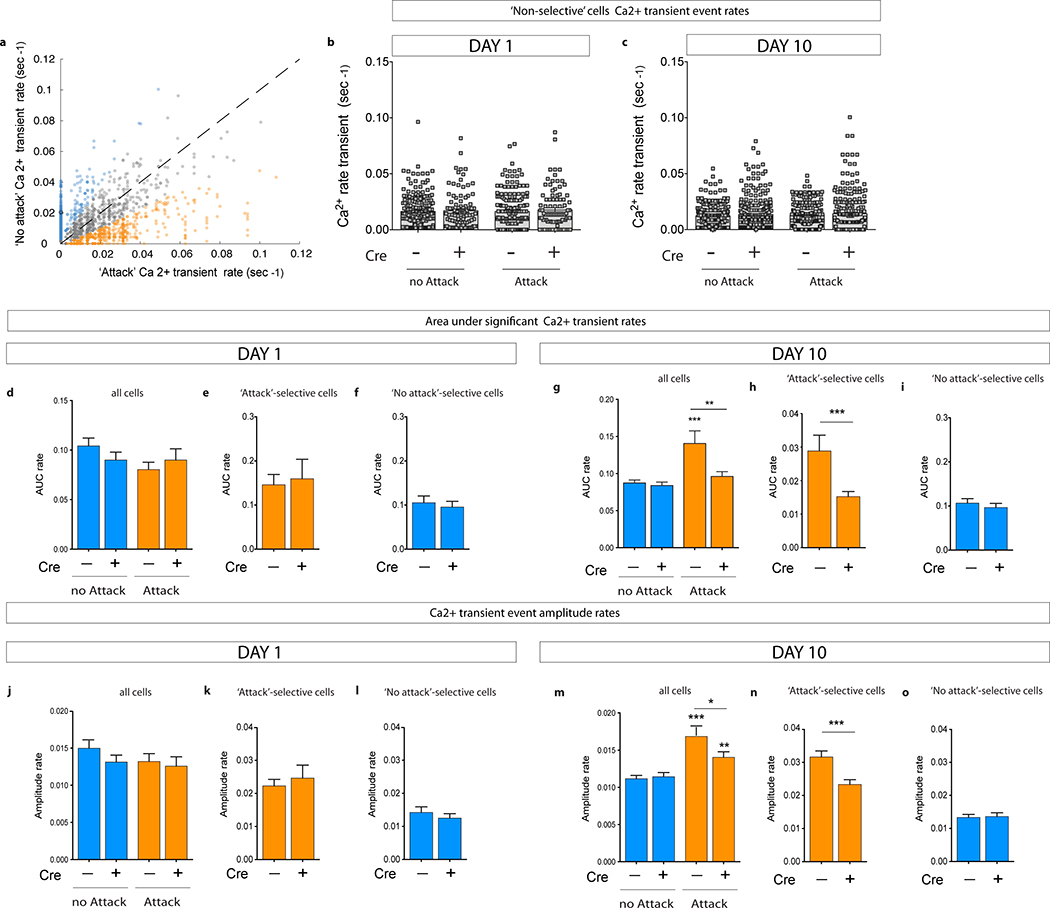
a, Scatter plot showing individual neurons’ Ca2+ transient rates during ‘attack’ vs. ‘no-attack’ periods. Colors based on selectivity for ‘attacks’ (orange), ‘no attack’ (blue), and non-selectivity (grey) determined by exceeding shuffle distribution. For presentation purposes, the scatter plot shows rates up to 0.12 events/sec. Ten cells showed rates >0.12 events/sec and were included in the cell selectivity analysis (see source data). b, No differences in Ca2+ transient rates of non-selective cells on Day 1 or c, on Day 10. d-i, Area Under the Curve (AUC) rate analysis of significant Ca2+ transients. d, No differences in AUC rates between CRE− mice and CRE+ iBax mice on Day 1 (‘no-attack’: Mann Whitney U=38448, P=0.37; ‘attack’: U=40070, P=0.94; NCRE−=327, NCRE+=246). e, No difference in AUC rates of ‘attack’ selective cells on Day 1 (U=1093, P=0.46; NCRE−=57, NCRE+=42). f, No difference in AUC rates of ‘no-attack’ selective cells on Day 1 (U=6065, P=0.76; NCRE−=115, NCRE+=108). g, AUC rates are increased only in CRE− mice during attack periods on Day 10 (Wilcoxon matched-pairs signed rank, ***PCRE−=0.0006; NCRE−=620; PCRE+=0.44; NCRE+=592). CRE+ iBax mice show lower attack responses than CRE− mice (U=165092, **P=0.002). h, AUC rates of ‘attack’ selective cells are lower in CRE+ iBax mice than in CRE− mice on Day 10 (U=12162, ***P<0.0001; NCRE−=211, NCRE+=169). i, No difference in AUC rates of ‘no-attack’ selective cells on Day 10 (U=11127, P=0.37; NCRE−=169, NCRE+=140). j-o, Amplitude rate analysis of significant Ca2+ transients. j, No differences in amplitude rates between CRE− mice and CRE+ iBax mice on Day 1 (‘no-attack’: Mann Whitney U=38693, P=0.44; ‘attack’: U=38741, P=0.43; NCRE−=327, NCRE+=246). k, No difference in amplitude rates of ‘attack’ selective cells on Day 1 (U=1132, P=0.65; NCRE−=57, NCRE+=42). l, No difference in amplitude rates of ‘no-attack’ selective cells on Day 1 (U=5767, P=0.36; NCRE−=115, NCRE+=108). m, Amplitude rates are increased during attack periods on Day 10 (Wilcoxon matched-pairs signed rank, ***PCRE−<0.0001; NCRE−=620; **PCRE+=0.0019; NCRE+=592). CRE+ iBax mice show lower attack responses than CRE− mice (U=170024, *P=0.0246). n, Amplitude rates of ‘attack’ selective cells are lower in CRE+ iBax mice than in CRE− mice on Day 10 (U=12936, ***P<0.0001; NCRE−=211, NCRE+=169). o, No difference in amplitude rates of ‘no-attack’ selective cells on Day 10 (U=11518, P=0.69; NCRE−=169, NCRE+=140). Error bars, ± s.e.m.
Extended Data Fig. 6 |. Cumulative frequency distribution plots of Ca2+ transients.
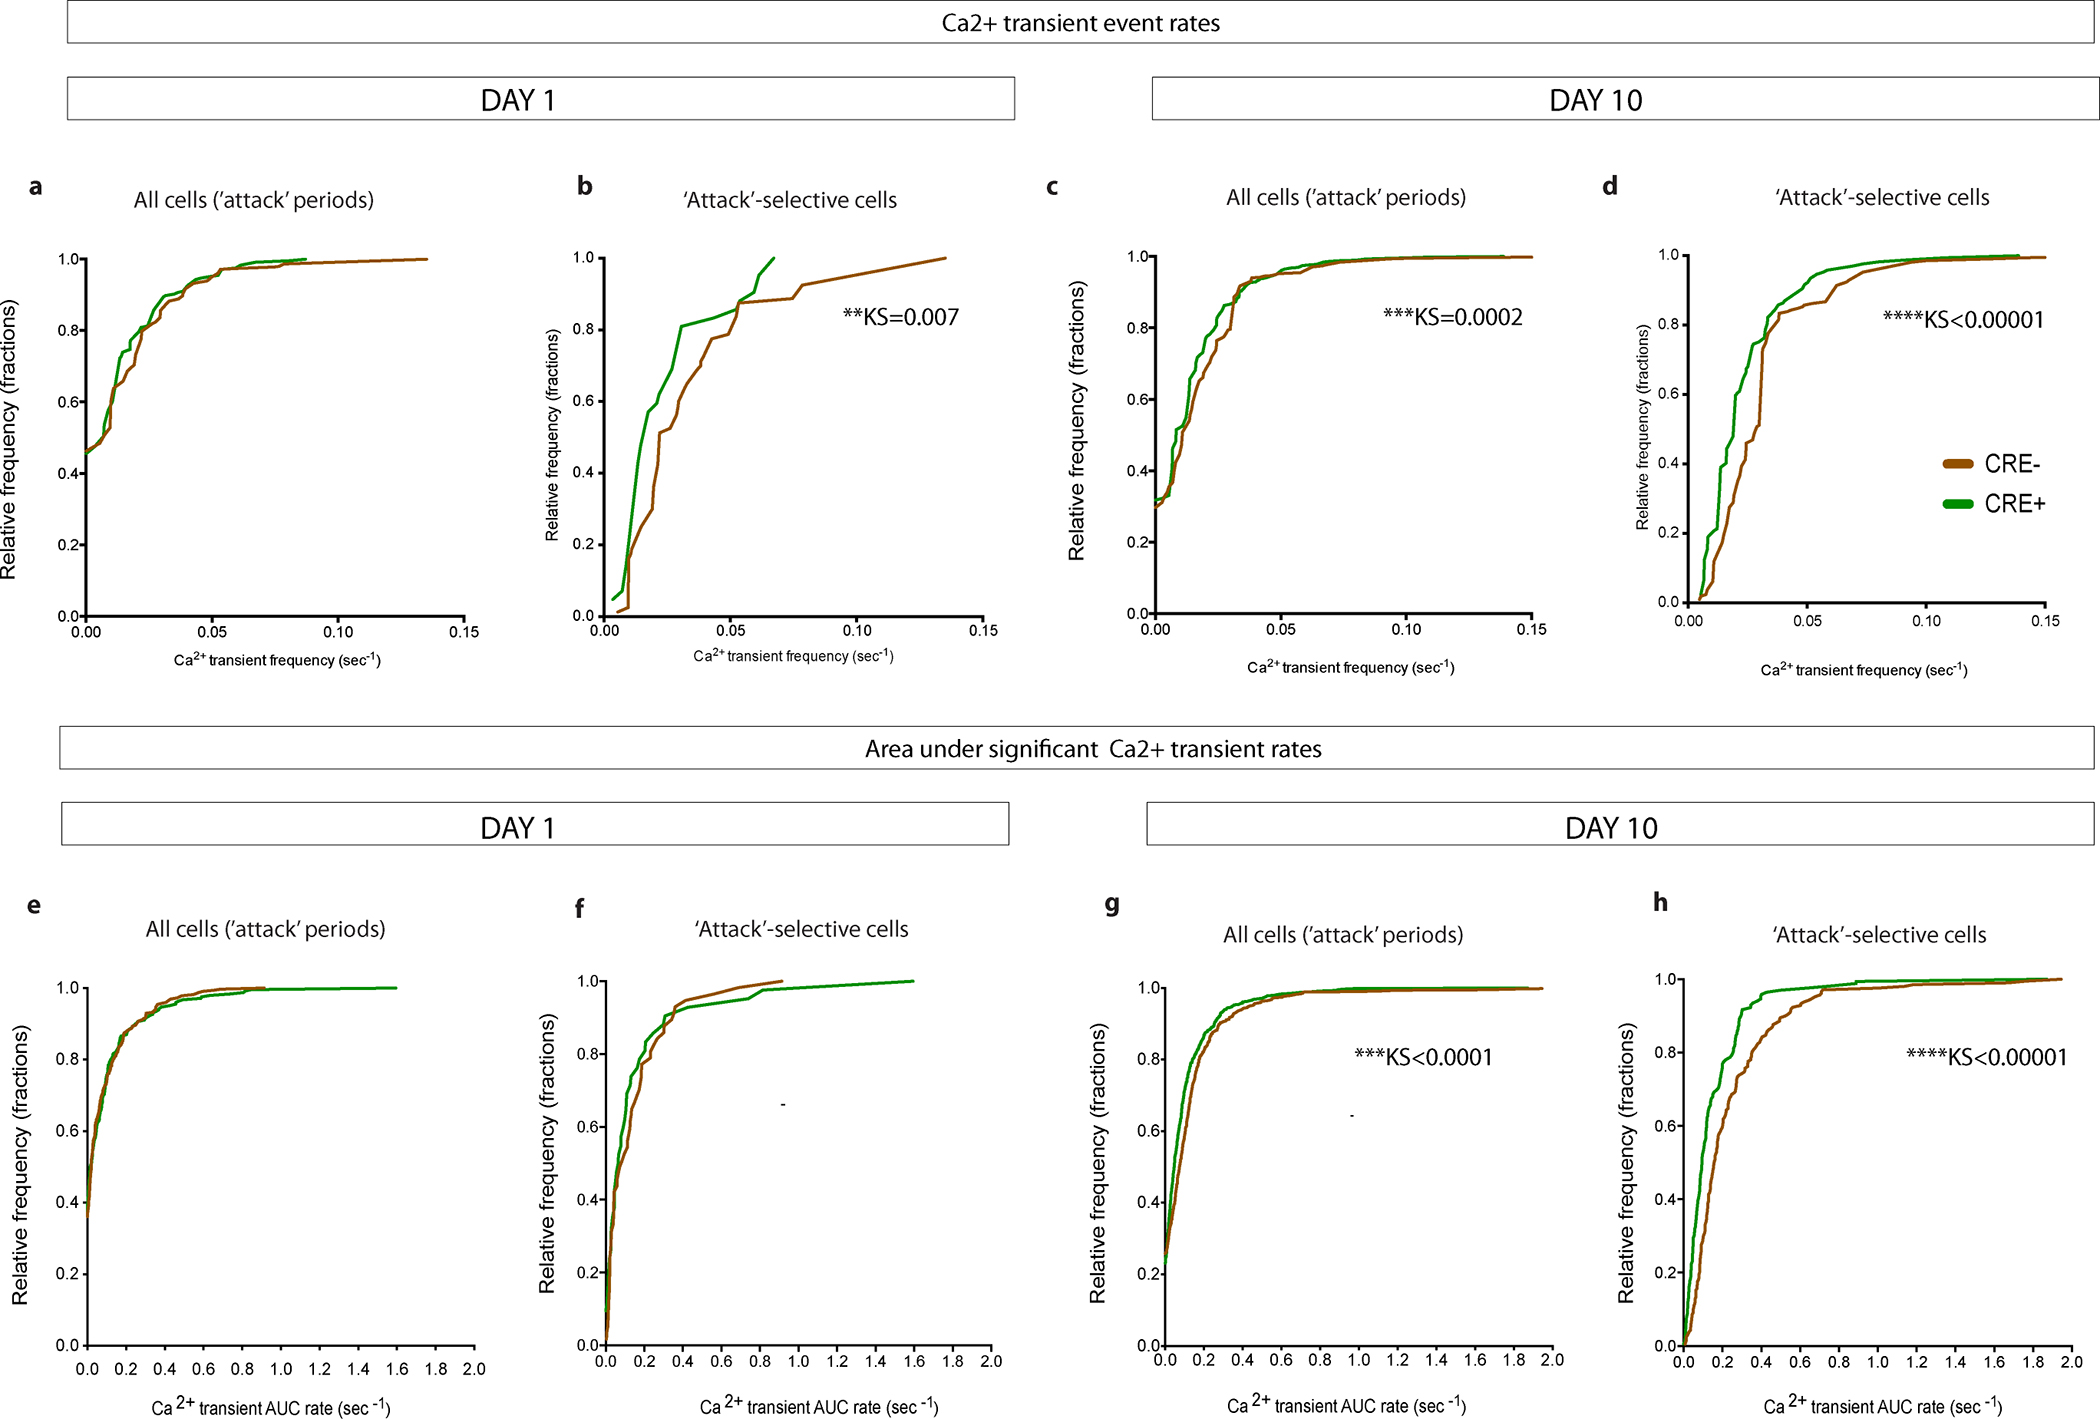
a, No differences in the distributions of Ca2+ transient event rates were observed between CRE− mice and CRE+ iBax mice during ‘attack’ periods on Day 1. NCRE−=460, NCRE+=246. b, Distributions of Ca2+ transient event rates of ‘attack’-selective cells are different between CRE− mice and CRE+ iBax mice on Day 1. NCRE−=80, NCRE+=42. c, Distributions of Ca2+ transient event rates are significantly different between CRE− mice and CRE+ iBax mice during ‘attack’ periods on Day 10. NCRE−=620, NCRE+=592. d, Distributions of Ca2+ transient event rates of ‘attack’-selective cells are significantly different between CRE− mice and CRE+ iBax mice on Day 10. NCRE−=211, NCRE+=169. e, No differences in the distributions of Ca2+ transient AUC rates were observed between CRE− mice and CRE+ iBax mice during ‘attack’ periods on Day 1. NCRE−=327, NCRE+=246. f, No differences in the distributions Ca2+ transient AUC rates of ‘attack’-selective cells were observed between CRE− mice and CRE+ iBax mice on Day 1. NCRE−=57, NCRE+=42. g, Distributions of Ca2+ transient AUC rates are significantly different between CRE− mice and CRE+ iBax mice during ‘attack’ periods on Day 10. NCRE−=620, NCRE+=592. h, Distributions of Ca2+ transient AUC rates of ‘attack’-selective cells are significantly different between CRE− mice and CRE+ iBax mice on Day 10. NCRE−=211, NCRE+=169. KS; Kolmogorov-Smirnov test P-value (shown for significant differences only).
Extended Data Fig. 7 |. iBax mice: decreased vDG activity during stress-induced social avoidance in the social interaction test.
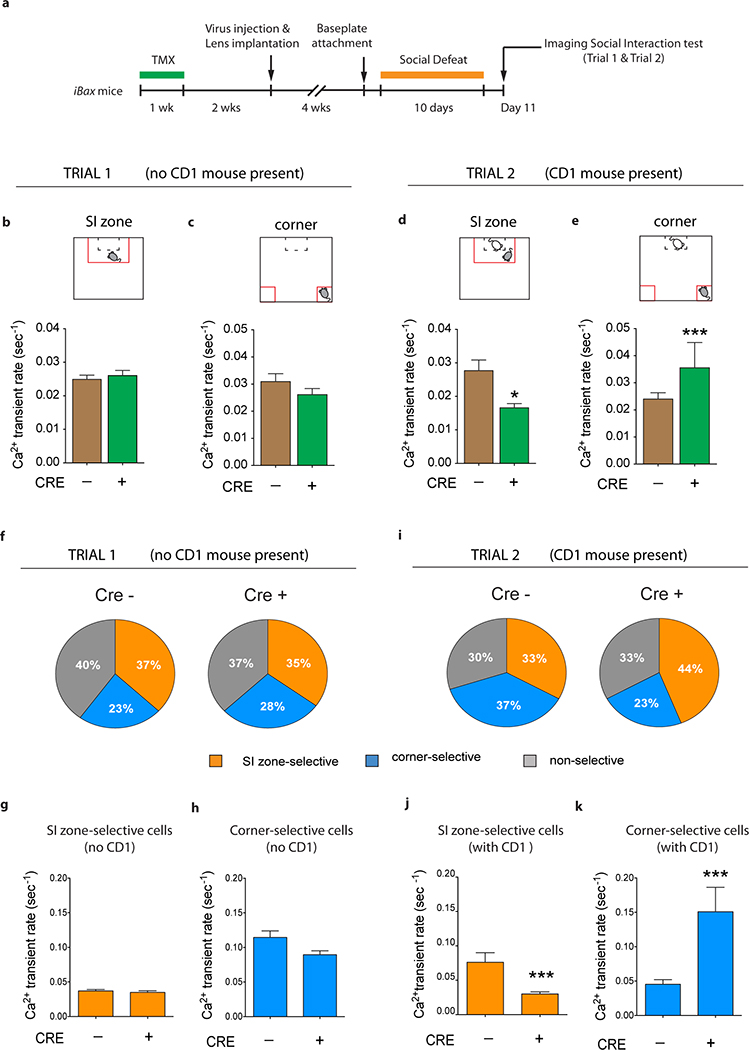
a, Experimental timeline. b, Ca2+ transient rates in the social interaction (SI) zone during trial 1 (NCRE−=546, NCRE+=233). c, Ca2+ transient rates in the corner zones during trial 1 (NCRE−=530, NCRE+=329). d, CRE+ iBax mice show lower Ca2+ transient rates than CRE− mice in the SI zone during trial 2 (Mann Whitney U=67155, *P=0.018; NCRE−=483, NCRE+=308). e, CRE+ iBax mice show higher Ca2+ transient rates than CRE− mice in the corner zones during trial 2 (U=22585, ***P<0.0001; NCRE−=301, NCRE+=206). f, Cell selectivity pie charts for trial 1. g, No differences in Ca2+ transient rates of SI zone selective cells during SI zone exploration in trial 1 (NCRE−=187, NCRE+=79). h, No differences in Ca2+ transient rates of corner-selective cells during corner exploration in trial (NCRE−=119, NCRE+=63). i, Cell selectivity pie charts for trial 2. j, SI zone selective cells show lower Ca2+ transient rates in CRE+ iBax mice than in CRE− mice during SI zone exploration in trial 2 (U=2218, ***P<0.0001; NCRE−=97, NCRE+=85). k, Corner selective cells show higher Ca2+ transient rates in CRE+ iBax mice than in CRE− mice during corner exploration in trial 2 (U=1465, ***P=0.0002; NCRE−=110, NCRE+=43). Error bars, ± s.e.m.
Extended Data Fig. 8 |. iBax mice: decreased vDG activity during stress-induced anxiety-like behavior in the open field test.
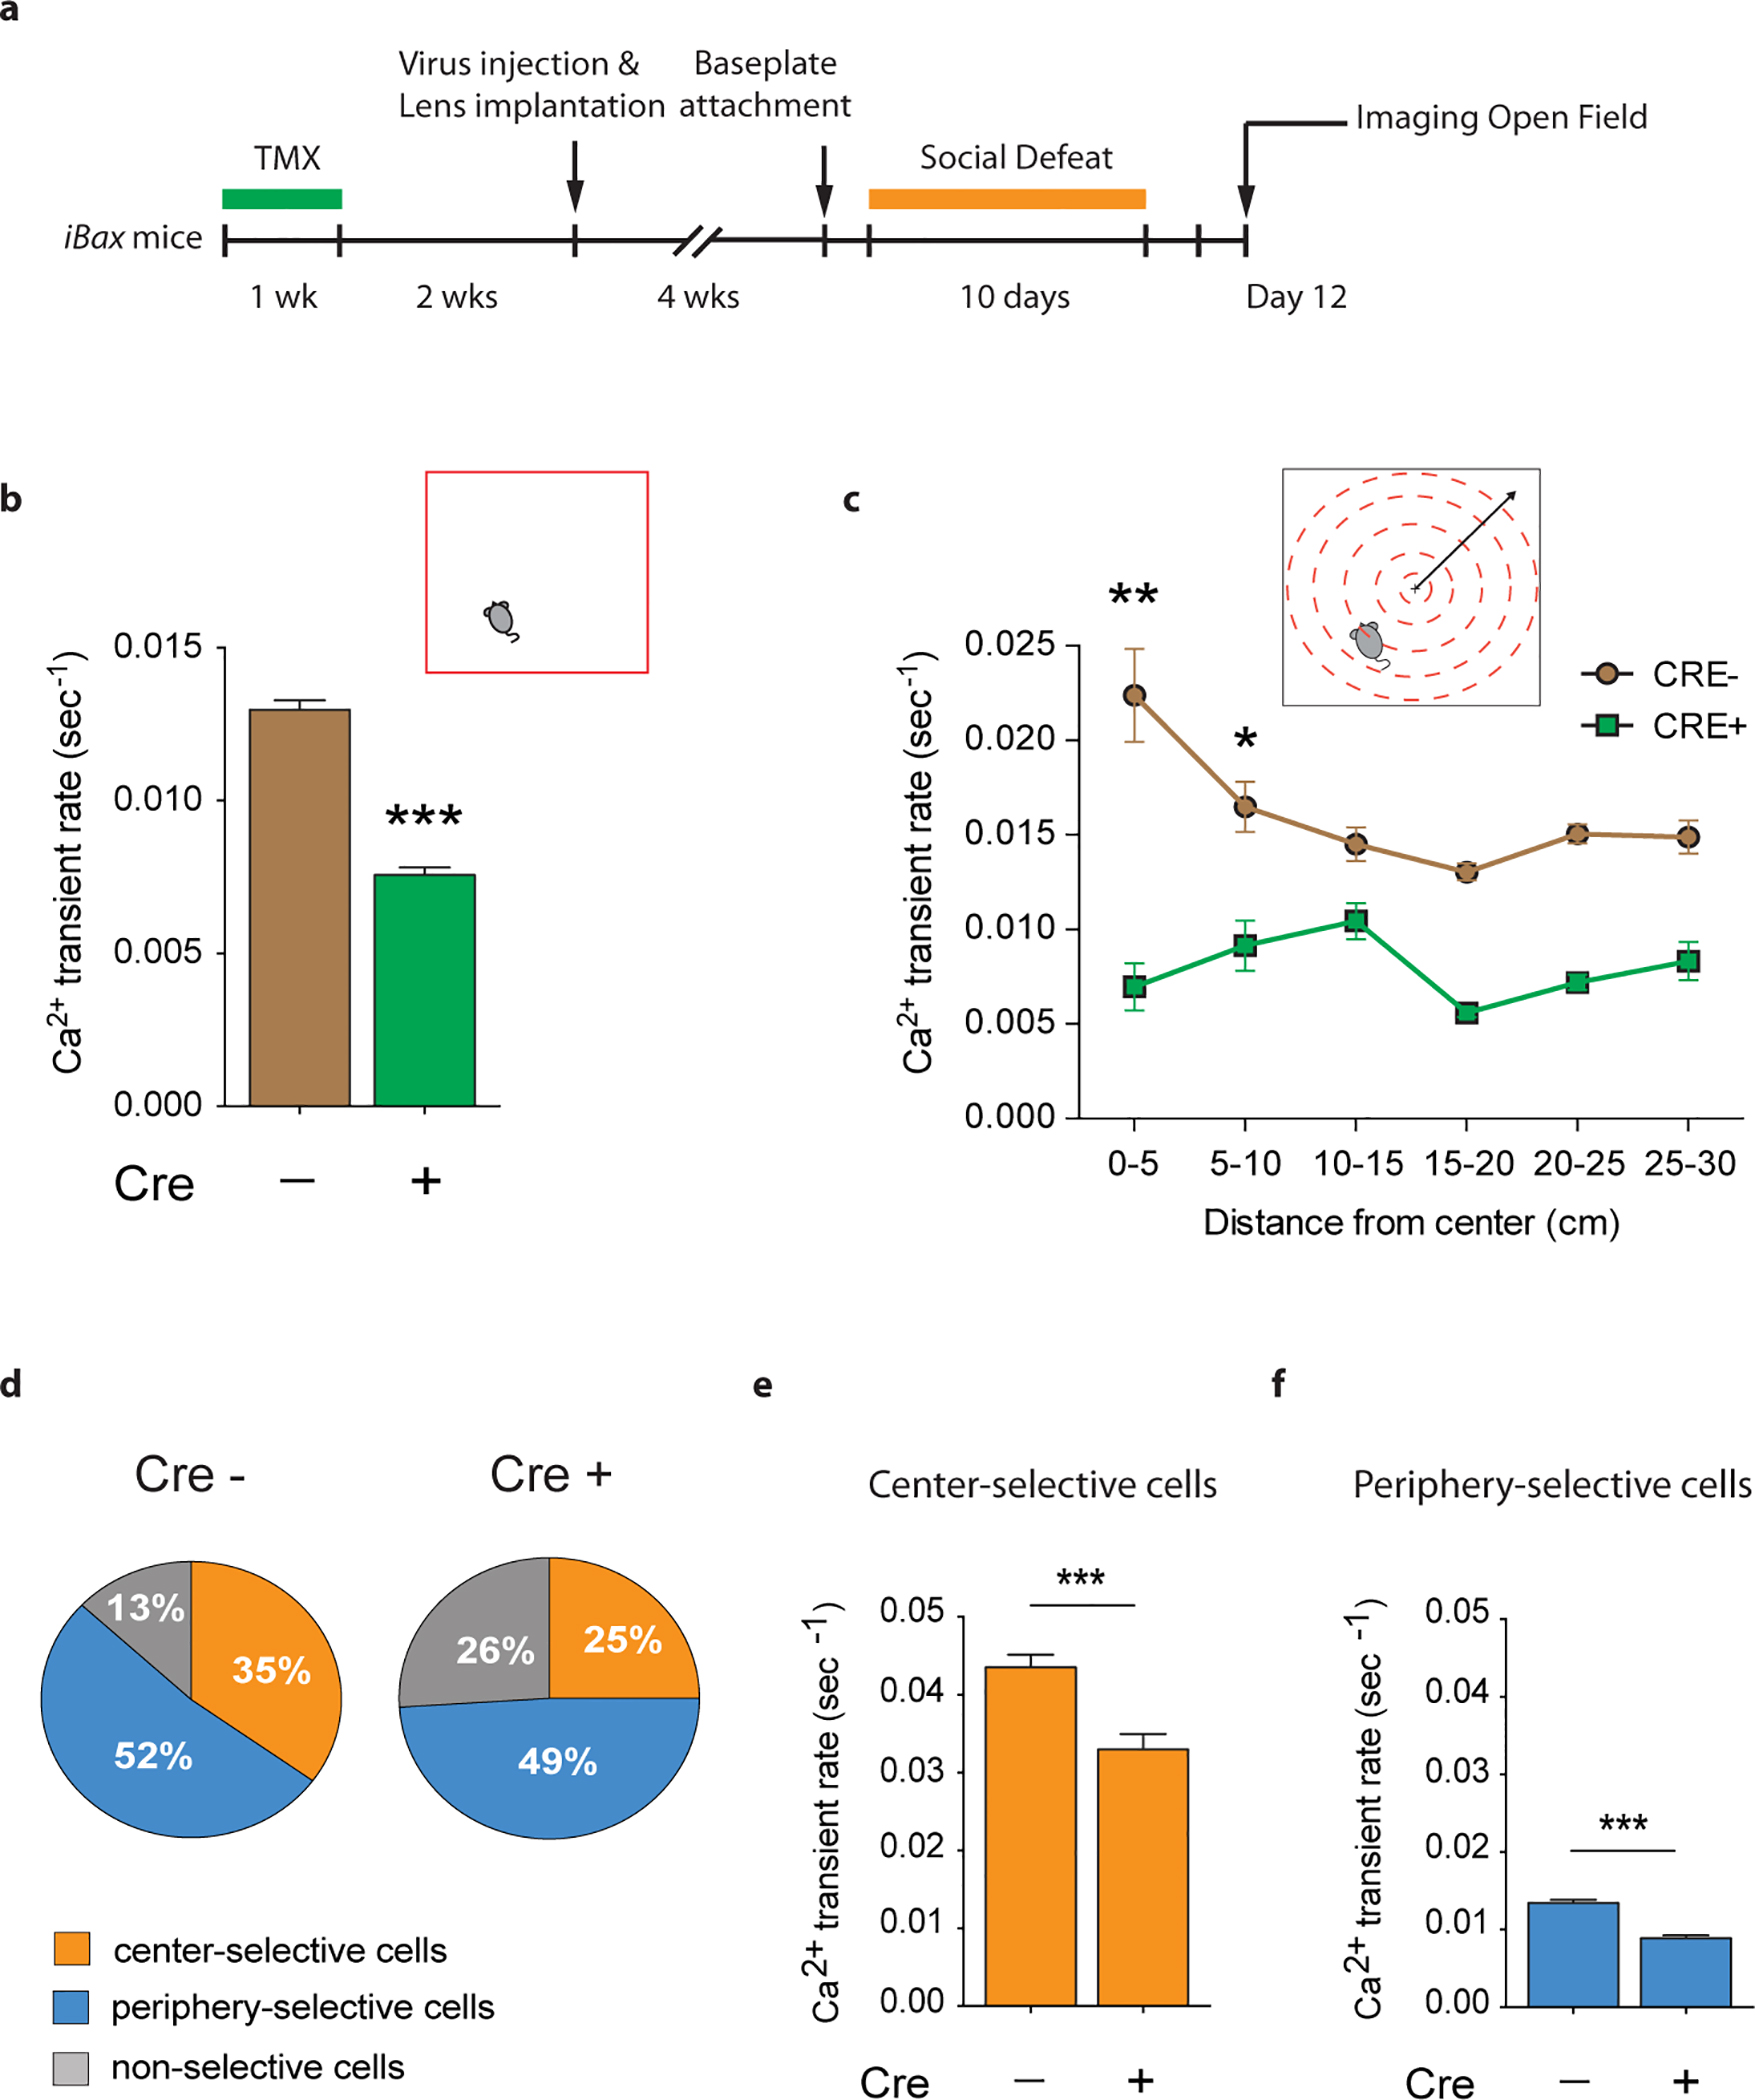
a, Experimental timeline. b, CRE+ iBax mice show lower Ca2+ transient rates than CRE− mice during open field exploration (Mann Whitney U=130884, ***P<0.0001; NCRE−=859 cells, NCRE+=494 cells). c, Ca2+ transient rates are plotted for each 5 cm distance bin away from the center of the open field. CRE− mice exhibit increased Ca2+ transient rates in the center compared to the periphery (Kruskall Wallis H= −22.57, ***P<0.001; Dunn’s test: 0–5 cm vs. 25–30 cm distance from center point: **P=0.002; 5–10 cm vs. 25–30 cm distance from center point: *P=0.026). CRE+ iBax mice did not exhibit increased Ca2+ transient rates in the center compared to the periphery (H=0.93, P=0.97). d, Cell selectivity pie charts. e, Center selective cells show lower Ca2+ transient rates in CRE+ iBax mice than in CRE− mice during center exploration (Mann Whitney U=13892, ***P<0.001, NCRE−=302, NCRE+=122). f, Periphery selective cells show lower Ca2+ transient rates in CRE+ iBax mice than in CRE− mice during periphery exploration (U=34033, ***P<0.001, NCRE−=450, NCRE+=241). Error bars, ± s.e.m.
Extended Data Fig. 9 |. Manipulating mature granule cell activity counteracts the effect of adult hippocampal neurogenesis on stress resilience.
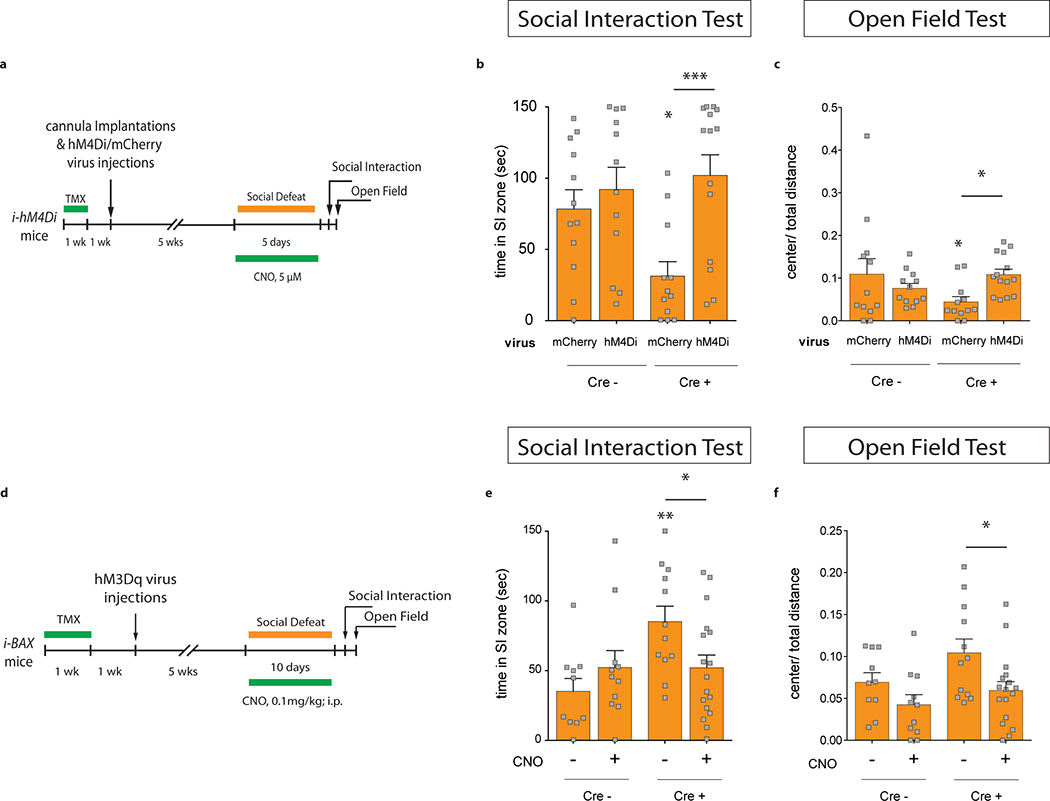
a, Experimental design for sub-chronic social defeat stress (5 days) while inhibiting mature granule cells in i-hM4Di mice. b, Inhibiting mature granule cells with CNO counteracts the pro-susceptibility phenotype of CRE+ i-hM4Di mice in the social interaction test (Interaction F1,46=4.3, *P=0.04; genotype F1,46=1.8, P=0.18; CamKII-hM4Di F1,46=9.5,**P=0.004; post hoc test (CRE− mCherry vs. CRE+ mCherry), *P=0.02; post hoc test (CRE+ mCherry vs. CRE+ hM4Di),***P=0.0006; N=12,12,12,14) and c, in the open field test (Interaction F1,46=5.57, *P=0.02; genotype F1,46=0.64, P=0.43; CamKII-hM4Di F1,46=0.56, P=0.46; post hoc test (CRE− mCherry vs. CRE+ mCherry), *P=0.033; post hoc test (CRE+ mCherry vs. CRE+ hM4Di),*P=0.03; N=12,12,12,14). d, Experimental design for chronic social defeat stress (10 days) while exciting mature granule cells in iBax mice. e, Exciting mature granule cells with CNO counteracts the pro-resilience phenotype of CRE+ iBax mice in the social interaction test (Interaction F1,46=5.63, *P=0.02; genotype F1,46=5.52, *P=0.023; CNO F1,46=0.57, P=0.45; post hoc test (CRE− veh vs. CRE+ veh), **P=0.003; post hoc test (CRE+ veh vs. CRE+ CNO), *P=0.021; N=10, 11, 12, 17) and f, in the open field test (Interaction F1,46=0.5, P=0.49; genotype F1,46=4.1, P=0.05; CNO F1,46=7.71, **P=0.008; planned comparisons: unpaired t-test (CRE− veh vs. CRE+ veh), P=0.1; unpaired t-test (CRE+ veh vs. CRE+ CNO), *P=0.02; N=10, 11, 12, 17. Error bars, ± s.e.m.
Extended Data Fig. 10 |. Acute activation of vDG mature granule cells results in a modest increase in anxiety during open field exploration and does not activate the lateral septum.
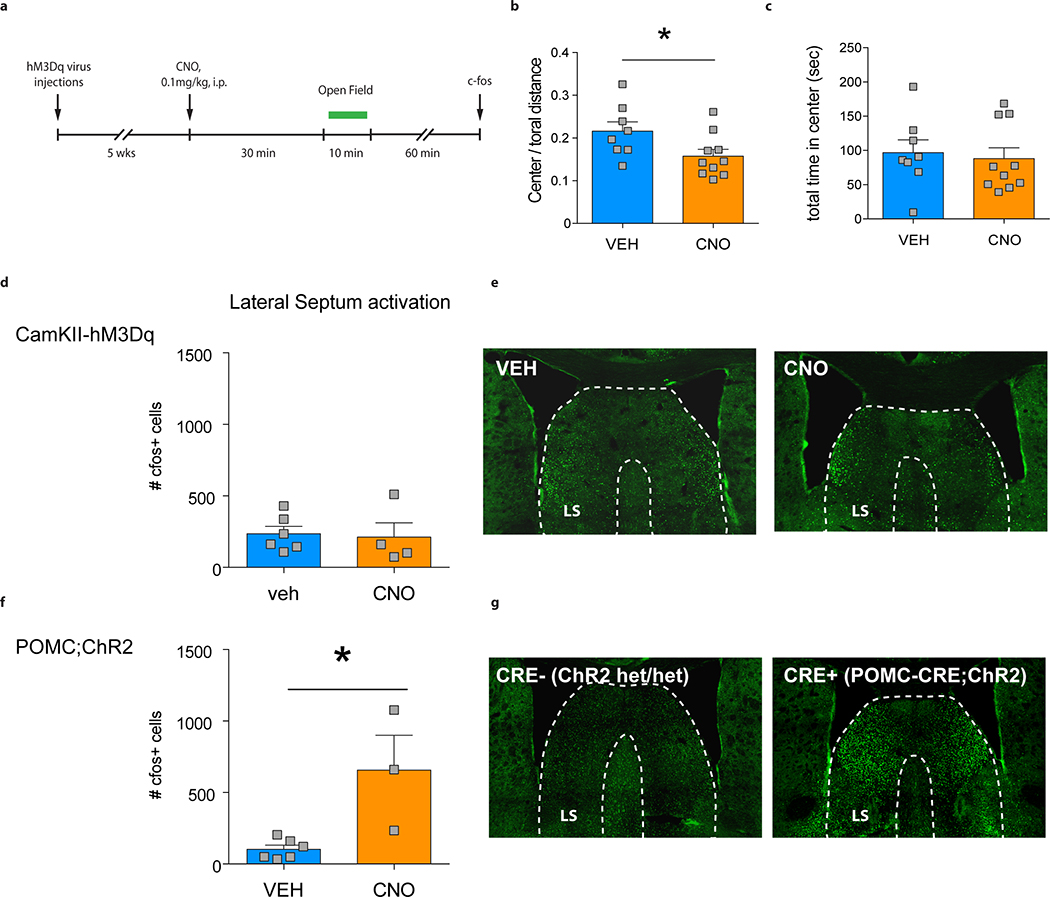
a, Experimental design for acute stimulation of ventral DG mature granule cells during open field exploration. b, Exciting mature granule cells with CNO during open field exploration decreases % center distance traveled (unpaired t-test; *P=0.039; N=8, 10). c, No difference was observed for the total time spent in the center (P=0.72; N=8, 10). d, No difference in c-fos expression was observed in the lateral septum (LS) of mice in which the ventral DG was stimulated during open field exploration using CNO-mediated activation of hM3Dq (P=0.82; N=6, 4). e, Representative images of c-fos expression in the LS upon injection with vehicle (VEH) or CNO. f, Increased c-fos expression was observed in the LS of mice upon optogenetic activation of the ventral DG (POMC-CRE;ChR2), which has been shown to decrease anxiety-like behavior8 (*P=0.01; N=6, 3). g, Representative images of c-fos expression in the LS upon light activation of ChR2 (CRE+; POMC-CRE;ChR2). Error bars, ± s.e.m.
Supplementary Material
Acknowledgements
This work was funded by the National Institutes of Health (K99 MH108719 to C.A; K01 AG054765 to V.M.L.; R37 MH068542, R01 MH083862; R01 NS081203 to R.H.) the Hope for Depression Research Foundation (HDRF RGA-13–003 to R.H.), NYSTEM (C029157 to R.H.), and the German Research Foundation (AN1006/1–1 to C.A.). We would like to thank Dr. Susan Dymecki for providing us with the Cre-responsive stop-mCherry-hM4Di fl/fl mouse line.
Footnotes
Author Contributions
C.A. and R.H. designed the research and wrote the paper. C.A., A.M., B.C., and R.S. conducted behavioral experiments, surgeries, immunohistochemistry, and cell counting. V.M.L. conducted in vitro electrophysiological experiments. C.A., G.S., J.CJ. and B.C. analyzed in vivo imaging data.
The authors declare no competing financial interests.
Extended Data is available for this paper online.
References:
- 1.Snyder JS, Soumier A, Brewer M, Pickel J, Cameron HA. Adult hippocampal neurogenesis buffers stress responses and depressive behaviour. Nature. 2011. [DOI] [PMC free article] [PubMed] [Google Scholar]
- 2.Santarelli L, Saxe M, Gross C, et al. Requirement of hippocampal neurogenesis for the behavioral effects of antidepressants. Science. 2003;301(5634):805–809. [DOI] [PubMed] [Google Scholar]
- 3.Boldrini M, Underwood MD, Hen R, et al. Antidepressants increase neural progenitor cells in the human hippocampus. Neuropsychopharmacology. 2009;34(11):2376–2389. [DOI] [PMC free article] [PubMed] [Google Scholar]
- 4.Lucassen PJ, Stumpel MW, Wang Q, Aronica E. Decreased numbers of progenitor cells but no response to antidepressant drugs in the hippocampus of elderly depressed patients. Neuropharmacology. 2010;58(6):940–949. [DOI] [PubMed] [Google Scholar]
- 5.Strange BA, Witter MP, Lein ES, Moser EI. Functional organization of the hippocampal longitudinal axis. Nat Rev Neurosci. 2014;15(10):655–669. [DOI] [PubMed] [Google Scholar]
- 6.Anacker C, Hen R. Adult hippocampal neurogenesis and cognitive flexibility - linking memory and mood. Nat Rev Neurosci. 2017;18(6):335–346. [DOI] [PMC free article] [PubMed] [Google Scholar]
- 7.Kheirbek MA, Drew LJ, Burghardt NS, et al. Differential control of learning and anxiety along the dorsoventral axis of the dentate gyrus. Neuron. 2013;77(5):955–968. [DOI] [PMC free article] [PubMed] [Google Scholar]
- 8.Spalding KL, Bergmann O, Alkass K, et al. Dynamics of hippocampal neurogenesis in adult humans. Cell. 2013;153(6):1219–1227. [DOI] [PMC free article] [PubMed] [Google Scholar]
- 9.Boldrini M, Fulmore CA, Tartt AN, et al. Human Hippocampal Neurogenesis Persists throughout Aging. Cell Stem Cell. 2018;22(4):589–599. e585. [DOI] [PMC free article] [PubMed] [Google Scholar]
- 10.Sorrells SF, Paredes MF, Cebrian-Silla A, et al. Human hippocampal neurogenesis drops sharply in children to undetectable levels in adults. Nature. 2018;555(7696):377–381. [DOI] [PMC free article] [PubMed] [Google Scholar]
- 11.Danielson NB, Kaifosh P, Zaremba JD, et al. Distinct Contribution of Adult-Born Hippocampal Granule Cells to Context Encoding. Neuron. 2016;90(1):101–112. [DOI] [PMC free article] [PubMed] [Google Scholar]
- 12.Denny CA, Burghardt NS, Schachter DM, Hen R, Drew MR. 4- to 6-week-old adult-born hippocampal neurons influence novelty-evoked exploration and contextual fear conditioning. Hippocampus. 2012;22(5):1188–1201. [DOI] [PMC free article] [PubMed] [Google Scholar]
- 13.Temprana SG, Mongiat LA, Yang SM, et al. Delayed coupling to feedback inhibition during a critical period for the integration of adult-born granule cells. Neuron. 2015;85(1):116–130. [DOI] [PMC free article] [PubMed] [Google Scholar]
- 14.David DJ, Samuels BA, Rainer Q, et al. Neurogenesis-dependent and -independent effects of fluoxetine in an animal model of anxiety/depression. Neuron. 2009;62(4):479–493. [DOI] [PMC free article] [PubMed] [Google Scholar]
- 15.Hill AS, Sahay A, Hen R. Increasing Adult Hippocampal Neurogenesis is Sufficient to Reduce Anxiety and Depression-Like Behaviors. Neuropsychopharmacology. 2015;40(10):2368–2378. [DOI] [PMC free article] [PubMed] [Google Scholar]
- 16.Culig L, Surget A, Bourdey M, et al. Increasing adult hippocampal neurogenesis in mice after exposure to unpredictable chronic mild stress may counteract some of the effects of stress. Neuropharmacology. 2017;126:179–189. [DOI] [PubMed] [Google Scholar]
- 17.Dranovsky A, Picchini AM, Moadel T, et al. Experience dictates stem cell fate in the adult hippocampus. Neuron. 2011;70(5):908–923. [DOI] [PMC free article] [PubMed] [Google Scholar]
- 18.Ray RS, Corcoran AE, Brust RD, et al. Impaired respiratory and body temperature control upon acute serotonergic neuron inhibition. Science. 2011;333(6042):637–642. [DOI] [PMC free article] [PubMed] [Google Scholar]
- 19.Wook Koo J, Labonté B, Engmann O, et al. Essential Role of Mesolimbic Brain-Derived Neurotrophic Factor in Chronic Social Stress-Induced Depressive Behaviors. Biol Psychiatry. 2016;80(6):469–478. [DOI] [PMC free article] [PubMed] [Google Scholar]
- 20.Kempermann G, Kuhn HG, Gage FH. More hippocampal neurons in adult mice living in an enriched environment. Nature. 1997;386(6624):493–495. [DOI] [PubMed] [Google Scholar]
- 21.van Praag H, Kempermann G, Gage FH. Running increases cell proliferation and neurogenesis in the adult mouse dentate gyrus. Nat Neurosci. 1999;2(3):266–270. [DOI] [PubMed] [Google Scholar]
- 22.Sahay A, Scobie KN, Hill AS, et al. Increasing adult hippocampal neurogenesis is sufficient to improve pattern separation. Nature. 2011;472(7344):466–470. [DOI] [PMC free article] [PubMed] [Google Scholar]
- 23.Krishnan V, Han MH, Graham DL, et al. Molecular adaptations underlying susceptibility and resistance to social defeat in brain reward regions. Cell. 2007;131(2):391–404. [DOI] [PubMed] [Google Scholar]
- 24.Burghardt NS, Park EH, Hen R, Fenton AA. Adult-born hippocampal neurons promote cognitive flexibility in mice. Hippocampus. 2012;22(9):1795–1808. [DOI] [PMC free article] [PubMed] [Google Scholar]
- 25.Ikrar T, Guo N, He K, et al. Adult neurogenesis modifies excitability of the dentate gyrus. Front Neural Circuits. 2013;7:204. [DOI] [PMC free article] [PubMed] [Google Scholar]
- 26.Drew LJ, Kheirbek MA, Luna VM, et al. Activation of local inhibitory circuits in the dentate gyrus by adult-born neurons. Hippocampus. 2016;26(6):763–778. [DOI] [PMC free article] [PubMed] [Google Scholar]
- 27.Jimenez JC, Su K, Goldberg AR, et al. Anxiety Cells in a Hippocampal-Hypothalamic Circuit. Neuron. 2018;97(3):670–683. e676. [DOI] [PMC free article] [PubMed] [Google Scholar]
- 28. Padilla-Coreano N, Bolkan SS, Pierce GM, et al. Direct Ventral Hippocampal-Prefrontal Input Is Required for Anxiety-Related Neural Activity and Behavior. Neuron. 2016;89(4):857–866. [DOI] [PMC free article] [PubMed] [Google Scholar]
- 29.Bagot RC, Parise EM, Peña CJ, et al. Ventral hippocampal afferents to the nucleus accumbens regulate susceptibility to depression. Nat Commun. 2015;6:7062. [DOI] [PMC free article] [PubMed] [Google Scholar]
- 30.Golden SA, Covington HE, Berton O, Russo SJ. A standardized protocol for repeated social defeat stress in mice. Nat Protoc. 2011;6(8):1183–1191. [DOI] [PMC free article] [PubMed] [Google Scholar]
- 31.Anacker C, Scholz J, O’Donnell KJ, et al. Neuroanatomic Differences Associated With Stress Susceptibility and Resilience. Biol Psychiatry. 2016;79(10):840–849. [DOI] [PMC free article] [PubMed] [Google Scholar]
- 32.Resendez SL, Jennings JH, Ung RL, et al. Visualization of cortical, subcortical and deep brain neural circuit dynamics during naturalistic mammalian behavior with head-mounted microscopes and chronically implanted lenses. Nat Protoc. 2016;11(3):566–597. [DOI] [PMC free article] [PubMed] [Google Scholar]
- 33.Wu MV, Hen R. Functional dissociation of adult-born neurons along the dorsoventral axis of the dentate gyrus. Hippocampus. 2014;24(7):751–761. [DOI] [PMC free article] [PubMed] [Google Scholar]
- 34.Ghosh KK, Burns LD, Cocker ED, et al. Miniaturized integration of a fluorescence microscope. Nat Methods. 2011;8(10):871–878. [DOI] [PMC free article] [PubMed] [Google Scholar]
- 35.Ziv Y, Burns LD, Cocker ED, et al. Long-term dynamics of CA1 hippocampal place codes. Nat Neurosci. 2013;16(3):264–266. [DOI] [PMC free article] [PubMed] [Google Scholar]
- 36.Mukamel EA, Nimmerjahn A, Schnitzer MJ. Automated analysis of cellular signals from large-scale calcium imaging data. Neuron. 2009;63(6):747–760. [DOI] [PMC free article] [PubMed] [Google Scholar]
- 37.Mongiat LA, Espósito MS, Lombardi G, Schinder AF. Reliable activation of immature neurons in the adult hippocampus. PLoS One. 2009;4(4):e5320. [DOI] [PMC free article] [PubMed] [Google Scholar]
- 38.Dieni CV, Nietz AK, Panichi R, Wadiche JI, Overstreet-Wadiche L. Distinct determinants of sparse activation during granule cell maturation. J Neurosci. 2013;33(49):19131–19142. [DOI] [PMC free article] [PubMed] [Google Scholar]
Associated Data
This section collects any data citations, data availability statements, or supplementary materials included in this article.
Supplementary Materials
Data Availability Statement
The source data supporting the findings of this study are included in this manuscript. Additional source data will be available from the corresponding authors (C.A. and R.H.) upon reasonable request.


