Abstract
Two Arabidopsis thaliana extragenic mutations that suppress NaCl hypersensitivity of the sos3–1 mutant were identified in a screen of a T-DNA insertion population in the genetic background of Col-0 gl1 sos3–1. Analysis of the genome sequence in the region flanking the T-DNA left border indicated that sos3–1 hkt1–1 and sos3–1 hkt1–2 plants have allelic mutations in AtHKT1. AtHKT1 mRNA is more abundant in roots than shoots of wild-type plants but is not detected in plants of either mutant, indicating that this gene is inactivated by the mutations. hkt1–1 and hkt1–2 mutations can suppress to an equivalent extent the Na+ sensitivity of sos3–1 seedlings and reduce the intracellular accumulation of this cytotoxic ion. Moreover, sos3–1 hkt1–1 and sos3–1 hkt1–2 seedlings are able to maintain [K+]int in medium supplemented with NaCl and exhibit a substantially higher intracellular ratio of K+/Na+ than the sos3–1 mutant. Furthermore, the hkt1 mutations abrogate the growth inhibition of the sos3–1 mutant that is caused by K+ deficiency on culture medium with low Ca2+ (0.15 mM) and <200 μM K+. Interestingly, the capacity of hkt1 mutations to suppress the Na+ hypersensitivity of the sos3–1 mutant is reduced substantially when seedlings are grown in medium with low Ca2+ (0.15 mM). These results indicate that AtHKT1 is a salt tolerance determinant that controls Na+ entry and high affinity K+ uptake. The hkt1 mutations have revealed the existence of another Na+ influx system(s) whose activity is reduced by high [Ca2+]ext.
High [NaCl]ext disturbs intracellular ion homeostasis of plants, which leads to membrane dysfunction, attenuation of metabolic activity, and secondary effects that cause growth inhibition and lead ultimately to cell death (1). Both glycophytes and halophytes use a similar strategy that involves regulation of net Na+ flux across the plasma membrane and vacuolar compartmentalization of the internalized cation to mediate intracellular Na+ homeostasis. This strategy requires the coordinated function of numerous ion transport determinants and effectively partitions the toxic ion away from critical cytosolic and organellar machinery. Under conditions of high [Na+]ext, the functioning of these determinants also facilitates the use of Na+ as an osmolyte to mediate osmotic adjustment that is necessary for cell expansion (1–3). Because vacuolar expansion is the primary mechanism of plant cell enlargement, this strategy is likely to be an essential adaptation to saline environments.
Recently, putative plasma membrane and tonoplast localized Na+/H+ transporters were identified in plants that are presumed to mediate energized transport of Na+ outward from the cytosol to the apoplast or into the vacuole (4–7). These transporters are apparently the molecular effectors of Na+/H+ antiporter activities associated with plasma membrane and tonoplast vesicles that were described more than a decade ago (1, 3, 8, 9). The plasma membrane Na+/H+ antiporter is the principal facilitator of cellular Na+ efflux, whereas the tonoplast antiporter is the primary transport system for Na+ compartmentalization into the vacuole.
Na+ uptake across the plasma membrane has been attributed to low Na+ permeability properties of systems that transport the essential nutrient K+ (3, 10, 11). Transport systems that have high affinity for K+ but also have low affinity for Na+ include inward rectifying K+ channels (KIRCs) like AKT1, outward rectifying K+ channels (KORCs), and the KUP/HAK family of K+–H+ symporters (3, 11, 12). However, there have been some suggestions that Na+ influx may be mediated also by low affinity cation or nonspecific cation transport systems (1, 3, 10, 11). The high affinity K+ transporter (HKT1), low affinity cation transporter (LCT1), and nonselective cation channels are considered to be the most likely specific transport systems that mediate high Na+ influx (10, 11, 13–16).
Support for the hypothesis that K+ transport systems also mediate Na+ entry derive from physiological studies conducted more than 30 years ago, which established that Na+ adversely affects K+ acquisition to the extent that plants growing in saline environments can be deficient for this essential nutrient (17, 18). Regulation of net K+/Na+ selective intracellular uptake is Ca2+-dependent (19, 20), although regulatory mechanisms and focal control points have not been described in detail (21–23). Extensive screening of Arabidopsis mutants for increased salt sensitivity has identified the Ca2+-dependent salt-overly sensitive (SOS) stress signal pathway. Three genetically linked loci (SOS1, SOS2, and SOS3) express determinants that control both Na+ and K+ homeostasis and salt tolerance (21–23). The sos1, sos2, and sos3 mutants are Na+ and Li+ sensitive and exhibit K+ deficiency when grown in solutions containing μM concentrations of this essential nutrient. High [Ca2+]ext can suppress Na+/Li+ sensitivity and K+ deficiency of sos3 but not of sos1 seedlings (24). SOS3 is an EF-hand type Ca2+ binding protein with sequence similarity to the calcineurin B subunit and neuronal Ca2+ sensors (25). Ca2+ binding is required for in vivo function (26) that includes the activation of the SOS2 kinase (27, 28), which in turn regulates SOS1 expression (7). SOS1 encodes a putative plasma membrane-localized Na+/H+ antiporter that is presumed to be involved in the control of net Na+ flux across the plasma membrane. Present models based on these findings indicate that the SOS pathway mediates both Ca2+ activation of plasma membrane Na+ efflux through SOS1 and K+ acquisition at low external concentrations (μM) through an unidentified K+ transport system (21–23, 29).
A screen of a T-DNA-tagged Arabidopsis (Col-0 gl1 sos3–1) population was conducted to identify mutations that suppress the salt hypersensitivity of the sos3–1 mutant. Potential suppressor mutations might result in activated alleles encoding signal components downstream of SOS3, components of a parallel regulatory pathway(s), or other salt tolerance effectors regulated by stress signal pathways, or might be intragenic mutations in the sos3–1 allele. Alternatively, mutants with functional disruptions in genes encoding negative regulators of the SOS pathway that are downstream of SOS3 would exhibit enhanced salt tolerance relative to sos3–1 plants. Herein is reported the identification of two allelic T-DNA insertion mutations in AtHKT1 (hkt1–1 and hkt1–2) that functionally disrupt its expression and suppress the Na+ hypersensitive phenotype of the sos3–1 mutant. Our results implicate AtHKT1 as an important Na+ influx system in plant roots. Further phenotypic analyses of the sos3–1 hkt1 mutants provide in planta evidence of another Na+ entry system(s) that is inhibited by [Ca2+]ext and indicate that AtHKT1 negatively regulates high affinity K+ transport.
Materials and Methods
Plant Materials.
The activation T-DNA vector pSKI015 (ref. 30, provided by D. Weigel, The Salk Institute, La Jolla, CA) was used to generate an insertion mutant population (T1) in the genetic background of Arabidopsis thaliana Col-0 gl1 sos3–1 based on glufosinate herbicide selection. Plants were grouped into 10-line pools, and T2 progenies were screened for mutants that exhibit less NaCl hypersensitivity than the sos3–1 mutant. Seeds were surface sterilized and sown onto cellophane membrane (Bio-Rad, no. 1650963) that was placed over germination medium [1× of the Murashige and Skoog (MS) salt formulation (31), B5 vitamins, 30 g⋅liter−1 sucrose, and 12 g⋅liter−1 agar, pH 5.7]. Four-day-old seedlings were inoculated onto NaCl-containing medium (basal constituents and 120 mM NaCl) by transferring the entire cellophane membrane onto the fresh medium. The confirmatory screen for suppressor mutations of sos3–1 NaCl hypersensitivity was conducted by using between 35 and 40 T3 progeny of each putative mutant and the root-bending assay procedure of Liu and Zhu (24).
PCR Analyses.
Identification of SOS3 and sos3–1 alleles.
DNA was isolated from T3 mutant progeny by using a modified rapid DNA mini-preparation procedure (32) and used as template to confirm the sos3–1 genetic background. The forward primer for SOS3 was 5′-ATGTGCTTTCAAGTTGTACG-3′ and for sos3–1 was 5′-GCTGTGCTTTCAAGTTACG-3′. The same reverse primer was used to detect either allele (5′-TTTATCTTTCCTTGCATGGC-3′).
Thermal assymetric interlaced-PCR identification of T-DNA flanking region.
The genomic sequence flanking the T-DNA left border was determined by thermal assymetric interlaced-PCR analysis (32). A nested set of three primers (oriented outward) corresponding to sequence in the T-DNA left border was used in successive PCRs: left border (LB) primer 1 = 5′-ATACGACGGATCGTAATTTGTC-3′, LB primer 2 = 5′-TAATAACGCTGCGGACATCTAC-3′, and LB primer 3 = 5′-TTGACCATCATACTCATTGCTG-3′. The degenerate (Deg) primers were Deg 1 = 5′-WGCNAGTNAGWANAAG-3′ and Deg 2 = 5′-AWGCANGNCWGANATA-3′; W = A/T and N = A/T/G/C. The nucleotide sequence of the PCR product was determined and subjected to blastn analysis.
Detection of AtHKT1 and hkt1 alleles.
The AtHKT1 wild-type allele was identified by PCR analysis by using forward (5′-AGTAGACCTCTCTACACTTTCC-3′) and reverse (5′-TTACTTCCTCAATCCATGGGAG-3′) primers corresponding to genome regions flanking both sides of the T-DNA insertion in the sos3–1 hkt1–1 mutant. Detection of the mutant hkt1–1 and hkt1–2 alleles was based on reactions using the forward primer for amplification of AtHKT1 sequence and, as a reverse primer, the T-DNA LB primer 3.
Reverse transcription–PCR analysis of AtHKT1 expression.
Total RNA was isolated from shoots or roots, and 2 μg of total RNA was the template for first-strand cDNA synthesis. PCR was carried out by using forward-nested gene-specific primers for AtHKT1, as follows: first reaction, 5′-GCTTAAACCGACTCGAGAAC-3′; second reaction, 5′-ATGGACAGAGTGGTGGCAAA-3′. The same reverse primer was used for both PCRs (5′-TTAGGAAGACGAGGGGTAAA-3′). AtNHX1 gene-specific primers were used to amplify a positive control PCR product (not shown) (S.Y., unpublished work).
Salt Stress and Nutrient Growth Responses.
Experiments were conducted with plants of wild-type Col-0 (SOS3 HKT1), sos3–1, sos3–1 hkt1–1 (T4 homozygous progeny), and sos3–1 hkt1–2 (T3 homozygous progeny). Four-day-old seedlings were transferred to fresh medium that was supplemented with various salts, as indicated in the figure legends.
Na+ and K+ Ion Content Determinations.
Seeds were inoculated onto germination medium with 8 g⋅liter−1 agar. Three-week-old seedlings (n = 50) were transferred to 50 ml of liquid medium (1/2 × MS salts, 20 g⋅liter−1 sucrose at pH 5.7). After 2 days, the medium was supplemented with NaCl to a final concentration of 100 mM by the addition of a 5 M stock solution. The seedlings were harvested after 2 days, rinsed with deionized water, and dried at 65°C for 2 days. One-hundred milligrams of ground dry matter was then extracted with 10 ml of 0.1 M HNO3 for 30 min and then filtered through Whatman no. 1 filter paper. K+ and Na+ contents in the solution were determined by using an atomic absorption spectrophotometer (Varian SpectrAA-10). Na+ and K+ content data were verified by inductively coupled plasma analysis (Perkin–Elmer Plasma 400 emission spectrometer).
Results
Extragenic Mutations That Suppress sos3–1 NaCl Hypersensitivity Include Two hkt1 Mutant Alleles.
T2 seedlings of 65,000 individual T-DNA insertion lines generated in the sos3–1 genetic background were screened for salt tolerance gain-of-function mutants. Putative mutants were identified because they were more NaCl tolerant than sos3–1 seedlings based primarily on criteria of shoot and root growth, root tip swelling, and shoot anthocyanin accumulation. T3 progeny from 15 different putative mutants were obtained after self-fertilization, and the suppression of the salt hypersensitive phenotypes was confirmed by comparing growth responses to wild-type and sos3–1 seedlings in medium supplemented with NaCl. PCR analysis confirmed that all mutants in the T3 generation were homozygous for the sos3–1 allele (not shown).
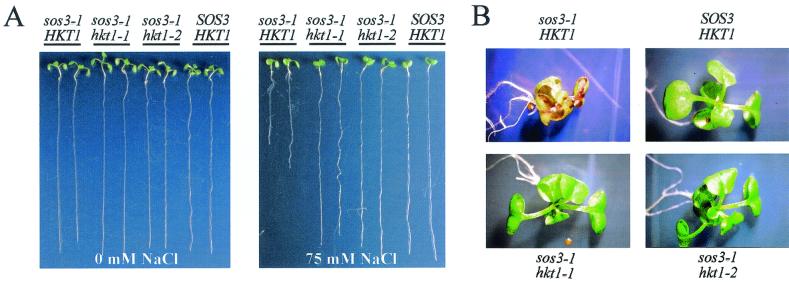
Two mutants were identified that are phenotypically identical, having better root and shoot growth and reduced anthocyanin accumulation relative to the sos3–1 mutant on medium with NaCl (Fig. 1). Root growth comparison (Fig. 1A) as well as visual observation of shoot anthocyanin pigment accumulation (Fig. 1B) indicated that the suppression of sos3–1 salt sensitivity by the mutations is complete at 75 mM NaCl. These genotypes have T-DNA insertions in AtHKT1 (located in chromosome IV) at nucleotide positions 39,033 (first intron) and 40,894 (second intron) of bacterial artificial chromosome clone F24G24 (GenBank accession no. AL049488) for the sos3–1 hkt1–1 and sos3–1 hkt1–2 mutants, respectively. PCR analysis determined that sos3–1 hkt1–1 and sos3–1 hkt1–2 T3 progenies were homozygous for the respective mutant allele. The hkt1 mutants were crossed to Col-0 sos3–1, and the F1 progeny (n = 122 for sos3–1 × sos3–1 hkt1–1 and n = 108 for sos3–1 × sos3–1 hkt1–2) all exhibited the sos3–1 NaCl-sensitive phenotype and were herbicide-resistant (not shown). F2 analysis of sos3–1 hkt1–1 (n > 1,000 seedlings) and sos3–1 hkt1–2 (n = 375 seedlings) backcrosses revealed a segregation ratio of 3:1 for NaCl sensitivity/NaCl sensitivity suppression (χ2 test, P > 0.05).
Figure 1.
The hkt1–1 and hkt1–2 mutations suppress the NaCl hypersensitive phenotypes of sos3–1. Photographs are of representative Col-0 wild-type (SOS3 HKT1), sos3–1 (sos3–1 HKT1), and sos3–1 hkt1–1 and sos3–1 hkt1–2 T3 seedlings. Four-day-old seedlings were transferred to fresh medium and illustrated is root growth on medium without (0) or supplemented with 75 mM NaCl after 6 days (A) and shoot growth and anthocyanin accumulation on medium with 75 mM NaCl after 15 days (B).
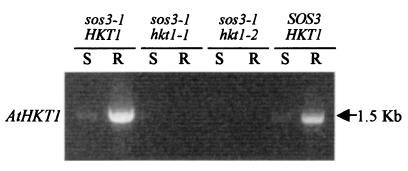
AtHKT1 transcript is expressed predominantly in roots of wild-type plants but is not detected either in roots or shoots of sos3–1 hkt1–1 or sos3–1 hkt1–2 plants, indicating that the AtHKT1 gene is inactive in these mutants (Fig. 2). Increasing the PCR amplification from 20 (Fig. 2) to 30 (not shown) cycles per reaction resulted in detection of a prominent AtHKT1 transcript in the shoot of wild type but did not amplify a product from RNA of the shoot or root of sos3–1 hkt1 mutants. Together, these results indicate that the T-DNA insertions in sos3–1 hkt1–1 and sos3–1 hkt1–2 cause single gene recessive mutations that suppress the NaCl hypersensitivity of the sos3–1 mutant by disrupting the expression of the AtHKT1 gene.
Figure 2.
AtHKT1 transcript abundance is greater in the root (R) than the shoot (S) of Col-0 wild-type plants, and expression is functionally disrupted in sos3–1 hkt1–1 and sos3–1 hkt1–2. Two micrograms of total RNA was isolated from shoots or roots of Col-0 wild-type (SOS3 HKT1), sos3–1 (sos3–1 HKT1), or sos3–1 hkt1–1 or sos3–1 hkt1–2 T3 plants (3 weeks old) to produce first-strand cDNA. One microliter of this product was used as template for the first PCR amplification (20 cycles). One microliter of the reaction product was used for the second PCR (20 cycles).
The hkt1 Mutations Preferentially Suppress the Na+ over the Li+-Sensitive Phenotype of the sos3–1 Mutant.
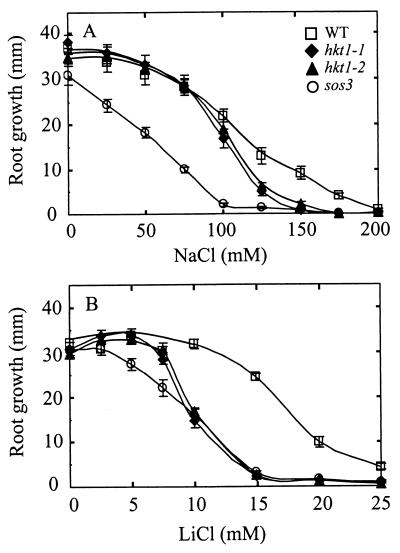
The sos3–1 mutant hypersensitivity to NaCl and LiCl but not to KCl, CsCl, or mannitol is manifested as a reduction in root and shoot growth and shoot anthocyanin accumulation (Fig. 1; ref. 24). Comparison of root growth on medium with NaCl indicated that hkt1–1 and hkt1–2 mutations suppress the NaCl-sensitive phenotype of the sos3–1 mutant (Fig. 3A). Root growth of sos3–1 hkt1–1 and sos3–1 hkt1–2 seedlings was similar to that of wild-type seedlings on medium with 75 mM NaCl, less than wild-type seedlings on medium with 100 mM NaCl, and completely inhibited if the medium was supplemented with 150 mM NaCl. On medium with 100 mM NaCl, root growth of sos3–1 hkt1 mutants was nearly equivalent to wild type after 3 days (not shown) and decreased to about 85% and 65% of wild type after 6 (Fig. 3A) and 9 (not shown) days, respectively. NaCl-induced root growth inhibition of sos3–1 hkt1 mutants was accompanied by reduced shoot growth and an accumulation of anthocyanin pigments as occurs with the sos3–1 mutant.
Figure 3.
The hkt1–1 and hkt1–2 mutations suppress sos3–1 Na+ hypersensitivity. Root growth of Col-0 wild-type (□), sos3–1 (○), sos3–1 hkt1–1 (⧫), or sos3–1 hkt1–2 (▴) seedlings was determined after 6 days on basal medium with MS salts and supplemented with NaCl (A) or LiCl (B). Values are the mean ± SE, n = 13.
The sos3–1 hkt1 seedlings also exhibited more growth on medium with LiCl than those of the sos3–1 mutant (Fig. 3B). However, the suppression of the Li+ hypersensitivity of the sos3–1 mutant by hkt1 mutations was much less than the suppression of Na+ sensitivity. These results and those of Uozumi et al. (33) indicate that AtHKT1 is an influx system for Na+ and, perhaps, for Li+. The time- and concentration-dependent suppression of the Na+-sensitive phenotype of the sos3–1 mutant indicates that AtHKT1 is not the only Na+ entry system in Arabidopsis; otherwise, a tolerance phenotype greater than wild type would be expected.
K+ Deficiency Phenotype of sos3–1 Mutant Is Suppressed by hkt1 Mutations.
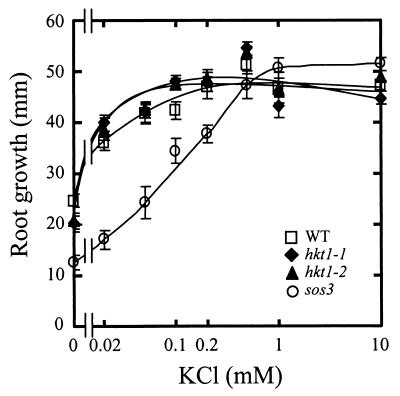
Root growth of sos3–1 seedlings in medium with low (μM) levels of K+ is substantially less than wild-type seedlings (24). Interestingly, root growth of both sos3–1 hkt1 mutants was always similar to wild type over the [K+]ext range that the sos3–1 mutant exhibits a K+ deficiency phenotype (Fig. 4). Similar relative root growth differences occurred if seeds were germinated on medium containing 20 μM or 20 mM KCl (not shown). The suppression of the K+ deficiency phenotype of the sos3–1 mutant by the hkt1–1 and hkt1–2 mutations was unaffected by [Ca2+]ext (not shown). These results indicate that AtHKT1 is not a high affinity K+ uptake system because its functional elimination results in alleviation and not exacerbation of the K+-deficient phenotype of the sos3–1 mutant. However, AtHKT1 may modulate activity of a high affinity K+ transporter because the disruption mutations have a positive effect on K+ acquisition by sos3–1 mutant plants. Of known K+ transporters, most likely this modulated system is AKT1 because the 1 mM [NH4+]ext included in the medium should inhibit the KUP family of high affinity K+ transporters (34).
Figure 4.
The hkt1–1 and hkt1–2 mutations suppress the K+ deficiency phenotype of sos3–1. Root growth of Col-0 wild-type (□), sos3–1 (○), sos3–1 hkt1–1 (⧫), or sos3–1 hkt1–2 (▴) seedlings was evaluated 9 days after their transfer directly onto basal medium with MS micronutrients (KI replaced by NaI), 1/20× macronutrients [KNO3 eliminated and KH2PO4 replaced by (NH4)2HPO4] and supplemented with various amounts of KCl. Illustrated are the mean values ± SE, n = 30.
hkt1 Mutation Suppression of the sos3–1 Mutant Na+ Hypersensitivity Is Ca2+-Dependent.
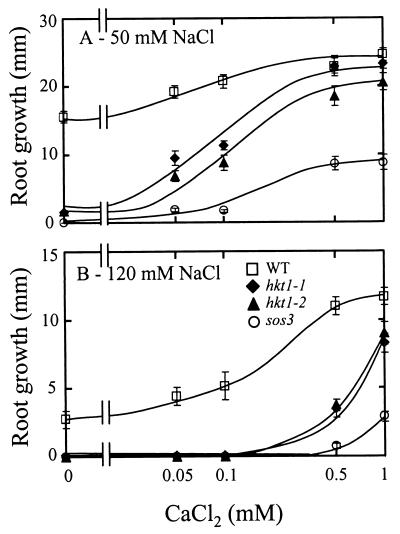
Na+ hypersensitivity of sos3–1 mutant seedlings is increased at lower [Ca2+]ext (Fig. 5), and virtually no shoot (not shown) or root growth (Fig. 5A) occurred through 9 days on medium with 50 mM NaCl and low [Ca2+]ext. The capacity of hkt1 mutations to suppress Na+ hypersensitivity of sos3–1 mutant seedlings also is Ca2+-dependent (Fig. 5). Similar to the sos3–1 mutant, root and shoot growth of sos3–1 hkt1 mutants were severely inhibited on medium containing 50 mM NaCl and not supplemented with CaCl2. Wild-type seedlings exhibited greater Na+ sensitivity on medium with low [Ca2+]ext, particularly on medium with 120 mM NaCl (Fig. 5B), which is consistent with many past reports (19). All of these observations indicate the occurrence of another Na+ entry system that is Ca2+-dependent. NaCl inhibition of sos3–1 hkt1 mutant seedling root growth at low [Ca2+]ext was not substantially affected when the medium KCl level was lowered from 20 mM KCl (Fig. 5) to 20 μM (not shown). Germination of seeds on medium without or with 20 mM KCl did not affect the subsequent relative root growth of either wild-type or mutant seedlings on medium supplemented with NaCl and low CaCl2 (not shown).
Figure 5.
Suppression of sos3–1 Na+ hypersensitivity by hkt1 mutations is Ca2+-dependent. Root growth of Col-0 wild-type (□), sos3–1 (○), sos3–1 hkt1–1 (⧫), or sos3–1 hkt1–2 (▴) seedlings was evaluated 9 days after their transfer directly onto basal medium with MS micronutrients and macronutrients with 0 or various amounts of CaCl2. Data are for seedling root growth on medium supplemented with 50 mM (A) or 120 mM (B) NaCl; mean values ± SE, n = 15.
hkt1–1 Mutation Affects Na+ and K+ Accumulation.
It was shown by Zhu et al. (29) that sos3–1 mutants accumulate marginally more Na+ than wild-type seedlings after 2 days in medium supplemented with NaCl. The Na+ content of sos3–1 hkt1–1 seedlings was less than sos3–1 and wild-type seedlings 2 days after transfer to medium with 100 mM NaCl (Fig. 6A). Suppression of sos3–1 mutant Na+ hypersensitivity by hkt1 mutations visually is absolute at this concentration and time interval. Seedlings of sos3–1 hkt1–1 have greater capacity for K+/Na+ selective accumulation in medium with 100 mM NaCl than either wild-type or sos3–1 seedlings as evidenced by their increased ability to maintain [K+]int at high [Na+]ext (Fig. 6 B and C). Na+ hypersensitivity of sos3–1 seedlings correlates with reduced [K+]int in medium supplemented with NaCl (29). Thus, maintenance of intracellular [K+] in the presence of [Na+]ext in sos3–1 hkt1–1 seedlings is consistent with the suppression of sos3–1 K+-deficient phenotype by the hkt1–1 and hkt1–2 mutations.
Figure 6.
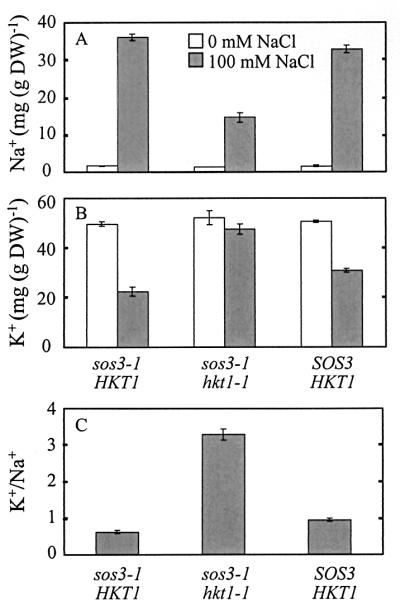
sos3–1 hkt1–1 accumulates less Na+ and maintains intracellular K+ relative to sos3–1 in medium supplemented with NaCl. Col-0 wild-type (SOS3 HKT1) or sos3–1 or sos3–1 hkt1–1 seedlings (3 weeks old) were transferred to liquid medium and grown for 2 days. An aliquot of 5 M NaCl stock solution was then added into the flask to supplement the medium with 100 mM NaCl. An equivalent volume of H2O was added to cultures that were not supplemented with NaCl. Illustrated are the mean values ± SE (n = 3) for Na+ (A) or K+ (B) content as determined by atomic absorption spectrophotometry or for intracellular K+/Na+ ratio calculated from the data in A and B (C). Data from one of two experiments with similar results are shown.
Discussion
AtHKT1 Mediates Na+ Acquisition.
The genetic suppression of sos3–1 NaCl hypersensitivity by hkt1 mutations is consistent with AtHKT1 functioning as an important Na+ influx system, as implicated by the electrophysiological determinations of Uozumi et al. (33). However, a regulatory function for AtHKT1 in Na+ acquisition into plant roots is possible. This conclusion is supported by the fact that hkt1 seedlings accumulate substantially less Na+ than sos3–1 seedlings under salt conditions, where the mutations suppress the NaCl hypersensitive phenotype of the sos3–1 mutant.
In heterologous systems, Arabidopsis AtHKT1 mediates highly selective Na+ and low affinity K+ uptake (33). Electrophysiological data indicate that Na+ does not energize K+ transport through AtHKT1, and Na+ flux is not coupled to K+ or H+ transport. This finding contrasts with the function of wheat HKT1 that mediates high affinity K+ uptake energized by either H+ or Na+ (12). Residues presumed to affect K+ binding in HKT1 are variant in AtHKT1, and these differences may contribute to the unique cation specificities of the wheat and the Arabidopsis proteins (33). HKT1 and AtHKT1 have sequence similarity to the yeast Trk1–2 and bacterial KtrAB transporters (33, 35, 36) that are hypothesized to have evolved from bacterial KcsA-like K+ channels (35). The defining structure is composed of two transmembrane helices (M1 and M2) and an intervening hairpin segment (MPM) that forms the outer portion of the pore and mediates ion selectivity. AtHKT1 has four MPM domains that are interspersed between eight transmembrane-spanning segments and are presumed to form the channel pore (35, 36). Perhaps AtHKT1 has both a channel and a transporter function that facilitates downhill transport of Na+, as well as a H+-energized K+ transport (33).
It is difficult initially to rationalize why the Na+ transport function of AtHKT1 has been retained in glycophytes because, in nonsaline environments, Na+ accumulation is not required for vacuolar expansion and it is not considered generally to be an essential element by nutritional criteria. However, recent evidence that vacuolar pH may be controlled by the Na+/H+ exchange activity of a putative tonoplast antiporter (37, 38) may offer insight about one evolutionary need for intracellular Na+ uptake in the absence of high [Na+]ext (37, 38).
Presumably, AtHKT1 imparts to plants the capacity to control the uptake of Na+ during periods of salt exposure. Strict control of net intracellular Na+ influx is likely essential in environments of high [Na+]ext, as this cation is an osmolyte required for cellular osmotic adjustment but which must be compartmentalized into the vacuole to prevent cytotoxicity. Although Na+ can accumulate in the vacuole to several hundred mM, cytosolic concentrations ≥100 mM are metabolically poisonous (3, 39). Perhaps Na+ is required for the fitness of plants by functioning in another yet undefined process such as mentioned previously in pH control (37, 38). Conditional and nonessential functions of AtHKT1 may be the reason mutations that disrupt the function of the single-copy AtHKT1 gene are not lethal and why it has been retained in glycophytes.
Another Na+ Entry System That Is Inhibited by [Ca2+]ext.
Abrogation of sos3–1 Na+ hypersensitive suppression by hkt1 mutations in medium with low [Ca2+]ext is indicative that another Na+ entry system(s) is operative in plants. Na+ influx seems to be substantially higher at low [Ca2+]ext. However, this or another influx system must function to some extent at high [Ca2+]ext because mutations that inactivate AtHKT1 do not fully suppress the Na+-sensitive phenotype of the sos3–1 mutant, even when the divalent cation is present at mM levels. Perhaps the SOS pathway regulates Na+ permeability of an alternative system(s) and the defective product of the sos3–1 allele does not function adequately at μM [Ca2+]ext but is partially operative at mM [Ca2+]ext. The sos3–1 protein exhibits reduced capacity for binding of Ca2+ and activation of the SOS2 kinase (26). Alternatively, Ca2+ may block directly Na+ influx through an alternative system (10, 11, 14). Evidence from physiological experimentation implicates nonselective cation channels as Ca2+-sensitive Na+ influx systems. Data indicate that about 50% of Na+ permeability is Ca2+-inhibited in maize and wheat protoplasts (10). Furthermore, unidirectional 22Na+ flux measurements have identified two independent Na+ influx systems, one Ca2+-sensitive and one Ca2+-insensitive (P. Essah, R. J. Davenport, and M. Tester, personal communication). Together, these observations seem to implicate AtHKT1 as a Ca2+-insensitive and nonselective cation channels as Ca2+-sensitive Na+ uptake systems. However, it is problematic to conclude from present evidence whether AtHKT1 activity is Ca2+-independent. Experimentally, there is ambiguity in assessing Ca2+ effects on AtHKT1 activity in the presence of a functional Ca2+-inhibited Na+ uptake system. Definitive conclusion will likely arise from experiments in which the Ca2+-dependent uptake is attenuated, i.e., by mutations. It would not be surprising that AtHKT1 activity is controlled in a Ca2+-dependent manner, perhaps through the SOS signal pathway.
hkt1 Mutations Suppress K+ Deficiency of the sos3–1 Mutant.
sos3–1 plants exhibit substantially less growth than wild type on medium with μM levels of K+, indicating that the sos3–1 mutant has a decreased capacity for K+ accumulation at low [K+]ext (Fig. 4, ref. 24). Suppression of the K+-deficient phenotype of the sos3–1 mutant by hkt1 mutations and the fact that sos3–1 hkt1 mutants are characterized by a capacity to maintain intracellular [K+] even in medium with NaCl indicates that AtHKT1 does not mediate high affinity K+ uptake. It is unclear exactly how hkt1 mutations suppress the K+ deficiency of the sos3–1 mutant. However, lower [Na+]int caused by hkt1 mutations is linked to alleviation of K+ deficiency at low [K+]ext resulting from the sos3–1 mutation. This could be a result of [Na+]int directly inhibiting a high affinity K+ transport system. Alternatively, elimination of a cation influx system such as AtHKT1 could result in maintenance of membrane potential that favors higher K+/Na+ selective accumulation through the activity of high affinity K+ transport systems, particularly at lower [Na+]ext (10). The membrane potential not only provides the driving force for cation influx but the highly K+-selective KIRCs have greater conductance when the membrane potential is more polarized. Inclusion of 1 or 20 mM NH in the medium, as in these experiments, should inhibit the activity of the high affinity K+ carrier of the KUP family (34), implicating the involvement of AKT1 or some unidentified K+ transport system. Because another cation influx system is functioning at low [Ca2+]ext and suppression of K+ deficiency by hkt1 mutations is Ca2+-independent, hypotheses that link membrane potential maintenance to K+ uptake may be tenuous unless the alternative influx system has very low affinity for Na+ and the membrane potential is maintained in medium not supplemented with NaCl. Regardless of the biochemical mechanism, by genetic criteria, suppression of sos3–1 K+ deficiency by hkt1 mutations can be interpreted to mean that AtHKT1 negatively regulates high affinity K+ uptake.
It has been long known that [Ca2+]ext can minimize inhibition of K+ acquisition by Na+, presumably through the activation of a high affinity K+ uptake system (17, 18). SOS3 has been implicated as a signaling intermediate between Ca2+ and high affinity K+ uptake through the transduction of a stress-mediated Ca2+ signal that activates increased selectivity of K+ transport (29). SOS3 also regulates, in a Ca2+-dependent manner, the transcriptional activation of the putative plasma membrane Na+/H+ antiporter, SOS1. Thus, Ca2+ facilitation of increased selective accumulation of K+ over Na+ can be linked through the SOS signal pathway to altered K+ uptake and to Na+ efflux. The results herein identify AtHKT1 as an in planta regulator of Na+ influx based on the capacity of hkt1 mutations to suppress Na+ accumulation and hypersensitivity of the sos3–1 mutant. In planta evidence indicates the existence of another Na+ entry system(s) that is inhibited by [Ca2+]ext. Na+ toxicity caused by its entry through this alternative system seems to be unrelated to K+ deficiency because Na+-induced growth reduction of sos3–1 hkt1 mutants at low [Ca2+]ext is only marginally exacerbated by inclusion of 20 μM rather than 20 mM KCl in the medium. Mutations that affect the other Na+ entry system(s) could be identified by screening for improved tolerance to Na+ in the genetic background of sos3–1 hkt1 mutants in medium with low [Ca2+]ext.
Acknowledgments
We thank Drs. Irina Sokolchik and Barbara Damsz, Ms. Wanda Hunter, and Mr. Adam Barb for assistance in this research. We also thank Ms. Terry Kirk for assistance with the atomic absorption spectrophotometer. This work was supported by a Spanish Government Fellowship (to A.R.), Japan Society for the Promotion of Science Japanese Junior Scientist Research Fellowship (to S.Y.), National Institutes of Health Grant R01GM59138 (to J.K.Z.), and National Science Foundation Plant Genome Award DBI-98–13360. This is Purdue University Agricultural Research Program Paper No. 16,611.
Abbreviations
- SOS
salt-overly sensitive
- MS
Murashige and Skoog
References
- 1.Hasegawa P M, Bressan R A, Zhu J-K, Bohnert H J. Annu Rev Plant Physiol Plant Mol Biol. 2000;51:463–499. doi: 10.1146/annurev.arplant.51.1.463. [DOI] [PubMed] [Google Scholar]
- 2.Niu X, Bressan R A, Hasegawa P M, Pardo J-M. Plant Physiol. 1995;109:735–742. doi: 10.1104/pp.109.3.735. [DOI] [PMC free article] [PubMed] [Google Scholar]
- 3.Blumwald E, Aharon G S, Apse M P. Biochim Biophys Acta. 2000;1465:140–151. doi: 10.1016/s0005-2736(00)00135-8. [DOI] [PubMed] [Google Scholar]
- 4.Apse M P, Akaron G S, Snedden W A, Blumwald E. Science. 1999;285:1256–1258. doi: 10.1126/science.285.5431.1256. [DOI] [PubMed] [Google Scholar]
- 5.Gaxiola R A, Rao R, Sherman A, Grisafi P, Alper S L, Fink G R. Proc Natl Acad Sci USA. 1999;96:1480–1485. doi: 10.1073/pnas.96.4.1480. [DOI] [PMC free article] [PubMed] [Google Scholar]
- 6.Quintero F J, Blatt M R, Pardo J-M. FEBS Lett. 2000;471:224–228. doi: 10.1016/s0014-5793(00)01412-5. [DOI] [PubMed] [Google Scholar]
- 7.Shi H, Ishitani M, Kim C-S, Zhu J-K. Proc Natl Acad Sci USA. 2000;97:6896–6901. doi: 10.1073/pnas.120170197. . (First Published May 23, 2000; 10.1073/pnas.120170197) [DOI] [PMC free article] [PubMed] [Google Scholar]
- 8.Blumwald E, Poole R J. Plant Physiol. 1985;78:163–167. doi: 10.1104/pp.78.1.163. [DOI] [PMC free article] [PubMed] [Google Scholar]
- 9.Hassidim M, Braun Y, Lerner H R, Reinhold L. Plant Physiol. 1990;94:1795–1801. doi: 10.1104/pp.94.4.1795. [DOI] [PMC free article] [PubMed] [Google Scholar]
- 10.Amtmann A, Sanders D. Adv Bot Res. 1999;29:75–112. [Google Scholar]
- 11.Maathuis F J M, Amtmann A. Ann Bot (London) 1999;84:123–133. [Google Scholar]
- 12.Schachtman D P. Biochim Biophys Acta. 2000;1465:127–139. doi: 10.1016/s0005-2736(00)00134-6. [DOI] [PubMed] [Google Scholar]
- 13.Amtmann A, Fischer M, Marsh E L, Stefanovic A, Sanders D, Schachtman D P. Plant Physiol. 2001;126:1061–1071. doi: 10.1104/pp.126.3.1061. [DOI] [PMC free article] [PubMed] [Google Scholar]
- 14.Davenport R J, Tester M. Plant Physiol. 2000;122:823–834. doi: 10.1104/pp.122.3.823. [DOI] [PMC free article] [PubMed] [Google Scholar]
- 15.Schachtman D P, Schroeder J I. Nature (London) 1994;370:655–658. doi: 10.1038/370655a0. [DOI] [PubMed] [Google Scholar]
- 16.Schachtman D P, Kumar R, Schroeder J I, Marsh E L. Proc Natl Acad Sci USA. 1997;94:11079–11084. doi: 10.1073/pnas.94.20.11079. [DOI] [PMC free article] [PubMed] [Google Scholar]
- 17.Rains D W, Epstein E. Plant Physiol. 1967;42:314–318. doi: 10.1104/pp.42.3.314. [DOI] [PMC free article] [PubMed] [Google Scholar]
- 18.Maathuis F J M, Verlin D, Smith F A, Sanders D, Fernandez J A, Walker N A. Plant Physiol. 1996;112:1609–1616. doi: 10.1104/pp.112.4.1609. [DOI] [PMC free article] [PubMed] [Google Scholar]
- 19.Läuchli A. In: Calcium in Plant Growth and Development. Leonard R T, Hepler P K, editors. Vol. 4. Rockville, MD: Am. Soc. Plant Physiol.; 1990. pp. 26–35. [Google Scholar]
- 20.Epstein E. Science. 1998;280:1906–1907. doi: 10.1126/science.280.5371.1906. [DOI] [PubMed] [Google Scholar]
- 21.Hasegawa P M, Bressan R A, Pardo J-M. Trends Plant Sci. 2000;5:317–319. doi: 10.1016/s1360-1385(00)01692-7. [DOI] [PubMed] [Google Scholar]
- 22.Sanders D. Curr Biol. 2000;10:486–488. doi: 10.1016/s0960-9822(00)00554-6. [DOI] [PubMed] [Google Scholar]
- 23.Zhu J-K. Trends Plant Sci. 2001;6:66–71. doi: 10.1016/s1360-1385(00)01838-0. [DOI] [PubMed] [Google Scholar]
- 24.Liu J, Zhu J-K. Proc Natl Acad Sci USA. 1997;94:14960–14964. doi: 10.1073/pnas.94.26.14960. [DOI] [PMC free article] [PubMed] [Google Scholar]
- 25.Liu J, Zhu J-K. Science. 1998;280:1943–1945. doi: 10.1126/science.280.5371.1943. [DOI] [PubMed] [Google Scholar]
- 26.Ishitani M, Liu J, Halfter U, Kim C-S, Shi W, Zhu J-K. Plant Cell. 2000;12:1667–1677. doi: 10.1105/tpc.12.9.1667. [DOI] [PMC free article] [PubMed] [Google Scholar]
- 27.Halfter U, Ishitani M, Zhu J-K. Proc Natl Acad Sci USA. 2000;97:3735–3740. doi: 10.1073/pnas.040577697. . (First Published March 21, 2000; 10.1073/pnas.040577697) [DOI] [PMC free article] [PubMed] [Google Scholar]
- 28.Liu J, Ishitani M, Halfter U, Kim C-S, Zhu J-K. Proc Natl Acad Sci USA. 2000;97:3730–3734. doi: 10.1073/pnas.060034197. . (First Published March 21, 2000; 10.1073/pnas.060034197) [DOI] [PMC free article] [PubMed] [Google Scholar]
- 29.Zhu J-K, Liu J, Xiong L. Plant Cell. 1998;10:1181–1191. doi: 10.1105/tpc.10.7.1181. [DOI] [PMC free article] [PubMed] [Google Scholar]
- 30.Weigel D, Ahn J H, Blázquez M A, Borevitz J O, Christensen S K, Fankhauser C, Ferrándiz C, Kardailsky I, Malancharuvil E J, Neff M M, et al. Plant Physiol. 2000;122:1003–1013. doi: 10.1104/pp.122.4.1003. [DOI] [PMC free article] [PubMed] [Google Scholar]
- 31.Murashige T, Skoog F. Physiol Plant. 1962;15:473–497. [Google Scholar]
- 32.Liu Y-G, Mitsukawa N, Oosumi T, Whittier R F. Plant J. 1995;8:457–463. doi: 10.1046/j.1365-313x.1995.08030457.x. [DOI] [PubMed] [Google Scholar]
- 33.Uozumi N, Kim E J, Rubio F, Yamaguchi T, Muto S, Tsuboi A, Bakker E P, Nakamura T, Schroeder J I. Plant Physiol. 2000;122:1249–1259. doi: 10.1104/pp.122.4.1249. [DOI] [PMC free article] [PubMed] [Google Scholar]
- 34.Spalding E P, Hirsch R E, Lewis D R, Qi Z, Sussman M R, Lewis B D. J Gen Physiol. 1999;113:909–918. doi: 10.1085/jgp.113.6.909. [DOI] [PMC free article] [PubMed] [Google Scholar]
- 35.Durell S R, Hao Y, Nakamura T, Bakker E P, Guy H R. Biophys J. 1999;77:775–788. doi: 10.1016/S0006-3495(99)76931-6. [DOI] [PMC free article] [PubMed] [Google Scholar]
- 36.Kato Y, Sakaguchi M, Mori Y, Saito K, Nakamura T, Bakker E P, Sato Y, Goshima S, Uozumi N. Proc Natl Acad Sci USA. 2001;98:6488–6493. doi: 10.1073/pnas.101556598. . (First Published May 8, 2001; 10.1073/pnas.101556598) [DOI] [PMC free article] [PubMed] [Google Scholar]
- 37.Fukada-Tanaka S, Inagaki Y, Yamaguchi T, Saito N, Iida S. Nature (London) 2000;407:581. doi: 10.1038/35036683. [DOI] [PubMed] [Google Scholar]
- 38.Yamaguchi T, Fukada-Tanaka S, Inagaki Y, Saito N, Yonekura-Sakakibara K, Tanaka Y, Kusumi T, Iida S. Plant Cell Physiol. 2001;42:451–461. doi: 10.1093/pcp/pce080. [DOI] [PubMed] [Google Scholar]
- 39.Binzel M L, Dana Hess F, Bressan R A, Hasegawa P M. Plant Physiol. 1988;86:607–614. doi: 10.1104/pp.86.2.607. [DOI] [PMC free article] [PubMed] [Google Scholar]


