Abstract
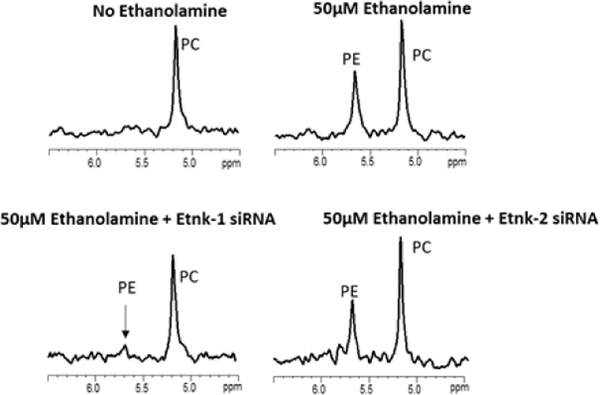
Elevated phosphoethanolamine (PE) is frequently observed in magnetic resonance spectroscopy (MRS) studies of human cancers and xenografts. The role of PE in cell survival and the molecular causes underlying this increase are, however, relatively underexplored. In this study, we investigated the roles of ethanolamine kinases (Etnk-1 and −2) and choline kinases (Chk-α and -β) in contributing to increased PE in human breast and pancreatic cancer cells. We investigated the effect of silencing Etnk-1 and Etnk-2 on cell viability as a potential therapeutic strategy. Both breast and pancreatic cancer cells showed higher PE compared to their nonmalignant counterparts. We identified Etnk-1 as a major cause of the elevated PE levels in these cancer cells, with little or no contribution from Chk-α, Chk-β or Etnk-2. The increase of PE observed in pancreatic cancer cells in culture was replicated in the corresponding tumor xenografts. Downregulation of Etnk-1 with siRNA resulted in cell cytotoxicity that correlated with PE levels in breast and pancreatic cancer cells. Etnk-1 may provide a potential therapeutic target in breast and pancreatic cancers.
Keywords: breast cancer, pancreatic cancer, MR spectroscopy, metabolism, choline kinase, ethanolamine kinase
Graphical Abstract
Ethanolamine kinase-1 (Etnk-1) was identified as a major cause of the elevated PE levels in breast cancer and pancreatic cancer cells. Downregulation of Etnk-1 with siRNA resulted in cell cytotoxicity that correlated with PE levels. Etnk-1 may provide a potential diagnostic and therapeutic target in breast and pancreatic cancers.
Introduction
Although increased phosphoethanolamine (PE) has been observed in tumors almost as consistently as increased phosphocholine (PC) [1–3], understanding the role of PE in cancer is relatively unexplored. The choline (Cho) and ethanolamine (Eth) containing metabolites are major cytosolic precursors and degradation products of phospholipid membrane assembly and catabolism [4]. In most tissues, choline and ethanolamine are primarily incorporated into phospholipids through a pathway involving the formation of CDP-choline and CDP-ethanolamine [4, 5]. Both choline and ethanolamine are essential nutrients that are derived from the diet. Mammalian plasma concentrations of ~10 μM choline and ~5–50 μM ethanolamine have been reported [6, 7]. These metabolites are transported within cells through either common or separate transmembrane transporters [8, 9]. In addition, phosphatidylethanolamine (PtdE) may be converted to phosphatidylcholine (PtdCho) in tissues such as the brain, by a series of methylation reactions utilizing S-adenosyl-methionine [10].
The choline and ethanolamine kinases catalyze the first step of the Kennedy pathway, which is the ATP-dependent phosphorylation of choline or ethanolamine, forming PC or PE, respectively, and the byproduct ADP. The three known isoforms of Chk, Chk-α1, Chk-α2 and Chk-β, found in mammalian cells, are encoded by two separate genes (Chk-α and Chk-β). Chk-α and Chk-β are active as homo- or heterodimers. Chk can phosphorylate choline or ethanolamine [11]. Mammalian cells also carry two ethanolamine-specific kinases: Etnk-1 and Etnk-2 that have negligible Chk activity [12]. Although the activities of Chk-α, Chk-β and Etnk-1 have been investigated in cell-free systems [11, 13, 14], the exact role of these kinases in cells at physiological concentrations of ethanolamine is relatively unknown. Moreover, the effect of altering these kinases on the stoichiometry of the metabolites is also unexplored.
The aberrant choline metabolism of cancers occurs, in large part, due to increased expression of ChK-α, an enzyme that has been associated with malignant transformation and an aggressive phenotype [8]. Since Chk-α converts choline to PC, the increase of Chk-α results in increased levels of PC and total choline (sum of PC, glycerophosphocholine, and free choline) in intact cells and tumors as observed with 1H magnetic resonance spectroscopy (MRS) [8, 15]. While cells in culture and tumors show increased PC, an increased signal from PE is only observed in tumors but not from cancer cells in culture. This is because while mammalian plasma contains both choline (~10 μM) and ethanolamine (~5–50 μM) [6, 7], most culture media only contain choline (~ 1–20 μM).
There is significant interest in developing Cho- and Eth-containing metabolites as diagnostic and prognostic biomarkers, and in evaluating enzymes in phospholipid metabolism as therapeutic targets because of their role in cellular proliferation, apoptosis, and resistance [16–20]. To understand the molecular causes underlying the increased PE in tumors, here we investigated the role of Chk-α, Cho-β, Etnk-1 and Etnk-2 in contributing to the increased PE observed in breast and pancreatic cancer cells. We used 31P MRS to resolve the phosphomonoesters PC and PE and phosphodiesters glycerophosphocholine (GPC) and glycerophosphoethanolamine (GPE). We also investigated the effect of downregulating these enzymes on the viability of cancer cells. Our data support developing MRS and PET imaging approaches to detect PE and Etnk expression in tumors as biomarkers for detecting cancer, and identify Etnk-1 as a therapeutic target.
Materials and Methods
Cell culture and siRNA transfection:
MDA-MB-231 breast cancer cells were cultured in RPMI-1640 medium containing 21 μM choline supplemented with 10% FBS and 50μm ethanolamine. Nonmalignant MCF-12A human mammary epithelial cells were grown in DMEM-Ham’s F12 medium containing 64 μM choline further supplemented with 50 μm ethanolamine. Panc-1, Pa02C, and Pa04C human pancreatic cancer cells were cultured in DMEM containing 28 μm choline and 50 μm ethanolamine. For comparison, we used human pancreatic nestin-expressing (HPNE) cells from ATCC (ATCC, Manassas, VA). HPNE cells are non-neoplastic human pancreatic cells retrovirally transduced with the human telomerase reverse transcriptase (hTERT) gene to stably express hTERT. HPNE cells were cultured according to the manufacturer’s protocol with medium that contained 28 μM choline, supplemented with 50 μm ethanolamine. Isoform-specific siRNAs were custom designed using Thermo Scientific siRNA design center (Thermo Scientific, Rockford, IL). Accession numbers NM_001277.2 for Chk-α, NM_005198.4 for Chk-β, NM_018638 for Etnk-1, and NM_018208.3 for Etnk-2 were used to design specific siRNA. While 50 nM siRNA was used in individual siRNA treatments, for combined siRNA treatment 50 nM of each specific siRNA was used. Cells were transfected with siRNA for 24 h and cell extraction was performed 48 h post siRNA treatment.
High-resolution 31P MR spectroscopy:
Approximately 40 million cells were harvested for cell extracts. To obtain pancreatic tumor extracts, subcutaneous tumors were generated by inoculating 2 × 10⁶ cells suspended in 0.05 ml of Hanks balanced salt solution in the flank of severe combined immunodeficient (SCID) male mice. Tumor or cell extracts were prepared using a dual-phase extraction method based on methanol/chloroform/water (1/1/1; v/v/v) [17]. Water soluble fractions were collected, lyophilized, and dissolved in 0.6 ml deuterated water containing phenyl phosphonic acid that served as a concentration standard as well as a chemical shift reference. 31P MR spectra were acquired on a Bruker 11.7T NMR spectrometer (Bruker BioSpin Corp., Billerica, MA) using a 450 pulse, 1s repetition time, 2000 averages and composite pulse proton decoupling. Integrals of metabolite resonance profiles were determined to estimate their absolute concentration relative to phenyl phosphonic acid using TopSpin 3.2 (Bruker BioSpin Corp., Billerica, MA). The areas under the curves were corrected for potential saturation effects. Lipid fractions were dried under nitrogen gas and dissolved in 0.5 ml CDCl3+ CD3OD (2:1 v/v) containing tetramethylsilane as the reference standard. Fully relaxed 1H MR spectra of lipids extracts were acquired with the following acquisition parameters: 60° flip angle, repetition time of 10 s and 32 averages. 1H signal from the -N+(CH3)3 trimethylamine moiety at 3.2 ppm was used to estimate PtdE in arbitrary units (AU).
Cell viability assay:
To assay cell viability, 4000 cells per well were plated in a 96 well plate and transfected with siRNA. Cell viability was assessed 96 h post transfection using a CCK-8 kit (Dojindo Molecular Technologies, Rockville, MD).
Quantitative PCR:
Total RNA was isolated from cells 24h post transfection using QIAshredder and RNeasy Mini kit (Qiagen) as per the manufacturer’s protocol. cDNA was prepared using the iScript cDNA synthesis kit (Bio-Rad, Hercules, CA). cDNA samples were diluted 1:10 and real-time PCR was performed using IQ SYBR Green Supermix and gene specific primers in the iCycler real-time PCR detection system (Bio-Rad). All primers were designed using Beacon Designer software 7.8 (Premier Biosoft, USA). The expression of target RNA relative to the housekeeping gene HPRT1 for breast cancer cells or 18S ribosomal RNA for pancreatic cells was calculated based on the threshold cycle (Ct) as R = 2−Δ(ΔCt), where ΔCt = Ct of target gene− Ct of HPRT1 or 18s ribosomal RNA.
Immunoblot analyses:
Whole-cell extracts were prepared by lysing cells with RIPA lysis buffer supplemented with a protease inhibitor cocktail (Sigma-Aldrich, St Louis, MO, USA). Protein concentration was estimated using the Bradford Bio-Rad protein assay kit (Bio-Rad). Total cellular protein was resolved on SDS-PAGE. Immunoblotting using a custom-designed Chk-α antibody was performed as previously described [21].
Statistical Analysis:
Statistical significance was evaluated using an unpaired Student’s t-test. P-values ≤ 0.05 were considered statistically significant unless otherwise stated.
Results
ChK-α but not Chk-β forms PC, and Etnk-1 but not Etnk-2 forms PE:
Representative 31P MR expanded spectra obtained from MDA-MB-231 cells treated with different combinations of siRNA without or with 50 μM ethanolamine in the culture medium are shown in Figures 1A-H. The corresponding quantitative changes in PC and PE levels are presented in Figure 1I (n=3–7). PE was not detected when cell culture medium was not supplemented with ethanolamine but increased once the medium was supplemented with ethanolamine. Downregulation of Chk-α resulted in a significant decrease of PC but not PE. Silencing of Chk-β, however, did not decrease PC or PE. These results indicate that Chk-β does not form either PC or PE in these human breast cancer cells. Combined treatment with Chk-α and Chk-β siRNA decreased PC levels but not as much as Chk-α siRNA alone. PE levels were unaffected by combined Chk-α and Chk-β siRNA treatment.
Figure 1:
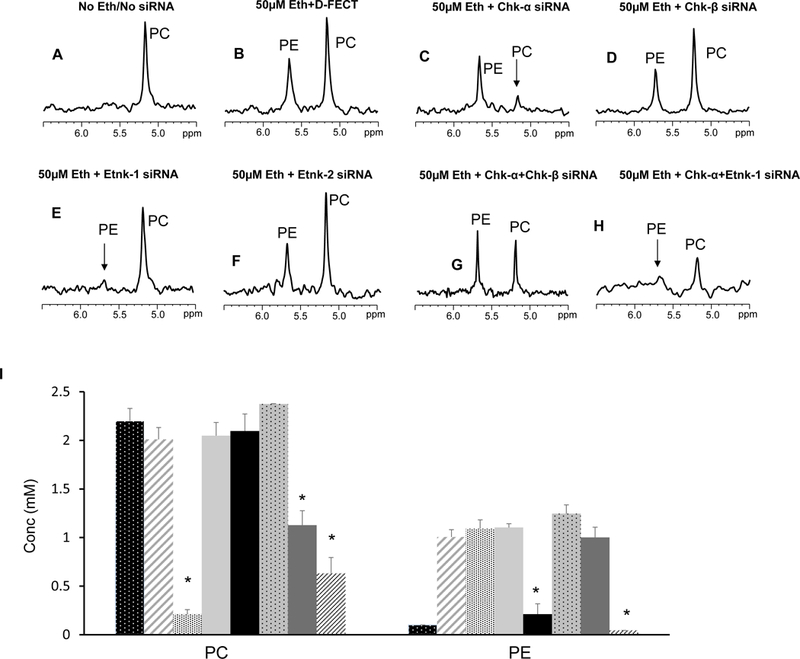
Representative 31P MR spectra showing expanded regions of PC and PE metabolites from cell extracts of (A) untreated MDA-MB-231 cells, (B) cells treated with 50 μM ethanolamine+D-FECT, (C) cells treated with 50 μM ethanolamine and Chk-α siRNA, (D) cells treated with 50 μM ethanolamine and Chk-β siRNA, (E) cells treated with 50 μM ethanolamine and Etnk-1 siRNA, (F) cells treated with 50 μM ethanolamine and Etnk-2 siRNA, (G) cells treated with 50 μM ethanolamine and Chk-α + Chk- β siRNA, and (H) cells treated with cells treated with 50 μM ethanolamine and Chk-α and Etnk-1 siRNA. (I) Quantitative PC and PE values obtained from 31P MR spectra obtained from MDA-MB-231 cell lines. (* represents p < 0.05 compared to treatment with D-FECT. Values represent Mean + SEM. No treatment/No siRNA ( , n=5); D-FECT+50μM Ethanolamine (
 ,n=7 ); 50μM Ethanolamine+Chk-α siRNA (
 ,n=4); 50μM Ethanolamine+Chk-β siRNA (
 , n=3); 50μM Ethanolamine+Etnk-1 siRNA (
 , n=4); 50μM Ethanolamine+Etnk-2 siRNA (
 , n=3); 50μM Ethanolamine+Chk-α+Chk-β siRNA (
 , n=4); 50μM Ethanolamine+Chk-α+Etnk-1 siRNA (
 , n=4).
When ethanolamine was present in the medium, cells treated with Etnk-1 siRNA showed a significant reduction in PE levels. Treatment with Etnk-2 siRNA, however, did not affect PE levels in these cells. These results indicate that Etnk-1, but not Etnk-2, forms PE in these cells. PtdE levels estimated from 1H spectra of lipid fractions remained unaltered following Etnk-1 silencing (data not shown).
Nonmalignant MCF-12A and malignant MDA-MB-231 mammary epithelial cells have different PE and PC levels and different cell viability responses to siRNA treatment:
Representative 31P MRS spectra from nonmalignant MCF-12A and malignant MDA-MB-231 cells in medium supplemented with 50 μM ethanolamine are shown in Figure 2A. Quantitative estimates of PC and PE in these cells shown in Figure 2B (n=5), demonstrate that nonmalignant MCF-12A cells had significantly lower levels of PC and PE compared to malignant MDA-MB-231 cells.
Figure 2:
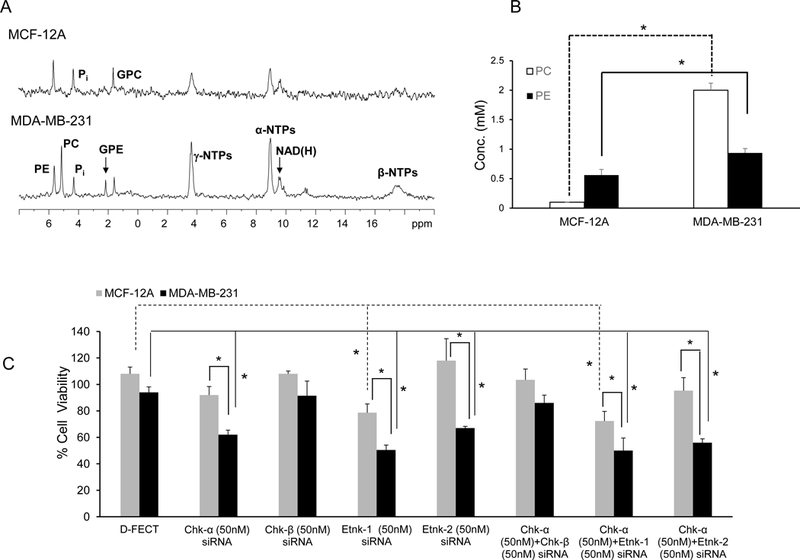
(A) Representative 31P MR spectra from nonmalignant MCF-12A and malignant MDA-MB-231 cell extracts. (B) Quantitative data showing differences in basal PC ( ) and PE (
 ) levels in water soluble extracts of MCF-12A and MDA-MB-231 cells; (n=5, * p <0.05). (C) Changes in cell viability in MCF-12A (
 ) and MDA-MB-231 (
 )breast cancer cells following 96h post treatment with D-FECT and various combinations of siRNA treatment, (* p <0.05 compared to treatment with D-FECT). Values represent Mean + SEM. D-FECT+50μM Ethanolamine (n=9 for MCF-12A cells, n=7 for MDA-MB-231 cells); 50μM Ethanolamine+Chk-α siRNA (n=7 for MCF-12A and MDA-MB-231 cells); 50μM Ethanolamine+Chk-β siRNA (n=3 for MCF-12A cells, n=4 for MDA-MB-231 cells); 50μM Ethanolamine+Etnk-1 siRNA (n=5 for MCF-12A cells, n=7 for MDA-MB-231 cells); 50μM Ethanolamine+Etnk-2 siRNA (n=3 for MCF-12A and MDA-MB-231 cells); 50μM Ethanolamine+Chk-α+Chk-β siRNA (n=3 for MCF-12A, n=4 for MDA-MB-231); 50μM Ethanolamine+Chk-α+Etnk-1 siRNA (n=5 for MCF-12A cells, n=9 for MDA-MB-231 cells), 50μM Ethanolamine+Chk-α+Etnk-2 siRNA (n=3 for MCF-12A and MDA-MB-231 cells).
Treatment with Chk-α siRNA resulted in a significant decrease of cell viability in MDA-MB-231 cells compared to DharmaFECT (D-FECT) treated cells but not in MCF-12A cells (Figure 2C, n=3–9). Treatment with Etnk-1 siRNA resulted in a significant decrease of cell viability in MCF-12A and MDA-MB-231 cells compared to D-FECT treated cells, but the decrease of cell viability in the cancer cells was more significant than the decrease of cell viability in the nonmalignant cells. Treatment of MDA-MB-231 cells with Etnk-2 significantly reduced cell viability in MDA-MB-231 cells compared to D-FECT treated cells but had no effect on the viability of MCF-12A cells. Treatment of MCF-12A and MDA-MB-231 cells with combined Chk-α and Chk-β siRNA did not affect cell viability. Treatment of either MCF-12A or MDA-MB-231 cells with combined Chk-α and Etnk-1 siRNA resulted in cell viabilities comparable to Etnk-1 siRNA treatment alone suggesting that the single siRNA treatment was as effective as the combined siRNA treatment. Cell viabilities were not affected by the presence or absence of ethanolamine in the medium. Cell growth measured in the presence or absence of ethanolamine was not significantly different (Supplementary Data, Figure S1).
Changes in mRNA and protein confirm downregulation of target following siRNA treatment:
Message levels of Chk-α, Chk-β, and Etnk-1 with the different siRNA treatments are shown in Figure 3A (n=3) and demonstrate effective downregulation of message following treatment with the corresponding siRNA. Changes in mRNA were confirmed by the downregulation of protein expression as shown for Chk-α in the representative immunoblot in Figure 3B.
Figure 3:
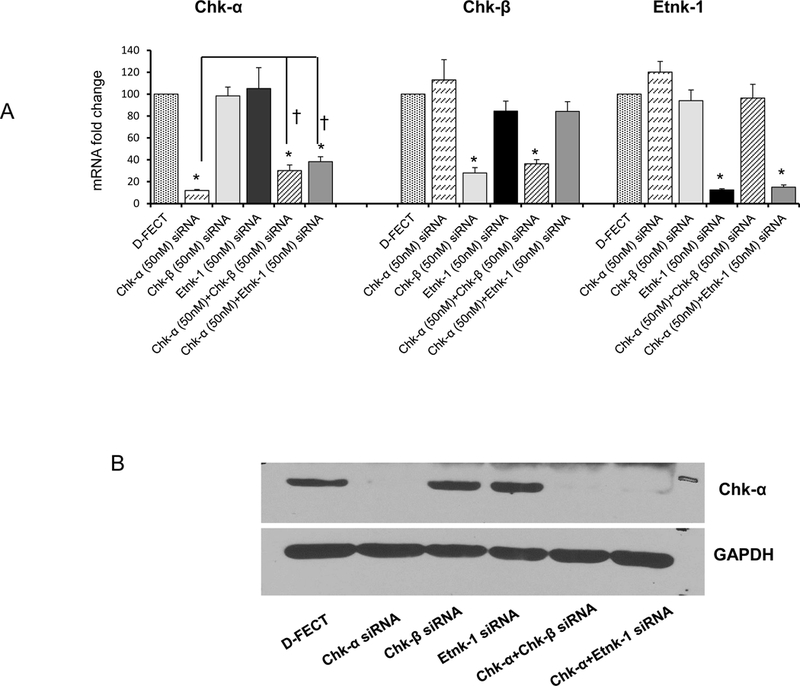
(A) Changes in mRNA levels of Chk-α, Chk-β and Etnk-1 following treatment with a various combinations of siRNA (n=3, * p < 0.05 vs D-FECT, † p < 0.05 Chk-α vs Chk-α+Chk-β and Chk-α+Etnk-1. (B) Immunoblots showing Chk-α protein expression levels following various siRNA treatments; GAPDH was used as a loading control. Values represent Mean + SEM.
PE and PC levels in nonmalignant and malignant pancreatic cancer cells and pancreatic cancer xenografts:
Representative 31P MR spectra obtained from nonmalignant HPNE pancreatic cells and human pancreatic cancer cells are displayed in Figure 4A. Compared to nonmalignant cells, pancreatic cancer cells showed significantly higher PC; PE was significantly higher than HPNE cells in two of the three pancreatic cancer cell lines investigated (Figure 4B, n=4). The patterns of PE levels in the cells were reflected in the Etnk-1 mRNA levels in these cells (Figure 4C, n=4), confirming that increased Etnk-1 was the primary cause of increased PE in these cells.
Figure 4:
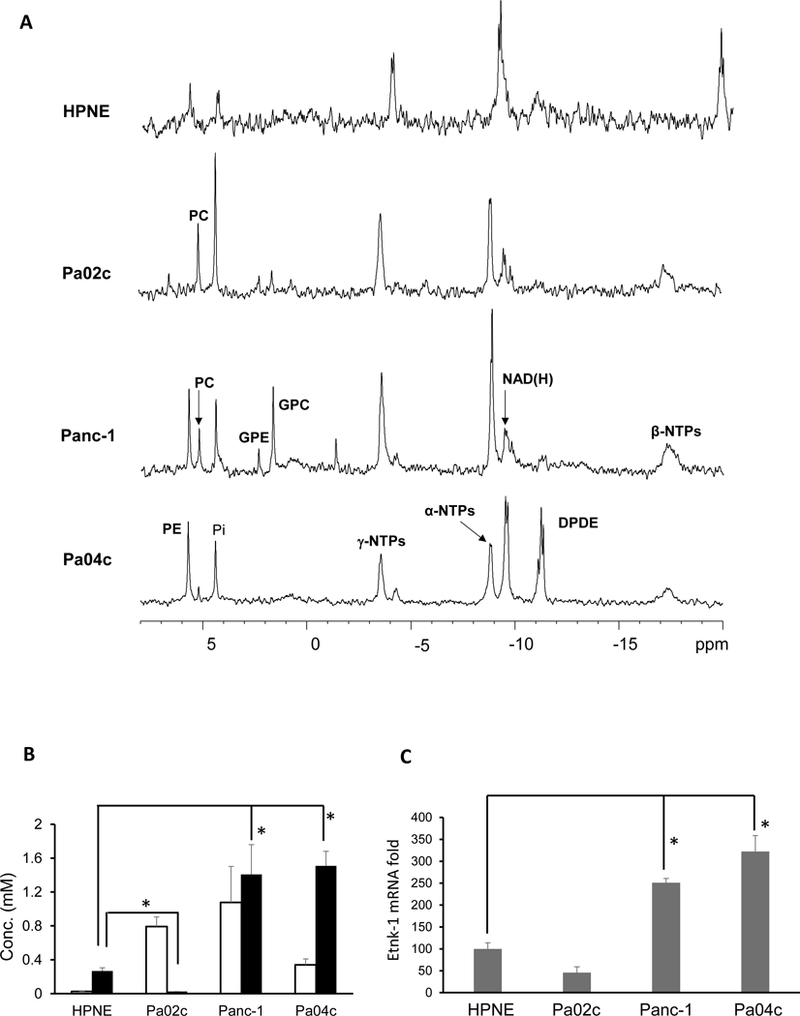
(A) Representative 31P MR spectra obtained from water-soluble extracts of nonmalignant HPNE and malignant Pa04C, Panc-1 and Pa02c human pancreatic cancer cell lines. (B) Quantitative estimates of PC and PE obtained from pancreatic cell lines. (C) ΔCt cycles of Etnk-1 relative to 18s rRNA obtained from qPCR data on different pancreatic cell lines, (n=4, * p < 0.05). Values represent Mean + SEM.
The pattern of PE levels observed in the cancer cells was mostly reflected in tumor xenografts derived from these cells as shown in the representative 31P MR spectra in Figure 5A, and the quantitative estimates in Figure 5B (n=3). Interestingly, unlike the almost undetectable levels of PE in Pa02c cells, Pa02c xenografts contained PE levels comparable to PC levels.
Figure 5:
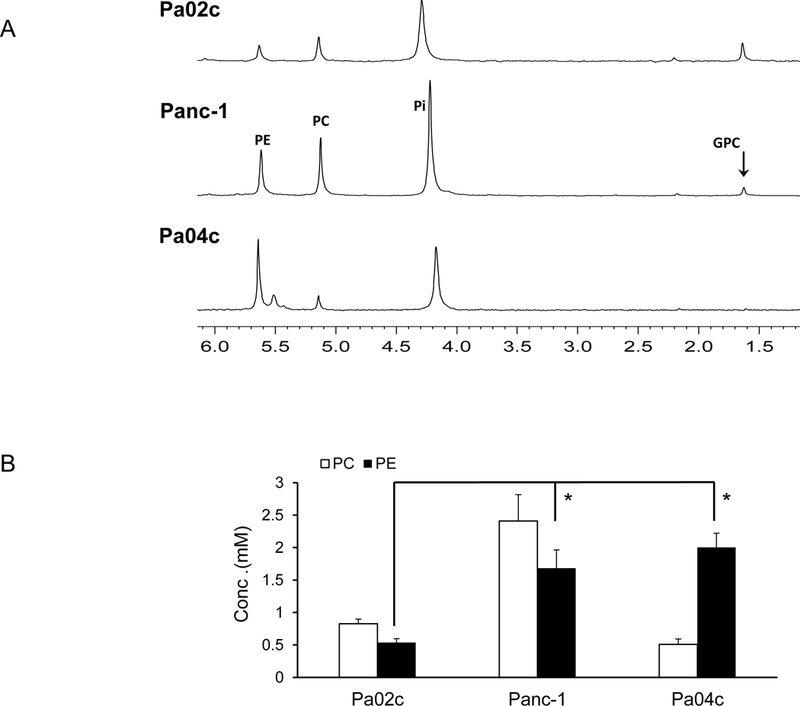
(A) Representative 31P MR spectra expanded to display the PC, PE, GPC and GPE containing region obtained from water-soluble extracts of pancreatic cancer xenografts. (B) Quantitative estimates of PC and PE values obtained from the 31P MR spectra of water soluble tumor extracts, (n=3, * p <0.05). Values represent Mean + SEM.
Etnk-1 downregulation reduces cell viability:
Pancreatic cells in culture displayed reduction of cell viability following downregulation of Etnk-1 that correlated with PE levels. Data presented in Figures 6A-D (n=4) demonstrate the significant reduction of cell viability in Panc-1 and Pa04c pancreatic cells following treatment with Chk-α or Etnk-1 siRNA (p<0.05).
Figure 6:
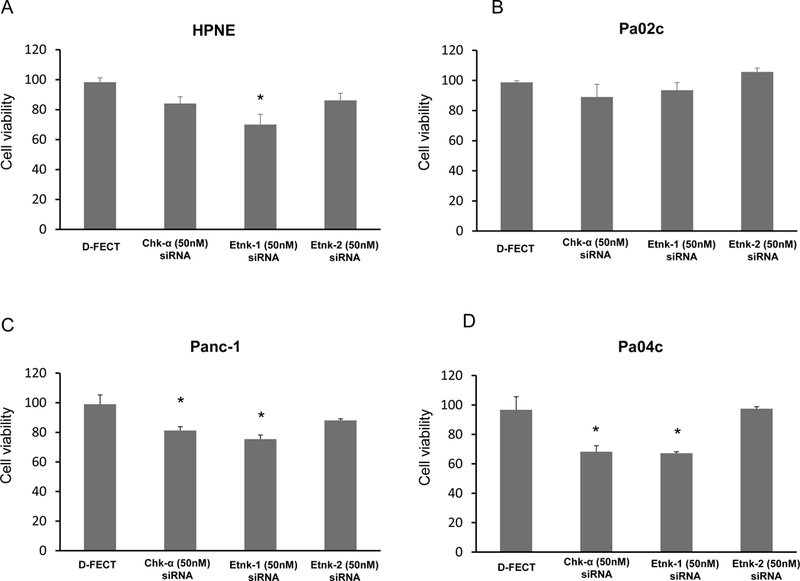
Changes in nonmalignant and malignant pancreatic cell viability obtained 96h post-transfection with various siRNA treatments compared to treatment with D-FECT, (n=4, * p <0.05).
GPE and GPC levels are not closely associated with differences in PE and PC levels:
Since PE and PC are precursors for PtdE and PtdCho, and GPE and GPC are formed from the breakdown of PtdE and PtdCho, we also investigated the association between PE and GPE, and the association between PC and GPC, in treated and untreated cells. There was, however, no correlation between these metabolites in untreated and siRNA treated conditions.
Discussion
Our studies identified increased PE as well as PC levels in breast and pancreatic cancer cells. We identified increased Etnk-1 as the primary cause of increased PE in cancer cells. Consistent with earlier observations [22, 23], Chk-α was identified as the primary cause of increased PC in cancer cells. Chk-β or Etnk-2 did not contribute to cellular PC and PE levels at physiological levels of choline and ethanolamine, respectively. Ethanolamine has been observed to be a substrate for Chk-α as well as Chk-β in cell-free systems [11]. Consistent with earlier studies, downregulation of Chk-α resulted in a significant decrease of cell viability in cancer cells in the current study [24, 25]. Here, for the first time, we demonstrated that downregulation of Etnk-1 resulted in a decrease of cell viability that correlated with PE levels in breast and pancreatic cancer cells.
The role of Chk-α in cell transformation and human carcinogenesis is well documented [11, 26]. Overexpression of Chk-α was sufficient to induce tumor growth in immunosuppressed mice. By contrast, cells overexpressing Chk-β were not able to induce tumor growth under similar conditions [11]. Gene disruption of ChK-α in mice caused embryonic lethality, highlighting the importance of Chk-α for development [27]. Chk-β knockout mice on the other hand showed normal PC levels in most tissues analyzed except in hind limb skeletal muscle [28]. Therefore, Chk-α is sufficient to maintain normal PC levels in most tissues. Furthermore, the attenuated PE levels in Chk-α+/− heterozygous mice indicate that Chk-α has, to some extent, ethanolamine kinase activity in vivo [27].
Etnk-1 and Etnk-2 are the two mammalian enzymes involved in the CDP-ethanolamine pathway that converts ethanolamine to phosphoethanolamine. Etnk-1 and Etnk-2 are specific to ethanolamine and have no specificity to choline as substrate [12, 29]. Etnk-2 is highly expressed in the liver and reproductive tissues. Livers of Etnk2_/_ animals were deficient in Etnk activity, identifying Etnk-2 as the major enzyme responsible for ethanolamine phosphorylation in this tissue [12]. Our data indicate that Etnk-2 does not play a role in contributing to PE levels in breast and pancreatic cancer cells.
Our correlation analysis did not reveal an association between PC or PE levels and levels of GPC or GPE in untreated cells or in cells with Chk-α and Etnk-1 downregulated that had a profound decrease of PC and PE. PtdCho and PtdE are the two most abundant phospholipid species in eukaryotic cells. Both PtdCho and PtdE have multiple roles including membrane integrity, second messenger, and cell cycle progression [5, 8]. PtdCho, the most abundant phospholipid in eukaryotic cell membranes, can generate second messengers and mitogens, such as diacylglycerol, phosphatidic acid. Phosphatidic acid represents an important step for the synthesis of all the phospholipids. PtdE is a major phospholipid in eukaryotes and prokaryotes. PtdE is exposed on the cell surface at the cleavage furrow during cytokinesis [30]. Treatment of cells with Etnk-1 siRNA did not significantly alter PtdE in cells. These results are similar to those obtained with Chk-α siRNA treatment that did not alter PtdCho in breast cancer cells [21]. Similarly, overexpression of Etnk-1 in cells increased ethanolamine uptake but did not result in an increase of total PtdE [29].
The significant reduction of cell viability with Etnk-1 siRNA treatment in breast and pancreatic cancer cells together with the significant decrease of PE suggest that Etnk-1 is essential for PE synthesis. Cancer cells in culture, however, proliferate and show aggressive phenotypic characteristics even though most media are depleted of ethanolamine. Therefore, PE does not appear to be essential for cancer cell function. Etnk-1 downregulation significantly affected cell viability in most of the cancer cells investigated, suggesting that functional roles of Etnk-1 other than its catalytic role in synthesizing PE reduced cell viability; Etnk-2 downregulation reduced cell viability but only in MDA-MB-231 cells. Similar findings were made in breast cancer cells with a Chk-α inhibitor that affected the catalytic domain of Chk-α, significantly reducing PC, but showed no effect on cell viability [31]. Downregulation of Chk-α with siRNA, in contrast, significantly reduced cell viability [24]. While the effect of Chk-α on reducing cancer cell viability has been previously demonstrated for breast cancer cells [18, 24], here for the first time we observed this effect in pancreatic cancer cells. Essential non-catalytic roles of protein kinases that include scaffolding of protein complexes, competitive protein interactions, allosteric effects on other enzymes, subcellular targeting, and DNA binding are increasingly being identified [32]. PE levels may be used as a surrogate marker to identify cells likely to respond to Etnk-1 downregulation.
The lack of a greater reduction in cell viability with combined Chk-α and Etnk-1 siRNA treatment suggests that downregulation of these enzymes may reduce cell viability through a common pathway.
Our data suggest that increased Etnk-1 expression and PE in cancer cells may be incorporated into PET and MRS approaches for cancer detection. Increased trapping of radiolabeled ethanolamine in cells has been correlated with proliferation status of cells [33]. Ethanolamine uptake has been shown to be 2–7 fold higher than choline uptake in various cancer cell lines, suggesting that radiolabeled ethanolamine for PET imaging could provide an alternative to radiolabeled choline [33]. A higher expression of Etnk-1 in cancer cells would allow the development of an ethanolamine radiotracer analogous to 11C-choline to detect cancer [34]. The feasibility of performing 31P MRS to detect PE and PC was recently demonstrated in a breast imaging study [35]. Our studies have identified increased Etnk-1 and PE in cancer cells as potential targets for detection and therapy that merit further investigation.
Supplementary Material
Acknowledgement:
This work was supported by NIH R35CA209960, R01CA82337 and NIH P30CA06973.
Abbreviations:
- Chk
choline kinase
- D-FECT
DharmaFECT
- Etnk
ethanolamine kinase
- GPC
glycerophosphocholine
- GPE
glycerophosphoethanolamine
- hTERT
human telomerase reverse transcriptase
- PC
phosphocholine
- PE
phosphoethanolamine
- PtdCho
phosphatidylcholine
- PtdE
phosphatidylethanolamine
References
- 1.Kinoshita Y & Yokota A Absolute concentrations of metabolites in human brain tumors using in vitro proton magnetic resonance spectroscopy, NMR Biomed 1997; 10: 2–12. [DOI] [PubMed] [Google Scholar]
- 2.Verma A, Kumar I, Verma N, Aggarwal P & Ojha R Magnetic resonance spectroscopy - Revisiting the biochemical and molecular milieu of brain tumors, BBA Clin 2016; 5: 170–8. [DOI] [PMC free article] [PubMed] [Google Scholar]
- 3.Zhu L & Bakovic M Breast cancer cells adapt to metabolic stress by increasing ethanolamine phospholipid synthesis and CTP:ethanolaminephosphate cytidylyltransferase-Pcyt2 activity, Biochem Cell Biol 2012; 90: 188–99. [DOI] [PubMed] [Google Scholar]
- 4.Podo F & de Certaines JD Magnetic resonance spectroscopy in cancer: phospholipid, neutral lipid and lipoprotein metabolism and function, Anticancer Res 1996; 16: 1305–15. [PubMed] [Google Scholar]
- 5.Vance JE & Vance DE Phospholipid biosynthesis in mammalian cells, Biochem Cell Biol 2004; 82: 113–28. [DOI] [PubMed] [Google Scholar]
- 6.Lipton BA, Davidson EP, Ginsberg BH & Yorek MA Ethanolamine metabolism in cultured bovine aortic endothelial cells, J Biol Chem 1990; 265: 7195–201. [PubMed] [Google Scholar]
- 7.Zeisel SH Choline: an essential nutrient for humans, Nutrition 2000; 16: 669–71. [DOI] [PubMed] [Google Scholar]
- 8.Glunde K, Bhujwalla ZM & Ronen SM Choline metabolism in malignant transformation, Nat Rev Cancer 2011; 11: 835–48. [DOI] [PMC free article] [PubMed] [Google Scholar]
- 9.Lipton BA, Yorek MA & Ginsberg BH Ethanolamine and choline transport in cultured bovine aortic endothelial cells, J Cell Physiol 1988; 137: 571–6. [DOI] [PubMed] [Google Scholar]
- 10.Blusztajn JK, Zeisel SH & Wurtman RJ Synthesis of lecithin (phosphatidylcholine) from phosphatidylethanolamine in bovine brain, Brain Res 1979; 179: 319–27. [DOI] [PubMed] [Google Scholar]
- 11.Gallego-Ortega D, Ramirez de Molina A, Ramos MA, Valdes-Mora F, Barderas MG, Sarmentero-Estrada J & Lacal JC Differential role of human choline kinase alpha and beta enzymes in lipid metabolism: implications in cancer onset and treatment, PLoS One 2009; 4: e7819. [DOI] [PMC free article] [PubMed] [Google Scholar]
- 12.Tian Y, Jackson P, Gunter C, Wang J, Rock CO & Jackowski S Placental thrombosis and spontaneous fetal death in mice deficient in ethanolamine kinase 2, J Biol Chem 2006; 281: 28438–49. [DOI] [PubMed] [Google Scholar]
- 13.Yorek MA, Dunlap JA, Spector AA & Ginsberg BH Effect of ethanolamine on choline uptake and incorporation into phosphatidylcholine in human Y79 retinoblastoma cells, J Lipid Res 1986; 27: 1205–13. [PubMed] [Google Scholar]
- 14.Brophy PJ, Choy PC, Toone JR & Vance DE Choline kinase and ethanolamine kinase are separate, soluble enzymes in rat liver, Eur J Biochem 1977; 78: 491–5. [DOI] [PubMed] [Google Scholar]
- 15.Shah T, Wildes F, Penet MF, Winnard PT Jr., Glunde K, Artemov D, Ackerstaff E, Gimi B, Kakkad S, Raman V & Bhujwalla ZM Choline kinase overexpression increases invasiveness and drug resistance of human breast cancer cells, NMR Biomed 2010; 23: 633–42. [DOI] [PMC free article] [PubMed] [Google Scholar]
- 16.Glunde K, Jie C & Bhujwalla ZM Molecular causes of the aberrant choline phospholipid metabolism in breast cancer, Cancer Res 2004; 64: 4270–6. [DOI] [PubMed] [Google Scholar]
- 17.Glunde K, Shah T, Winnard PT Jr., Raman V, Takagi T, Vesuna F, Artemov D & Bhujwalla ZM Hypoxia regulates choline kinase expression through hypoxia-inducible factor-1 alpha signaling in a human prostate cancer model, Cancer Res 2008; 68: 172–80. [DOI] [PMC free article] [PubMed] [Google Scholar]
- 18.Gruber J, See Too WC, Wong MT, Lavie A, McSorley T & Konrad M Balance of human choline kinase isoforms is critical for cell cycle regulation: implications for the development of choline kinase-targeted cancer therapy, Febs J 2012; 279: 1915–28. [DOI] [PubMed] [Google Scholar]
- 19.Ramirez de Molina A, Gallego-Ortega D, Sarmentero-Estrada J, Lagares D, Gomez Del Pulgar T, Bandres E, Garcia-Foncillas J & Lacal JC Choline kinase as a link connecting phospholipid metabolism and cell cycle regulation: implications in cancer therapy, Int J Biochem Cell Biol 2008; 40: 1753–63. [DOI] [PubMed] [Google Scholar]
- 20.Shah T, Wildes F, Penet MF, Winnard PT Jr., Glunde K, Artemov D, Ackerstaff E, Gimi B, Kakkad S, Raman V & Bhujwalla ZM Choline kinase overexpression increases invasiveness and drug resistance of human breast cancer cells, NMR Biomed 2010; 23: 633–42. [DOI] [PMC free article] [PubMed] [Google Scholar]
- 21.Glunde K, Raman V, Mori N & Bhujwalla ZM RNA interference-mediated choline kinase suppression in breast cancer cells induces differentiation and reduces proliferation, Cancer Res 2005; 65: 11034–43. [DOI] [PubMed] [Google Scholar]
- 22.Penet MF, Shah T, Bharti S, Krishnamachary B, Artemov D, Mironchik Y, Wildes F, Maitra A & Bhujwalla ZM Metabolic imaging of pancreatic ductal adenocarcinoma detects altered choline metabolism, Clin Cancer Res 2015; 21: 386–95. [DOI] [PMC free article] [PubMed] [Google Scholar]
- 23.Ramirez de Molina A, Rodriguez-Gonzalez A, Gutierrez R, Martinez-Pineiro L, Sanchez J, Bonilla F, Rosell R & Lacal J Overexpression of choline kinase is a frequent feature in human tumor-derived cell lines and in lung, prostate, and colorectal human cancers, Biochem Biophys Res Commun 2002; 296: 580–3. [DOI] [PubMed] [Google Scholar]
- 24.Mori N, Glunde K, Takagi T, Raman V & Bhujwalla ZM Choline kinase down-regulation increases the effect of 5-fluorouracil in breast cancer cells, Cancer Res 2007; 67: 11284–90. [DOI] [PubMed] [Google Scholar]
- 25.Gruber J, See Too WC, Wong MT, Lavie A, McSorley T & Konrad M Balance of human choline kinase isoforms is critical for cell cycle regulation: implications for the development of choline kinase-targeted cancer therapy, Febs J 2012; 279: 1915–28. [DOI] [PubMed] [Google Scholar]
- 26.Ramirez de Molina A, Gallego-Ortega D, Sarmentero J, Banez-Coronel M, Martin-Cantalejo Y & Lacal JC Choline kinase is a novel oncogene that potentiates RhoA-induced carcinogenesis, Cancer Res 2005; 65: 5647–53. [DOI] [PubMed] [Google Scholar]
- 27.Wu G, Aoyama C, Young SG & Vance DE Early embryonic lethality caused by disruption of the gene for choline kinase alpha, the first enzyme in phosphatidylcholine biosynthesis, J Biol Chem 2008; 283: 1456–62. [DOI] [PMC free article] [PubMed] [Google Scholar]
- 28.Sher RB, Aoyama C, Huebsch KA, Ji S, Kerner J, Yang Y, Frankel WN, Hoppel CL, Wood PA, Vance DE & Cox GA A rostrocaudal muscular dystrophy caused by a defect in choline kinase beta, the first enzyme in phosphatidylcholine biosynthesis, J Biol Chem 2006; 281: 4938–48. [DOI] [PubMed] [Google Scholar]
- 29.Lykidis A, Wang J, Karim MA & Jackowski S Overexpression of a mammalian ethanolamine-specific kinase accelerates the CDP-ethanolamine pathway, J Biol Chem 2001; 276: 2174–9. [DOI] [PubMed] [Google Scholar]
- 30.Emoto K, Kobayashi T, Yamaji A, Aizawa H, Yahara I, Inoue K & Umeda M Redistribution of phosphatidylethanolamine at the cleavage furrow of dividing cells during cytokinesis, Proc Natl Acad Sci U S A. 1996; 93: 12867–72. [DOI] [PMC free article] [PubMed] [Google Scholar]
- 31.Mori N, Wildes F, Kakkad S, Jacob D, Solaiyappan M, Glunde K & Bhujwalla ZM Choline kinase-alpha protein and phosphatidylcholine but not phosphocholine are required for breast cancer cell survival, NMR Biomed 2015; 28: 1697–706. [DOI] [PubMed] [Google Scholar]
- 32.Rauch J, Volinsky N, Romano D & Kolch W The secret life of kinases: functions beyond catalysis, Cell Commun Signal. 2011; 9: 23. [DOI] [PMC free article] [PubMed] [Google Scholar]
- 33.Mintz A, Wang L & Ponde DE Comparison of radiolabeled choline and ethanolamine as probe for cancer detection, Cancer Biol Ther 2008; 7: 742–7. [DOI] [PubMed] [Google Scholar]
- 34.Vavere AL & Scott PJH Clinical Applications of Small-molecule PET Radiotracers: Current Progress and Future Outlook, Semin Nucl Med 2017; 47: 429–453. [DOI] [PubMed] [Google Scholar]
- 35.van der Kemp WJ, Stehouwer BL, Boer VO, Luijten PR, Klomp DW & Wijnen JP Proton and phosphorus magnetic resonance spectroscopy of the healthy human breast at 7 T, NMR Biomed 2017; 30. [DOI] [PMC free article] [PubMed] [Google Scholar]
Associated Data
This section collects any data citations, data availability statements, or supplementary materials included in this article.


