Abstract
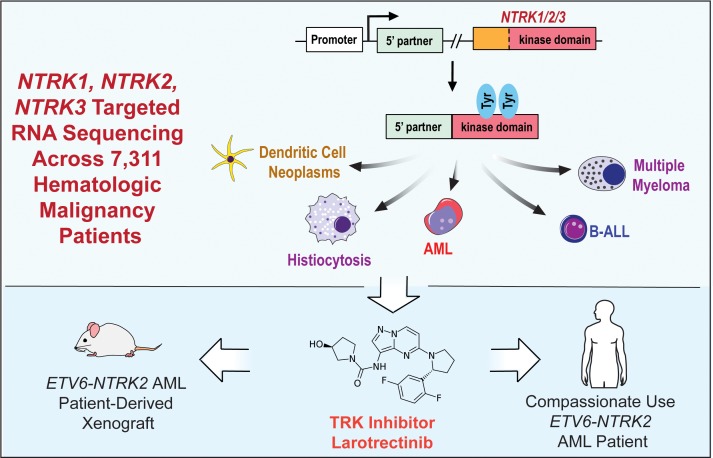
Rearrangements involving the neurotrophic receptor kinase genes (NTRK1, NTRK2, and NTRK3; hereafter referred to as TRK) produce oncogenic fusions in a wide variety of cancers in adults and children. Although TRK fusions occur in fewer than 1% of all solid tumors, inhibition of TRK results in profound therapeutic responses, resulting in Breakthrough Therapy FDA approval of the TRK inhibitor larotrectinib for adult and pediatric patients with solid tumors, regardless of histology. In contrast to solid tumors, the frequency of TRK fusions and the clinical effects of targeting TRK in hematologic malignancies are unknown. Here, through an evaluation for TRK fusions across more than 7,000 patients with hematologic malignancies, we identified TRK fusions in acute lymphoblastic leukemia (ALL), acute myeloid leukemia (AML), histiocytosis, multiple myeloma, and dendritic cell neoplasms. Although TRK fusions occurred in only 0.1% of patients (8 of 7,311 patients), they conferred responsiveness to TRK inhibition in vitro and in vivo in a patient-derived xenograft and a corresponding AML patient with ETV6-NTRK2 fusion. These data identify that despite their individual rarity, collectively, TRK fusions are present in a wide variety of hematologic malignancies and predict clinically significant therapeutic responses to TRK inhibition.
Keywords: Hematology, Oncology
Keywords: Cancer, Oncogenes, Signal transduction
Introduction
Fusions involving neurotrophic receptor tyrosine kinases (NTRKs) were among the first gene translocations described in cancer (1, 2). NTRK1, NTRK2, and NTRK3 (encoding TrkA, TrkB, and TrkC, respectively; hereafter collectively referred to as TRK) are primarily expressed in neuronal tissue. Rearrangements resulting in fusion of the carboxy-terminal kinase domain of TRK and various upstream amino-terminal partners create chimeric proteins with ectopic expression and constitutive kinase activation. TRK fusions are pathognomonic for several rare solid tumor malignancies (3–6) but are present in fewer than 1% of all solid tumors (7–10). Although TRK fusions are uncommon, efficacy of TRK inhibition in patients with solid tumors harboring these fusions is striking, with an 80% overall response rate for the highly selective pan-TRK inhibitor larotrectinib in a cohort of 17 tumor types (11). Based on these data, larotrectinib received the first tissue-agnostic Breakthrough Therapy designation from the FDA for adult and pediatric patients with advanced solid tumors bearing TRK fusions.
Despite the promise of TRK inhibition in solid tumors, the frequency and characteristics of TRK fusions in hematologic malignancies have not been systematically evaluated nor is there knowledge of the clinical efficacy of TRK inhibition in any hematologic malignancy. Given that individual patients with TRK fusions have been described in acute myeloid leukemia (AML) (12–14), Philadelphia chromosome–like B cell acute lymphoblastic leukemia (Ph-like B-ALL) (15), and histiocytosis (16), TRK fusions may have clinical importance in hematologic malignancies. Here we describe the frequency and characteristics of NTRK1, -2, or -3 fusions across more than 7,000 pediatric and adult patients with hematologic malignancies and report the efficacy of TRK inhibition in a refractory AML patient with a novel ETV6-NTRK2 fusion.
Results and Discussion
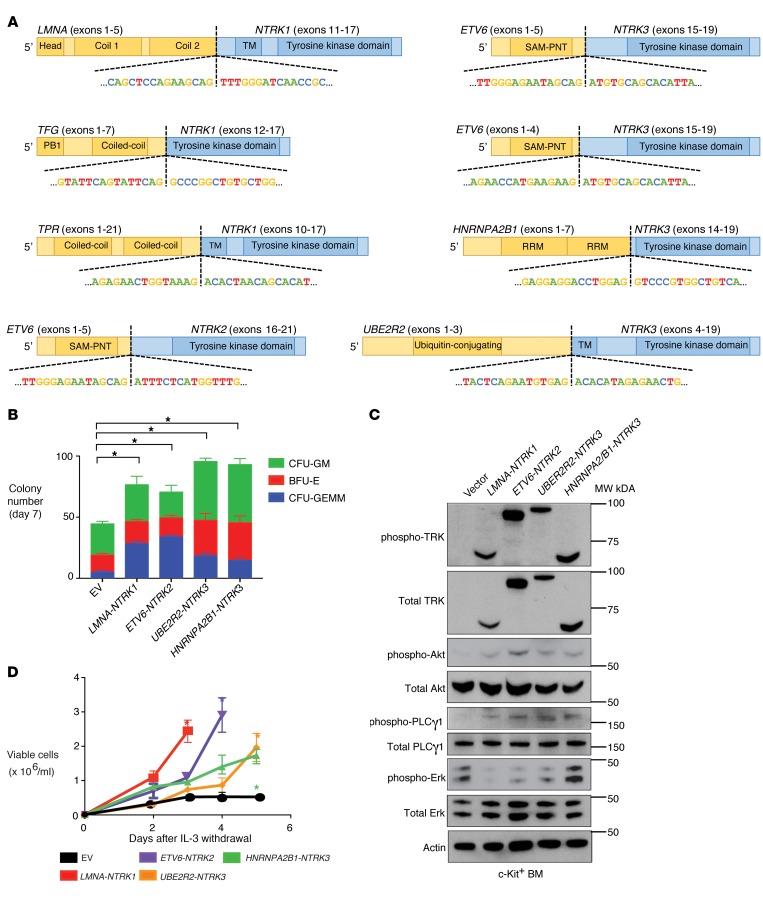
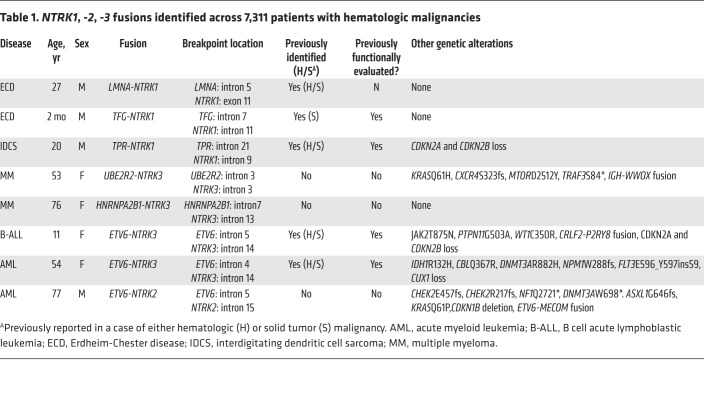
We performed next-generation targeted DNA and RNA sequencing across 7,311 patients with a variety of hematologic malignancies and discovered 8 patients (0.1%) harboring in-frame NTRK1, -2, or -3 fusions that included the full tyrosine kinase domain (Figure 1A and Table 1). TRK fusions occurred equally in males and females and across an age range of younger than 1 to 77 years (Table 1). The denominator (7,311 patients) and demographics for each disease subtype sequenced are listed in Supplemental Table 1; supplemental material available online with this article; https://doi.org/10.1172/JCI120787DS1 Fusions occurred in patients with histiocytic (LMNA-NTRK1, TFG-NTRK1) and dendritic cell (TPR-NTRK1) neoplasms (n = 3/78; 3.8%) as well as ALL (ETV6-NTRK3; n = 1/659; 0.15%) and AML (ETV6-NTRK2, ETV6-NTRK3; n = 2/1201; 0.17%). In addition, we detected 2 multiple myeloma patients with NTRK3 fusions (UBE2R2-NTRK3 and HNRNPA2B1-NTRK3; n = 2/1859; 0.11%).
Figure 1. Transforming TRK fusions are present across hematologic malignancies and cause transformation in a cell-type specific manner.
(A) Diagram of the TRK fusions identified across 7,311 patients with hematologic malignancy, with the domain of each protein included in the fusion and the nucleotide sequence at the break points shown. The carboxy-terminal kinase domains of TRK proteins are fused in-frame to the amino-terminal fusion partners. (B) Methylcellulose colony numbers formed by murine c-Kit+ bone marrow transduced with the indicated fusion proteins (CFU-GM, colony-forming unit granulocyte-macrophage; CFU-GEMM, colony-forming unit granulocyte, erythrocyte, monocyte, megakaryocyte; and BFU-E, burst-forming unit erythroid). (C) Western blot performed on lysates from cells in B. Blots were stripped and reprobed for total proteins after respective phospho-proteins. (D) Growth of 32D cells in media lacking IL-3 either expressing the indicated fusion protein or transduced with the empty vector (EV) as negative control. Error bars represent mean and SD from triplicate samples. Differences were calculated using a 2-sided Student’s t test and corrected for multiple testing using the Bonferroni method (*P < 0.0125).
Table 1. NTRK1, -2, -3 fusions identified across 7,311 patients with hematologic malignancies.
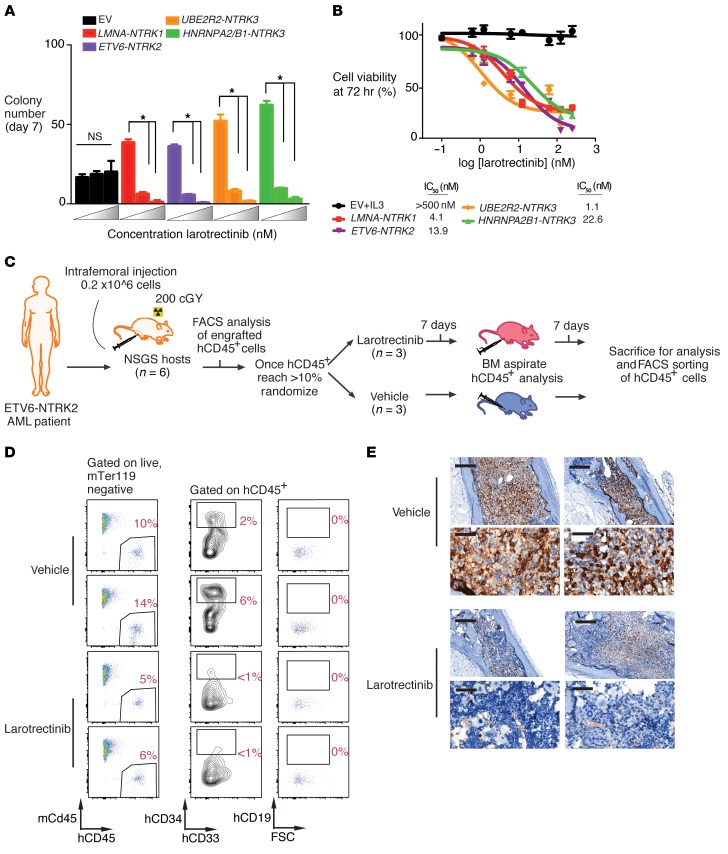
Four of the 8 TRK fusions identified here were either previously unreported in the literature or had been reported but not functionally evaluated. To investigate the functional relevance of these alterations, these 4 fusions were cloned and expressed in c-Kit+ mouse bone marrow (BM) cells where they resulted in a 1.7- to 2.2-fold expansion in colony formation (Figure 1B) and increased activation of AKT and PLCγ1 (Figure 1C). Despite uniform growth-promoting properties in primary murine BM cells and equivalent levels of TRK protein expression, each TRK fusion displayed distinct transforming and transphosphorylation properties in murine 32D and Ba/F3 hematopoietic cell lines. For example, LMNA-NTRK1, ETV6-NTRK2, and UBE2R2-NTRK3 fusions caused robust cytokine-independent growth of both Ba/F3 and 32D cells, whereas the HNRNPA2/B1-NTRK3 fusion did not transform Ba/F3 cells (Figure 1D and Supplemental Figure 1A). Consistent with these different growth properties, each fusion activated or did not activate PI3K-AKT, MAPK, and PLCγ1 signaling to differing degrees (Supplemental Figure 1B). Regardless of potential differences in lineage-dependent transforming capacities, expression of TRK fusions in primary mouse BM or cell lines conferred sensitivity to TRK inhibition (Figure 2, A and B and Supplemental Figure 1C).
Figure 2. TRK fusions confer responsiveness to TRK inhibition in hematopoietic malignancies in vitro and in vivo.
(A) Colony numbers derived from c-Kit+ murine bone marrow cells stably expressing the indicated constructs grown in increasing concentrations (0, 25, and 50 nM) of larotrectinib in methylcellulose. (B) Cell viability of IL-3–independent 32D cells expressing TRK fusions following 72 hours of larotrectinib or vehicle treatment. The IC50 is calculated from the slope of the log inhibitor versus response curve. (C) Schematic of creation and testing of larotrectinib in a PDX from a patient with AML with an ETV6-NTRK2 fusion. (D) Flow cytometric analysis of mouse versus human cell subsets (mCD45 versus hCD45) in BM of a PDX after larotrectinib or vehicle treatment. Each row represents a distinct individual mouse xenografted with the same patient sample; all percentages represent percentage of live mouse Ter119–negative (mTer119-negative) cells. (E) Anti-hCD45 immunohistochemical analysis in BM from PDX mice treated with vehicle or larotrectinib for 14 days (top row scale bar, 200 μm; bottom row scale bar, 50 μm). Each column represents a distinct individual mouse xenografted with the same patient sample. Error bars represent mean and SD from triplicate samples. Differences were calculated using a 2-sided Student’s t test and corrected for multiple testing using the Bonferroni method (*P < 0.0125).
The above studies identified a 77-year-old man with a history of chronic lymphocytic leukemia (CLL) who had developed refractory secondary AML with ETV6-NTRK2 as well as ETV6-MECOM fusions plus 7 additional mutations (Table 1). Quantitative reverse-transcriptase PCR (qRT-PCR) analysis of FACS-purified CLL and AML populations identified that the ETV6-NTRK2 fusion was restricted to AML and not expressed in residual CLL (Supplemental Figure 2, A and B). A patient-derived xenograft (PDX) was generated and tested for potential sensitivity to larotrectinib. The schema for creating the PDX is diagrammed in Figure 2C. Once engraftment of human myeloid cells was greater than 10% of total, live BM mononuclear cells (MNCs), engrafted mice were randomized to receive oral larotrectinib (150 mg/kg/day) or vehicle for 14 days (note, there was no evidence of CLL cell engraftment in vivo). Larotrectinib treatment reduced human chimerism as measured by FACS and histologic analysis (Figure 2D and Supplemental Figure 2C; discrepancy in human CD45 percentages between FACS and histology are due to sample in entire skeleton versus one bone, respectively). Consistent with this response, ETV6-NTRK2 expression was dramatically reduced in larotrectinib-treated mice (Supplemental Figure 2D) with the residual remaining cells positive only for the co-occurring ETV6-MECOM fusion.
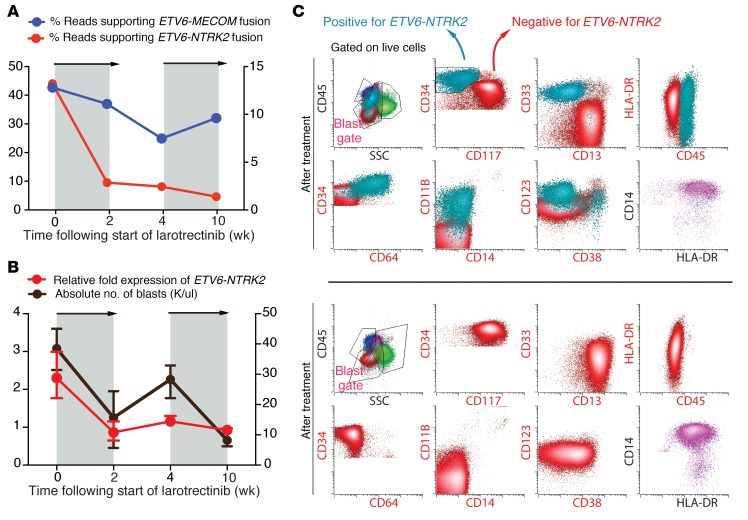
Given the response in the PDX and lack of treatment options, the above-mentioned patient received 100 mg larotrectinib twice daily (provided under FDA expanded access) and attained a partial response (17) as assessed by BM biopsy at day 60 (BM blasts decreased from 54% to 20% with absolute neutrophil count >1,000/μl and platelet count >100,000/μl). A greater than 50% reduction in peripheral blood blasts occurred over 10 weeks coincident with a reduction in the abundance of ETV6-NTRK2 fusion transcripts (Figure 3A), and the patient achieved a partial remission (full clinical parameters shown in Supplemental Table 2). A 10-day treatment interruption due to respiratory distress and temporary intubation (unrelated to larotrectinib) resulted in an increase in circulating blast percentage, which was once again reduced when larotrectinib was reinitiated. Overall, the clinical response to larotrectinib was mirrored by changes in the abundance of the ETV6-NTRK2 fusion (Figure 3, A and B).
Figure 3. Response of ETV6-NTRK2 fusion AML to larotrectinib and clinical relapse due to outgrowth of TRK fusion–negative clone.
(A) Targeted RNA sequencing of peripheral blood mononuclear cells (PBMNCs) during larotrectinib treatment of the patient showing sequencing reads supporting ETV6-NTRK2 (red line) or ETV6-MECOM (blue line). Gray areas denote time when larotrectinib was being administered to the patient. (B) ETV6-NTRK2 expression in PBMNCs measured by qRT-PCR (red line) during treatment of the patient as well as absolute number of PB blasts (black line). Error bars represent mean and SD from triplicate samples (error bars for blast percentage in B represent average of 3 consecutive days of blast percentage surrounding this time point). Relative fold expression of ETV6-NTRK2 was defined relative to the last time point. (C) Serial FACS analysis of bone marrow samples before treatment (top 2 rows) and after treatment (bottom 2 rows) with larotrectinib. All cells were gated on live cells and gates with red labels were gated on blasts as well. Changes in the frequency of TRK fusion–positive (turquoise; CD34+ CD117- cells in the blast gate) and –negative (red; CD34+ CD117+ cells in the blast gate) blasts before and after treatment are shown. Normal monocytes (CD45+HLA-DR+CD11b+CD14+) are shown in purple.
After 10 to 12 weeks of treatment, the patient eventually showed signs of clinical relapse and opted for supportive care. To evaluate the cause of relapse after larotrectinib therapy, we characterized ETV6-NTRK2 expression across the immunophenotypically distinct AML subpopulations. This analysis revealed that the ETV6-NTRK2 fusion was present in only 1 AML subpopulation of leukemic blasts at baseline (Supplemental Figure 2, A and B). Flow cytometric analysis of serial BM obtained during larotrectinib treatment revealed elimination of the population bearing the ETV6-NTRK2 fusion (CD33+CD34+CD117–CD11B+CD13–CD64+ cells) with continued presence of the population expressing the ETV6-MECOM fusion (CD33+CD34+CD117+CD11b–CD123+CD13+CD64– cells) (Figure 3C and Supplemental Figure 2E). Serial targeted RNA sequencing identified reduced ETV6-NTRK2 expression throughout larotrectinib treatment with concomitant increased ETV6-MECOM expression (Figure 3A). No mutations in NTRK2, including mutations associated with resistance to TRK inhibition (18), were detected at any time point, suggesting that clinical progression on larotrectinib was due to an expansion of the TRK fusion–negative AML clone, noted to be present at baseline.
We herein describe that TRK fusions occur across patients with a wide variety of hematologic malignancies and are amenable to TRK inhibition. In addition to prior data identifying TRK fusions in patients with AML (12–14), Ph-like B-ALL (15), and histiocytosis (16), we also document TRK fusions in multiple myeloma and dendritic cell neoplasms. Although the frequency of TRK fusions appears to be rare across a very wide spectrum of leukemias and lymphoid malignancies studied here, the antitumor activity of larotrectinib seen here calls for systematic identification of TRK fusions in the clinical evaluation of hematologic malignancy patients with refractory disease. In the solid tumor setting, immunohistochemistry (IHC) with a pan-TRK antibody has shown potential for TRK fusion detection in certain settings (19). However, TRK IHC has not been studied in hematologic malignancies, where expression of TRK kinases in the absence of gene rearrangements has been described (20, 21). As noted earlier, the efficacy of larotrectinib in TRK fusion–expressing cancer types was very recently demonstrated in a histology- and age-agnostic study of children and adults with solid tumors. In this study, 55 patients with 17 TRK fusion–positive tumor types received larotrectinib with an objective response rate of 80% (11). In the solid tumor experience, occasional on-target mechanisms of acquired drug resistance were observed to occur due to drug-resistant mutations in the kinase domain of TRK proteins. By contrast, in this case of the ETV6-NTRK2–expressing AML patient, the TRK fusion clone was suppressed by TRK inhibition, but ultimately the efficacy of TRK inhibition was limited by the subclonal nature of the fusion. Further efforts to correlate the response to TRK inhibition with the clonal nature of TRK fusion expression will thus be important to determining how durable responses will be in hematologic malignancies. In the setting of subclonal TRK fusions, combination strategies employing highly selective inhibitors with other anticancer agents with limited overlapping toxicities will likely be required to achieve complete responses.
Methods
Patient samples.
Targeted DNA (>50 ng) and RNA (>300 ng) sequencing was interrogated using the FoundationOne Heme Panel (Foundation Medicine Inc.) (22). The panel analyzes the complete coding DNA sequence of 405 genes, as well as selected introns of 31 genes involved in chromosomal rearrangements. It also interrogates the RNA sequence of 265 genes commonly rearranged into fusions. Although raw sequencing data from the FoundationOne Heme Assay is not available for public accessibility, researchers may contact Foundation Medicine Inc. to discuss or request access (client.services@foundationmedicine.com).
Anchored multiplex PCR for targeted next-generation sequencing of fusions.
Detailed methods for multiplex fusion PCR are provided in the Supplemental Materials.
Xenotransplantation.
Six-week-old NSGS (stock 013062) mice were sublethally irradiated (200 cGy) 24 hours before transplantation followed by direct intrafemoral injection (23). Viably frozen BM MNCs were used for xenografts and engrafted into the maximal number of recipient animals (which was 6 recipient mice total).
Flow cytometry.
Detailed methods for flow cytometry and all antibodies utilized are provided in the Supplemental Materials.
Histology.
Detailed methods for histological analyses and antibodies used for immunohistochemistry are provided in the Supplemental Materials.
Western blotting.
Detailed methods for Western blotting and all antibodies utilized are provided in the Supplemental Materials.
Colony-forming assays and in vitro and in vivo drug studies.
Detailed methods for colony-forming assays and in vitro and in vivo drug studies are provided in the Supplemental Materials.
Statistics.
Prism version 6 software (GraphPad) was used for statistical analysis. Data are mean ± SD. Statistical analysis was performed using the 2-tailed Student’s t test for comparison of 2 groups to determine the level of significance. Correction for multiple testing was performed using the Bonferroni method.
Study approval.
The human subject studies were approved by the Memorial Sloan Kettering Cancer Center (MSKCC) institutional review board and diagnostic BM aspirates or peripheral blood (PB) samples were obtained from patients at MSKCC after obtaining written informed consent. Animal experiments were approved by the MSKCC IACUC.
Author contributions
JT, AY, SSC, CM, LB, DI, and YRC performed the experiments. DP, RB, EC, LAA, TIM, MA, and SA performed sequencing and sequencing analyses. EC, KM, KE, BBT, NK, and MS helped with drug experiments. BHD, MR, and JFH performed histology analysis. JMW, ELD, DMH, and JHP treated the patient. JT, JHP, and OAW wrote the manuscript. All authors approved the manuscript.
Supplementary Material
Acknowledgments
JT is supported by grants from The Conquer Cancer Foundation of the American Society of Clinical Oncology, The American Association for Cancer Research, the American Society of Hematology, and the Robert Wood Johnson Foundation. JHP is supported by grants from the Conquer Cancer Foundation of the American Society of Clinical Oncology, the Leukemia and Lymphoma Society, the National Comprehensive Cancer Network, and the American Society of Hematology. OAW is supported by grants from the Edward P. Evans Foundation, the Department of Defense Bone Marrow Failure Research Program (BM150092 and W81XWH-12-1-0041), NIH/NHLBI (R01 HL128239), NIH/NCI (R01 CA201247-01A1), the Leukemia and Lymphoma Society, the Pershing Square Sohn Cancer Research Alliance, and a MSKCC core grant (P30 CA008748).
Version 1. 06/19/2018
In-Press Preview
Version 2. 08/06/2018
Electronic publication
Version 3. 08/31/2018
Print issue publication
Footnotes
Conflict of interest: DP, LAA, TM, and SA are employees of Foundation Medicine Inc. KE, BBT, and NK are employees of LOXO Oncology Inc.
Reference information: J Clin Invest. 2018;128(9):3819–3825.https://doi.org/10.1172/JCI120787.
Contributor Information
Justin Taylor, Email: jtmed11@gmail.com.
Dean Pavlick, Email: dpavlick@foundationmedicine.com.
Akihide Yoshimi, Email: ayoshimi-tky@umin.ac.jp.
Christina Marcelus, Email: marceluc@upstate.edu.
Stephen S. Chung, Email: chungs1@mskcc.org.
Jaclyn F. Hechtman, Email: hechtmaj@mskcc.org.
Ryma Benayed, Email: benayedr@mskcc.org.
Emiliano Cocco, Email: coccoe@mskcc.org.
Benjamin H. Durham, Email: durhamb@mskcc.org.
Lillian Bitner, Email: bitnerl@mskcc.org.
Daichi Inoue, Email: daichi-i@hotmail.co.jp.
Young Rock Chung, Email: youngrock.chung@gmail.com.
Kerry Mullaney, Email: mullanek@mskcc.org.
Justin M. Watts, Email: jxw401@miami.edu.
Eli L. Diamond, Email: diamone1@mskcc.org.
Lee A. Albacker, Email: lalbacker@foundationmedicine.com.
Tariq I. Mughal, Email: tmughal911@hotmail.com.
Kevin Ebata, Email: kevin@loxooncology.com.
Brian B. Tuch, Email: brian@loxooncology.com.
Nora Ku, Email: ku@loxooncology.com.
Maurizio Scaltriti, Email: scaltrim@mskcc.org.
Mikhail Roshal, Email: roshalm@mskcc.org.
Maria Arcila, Email: arcilam@MSKCC.ORG.
Siraj Ali, Email: siraj@foundationmedicine.com.
David M. Hyman, Email: hymand@mskcc.org.
Jae H. Park, Email: parkj6@mskcc.org.
Omar Abdel-Wahab, Email: abdelwao@mskcc.org.
References
- 1.Pulciani S, Santos E, Lauver AV, Long LK, Aaronson SA, Barbacid M. Oncogenes in solid human tumours. Nature. 1982;300(5892):539–542. doi: 10.1038/300539a0. [DOI] [PubMed] [Google Scholar]
- 2.Martin-Zanca D, Hughes SH, Barbacid M. A human oncogene formed by the fusion of truncated tropomyosin and protein tyrosine kinase sequences. Nature. 1986;319(6056):743–748. doi: 10.1038/319743a0. [DOI] [PubMed] [Google Scholar]
- 3.Tognon C, et al. Expression of the ETV6-NTRK3 gene fusion as a primary event in human secretory breast carcinoma. Cancer Cell. 2002;2(5):367–376. doi: 10.1016/S1535-6108(02)00180-0. [DOI] [PubMed] [Google Scholar]
- 4.Skálová A, et al. Mammary analogue secretory carcinoma of salivary glands, containing the ETV6-NTRK3 fusion gene: a hitherto undescribed salivary gland tumor entity. Am J Surg Pathol. 2010;34(5):599–608. doi: 10.1097/PAS.0b013e3181d9efcc. [DOI] [PubMed] [Google Scholar]
- 5.Nagasubramanian R, Wei J, Gordon P, Rastatter JC, Cox MC, Pappo A. Infantile fibrosarcoma with NTRK3-ETV6 fusion successfully treated with the tropomyosin-related kinase inhibitor LOXO-101. Pediatr Blood Cancer. 2016;63(8):1468–1470. doi: 10.1002/pbc.26026. [DOI] [PMC free article] [PubMed] [Google Scholar]
- 6.Pavlick D, et al. Identification of NTRK fusions in pediatric mesenchymal tumors. Pediatr Blood Cancer. 2017;64(8):e26433. doi: 10.1002/pbc.26433. [DOI] [PubMed] [Google Scholar]
- 7.Frattini V, et al. The integrated landscape of driver genomic alterations in glioblastoma. Nat Genet. 2013;45(10):1141–1149. doi: 10.1038/ng.2734. [DOI] [PMC free article] [PubMed] [Google Scholar]
- 8.Vaishnavi A, et al. Oncogenic and drug-sensitive NTRK1 rearrangements in lung cancer. Nat Med. 2013;19(11):1469–1472. doi: 10.1038/nm.3352. [DOI] [PMC free article] [PubMed] [Google Scholar]
- 9.Vaishnavi A, Le AT, Doebele RC. TRKing down an old oncogene in a new era of targeted therapy. Cancer Discov. 2015;5(1):25–34. doi: 10.1158/2159-8290.CD-14-0765. [DOI] [PMC free article] [PubMed] [Google Scholar]
- 10.Hyman D, Laetsch TW, Kummar S, DuBois SG, Farago AF, Pappo AS. The efficacy of larotrectinib (LOXO-101), a selective tropomyosin receptor kinase (TRK) inhibitor, in adult and pediatric TRK fusion cancers (abstract) J Clin Oncol. 2017;35(18_suppl):LBA2501. doi: 10.1200/JCO.2017.35.18_suppl.LBA2501. [DOI] [Google Scholar]
- 11.Drilon A, et al. Efficacy of larotrectinib in TRK fusion-positive cancers in adults and children. N Engl J Med. 2018;378(8):731–739. doi: 10.1056/NEJMoa1714448. [DOI] [PMC free article] [PubMed] [Google Scholar]
- 12.Eguchi M, et al. Fusion of ETV6 to neurotrophin-3 receptor TRKC in acute myeloid leukemia with t(12;15)(p13;q25) Blood. 1999;93(4):1355–1363. [PubMed] [Google Scholar]
- 13.Kralik JM, et al. Characterization of a newly identified ETV6-NTRK3 fusion transcript in acute myeloid leukemia. Diagn Pathol. 2011;6:19. doi: 10.1186/1746-1596-6-19. [DOI] [PMC free article] [PubMed] [Google Scholar]
- 14.Liu Q, et al. Signal transduction and transforming properties of the TEL-TRKC fusions associated with t(12;15)(p13;q25) in congenital fibrosarcoma and acute myelogenous leukemia. EMBO J. 2000;19(8):1827–1838. doi: 10.1093/emboj/19.8.1827. [DOI] [PMC free article] [PubMed] [Google Scholar]
- 15.Roberts KG, et al. Targetable kinase-activating lesions in Ph-like acute lymphoblastic leukemia. N Engl J Med. 2014;371(11):1005–1015. doi: 10.1056/NEJMoa1403088. [DOI] [PMC free article] [PubMed] [Google Scholar]
- 16.Diamond EL, et al. Diverse and targetable kinase alterations drive histiocytic neoplasms. Cancer Discov. 2016;6(2):154–165. doi: 10.1158/2159-8290.CD-15-0913. [DOI] [PMC free article] [PubMed] [Google Scholar]
- 17.Cheson BD, et al. Revised recommendations of the International Working Group for Diagnosis, Standardization of Response Criteria, Treatment Outcomes, and Reporting Standards for Therapeutic Trials in Acute Myeloid Leukemia. J Clin Oncol. 2003;21(24):4642–4649. doi: 10.1200/JCO.2003.04.036. [DOI] [PubMed] [Google Scholar]
- 18.Russo M, et al. Acquired resistance to the TRK inhibitor entrectinib in colorectal cancer. Cancer Discov. 2016;6(1):36–44. doi: 10.1158/2159-8290.CD-15-0940. [DOI] [PubMed] [Google Scholar]
- 19.Hechtman JF, et al. Pan-Trk immunohistochemistry is an efficient and reliable screen for the detection of NTRK fusions. Am J Surg Pathol. 2017;41(11):1547–1551. doi: 10.1097/PAS.0000000000000911. [DOI] [PMC free article] [PubMed] [Google Scholar]
- 20.Reuther GW, Lambert QT, Caligiuri MA, Der CJ. Identification and characterization of an activating TrkA deletion mutation in acute myeloid leukemia. Mol Cell Biol. 2000;20(23):8655–8666. doi: 10.1128/MCB.20.23.8655-8666.2000. [DOI] [PMC free article] [PubMed] [Google Scholar]
- 21.Tomasson MH, et al. Somatic mutations and germline sequence variants in the expressed tyrosine kinase genes of patients with de novo acute myeloid leukemia. Blood. 2008;111(9):4797–4808. doi: 10.1182/blood-2007-09-113027. [DOI] [PMC free article] [PubMed] [Google Scholar]
- 22.He J, et al. Integrated genomic DNA/RNA profiling of hematologic malignancies in the clinical setting. Blood. 2016;127(24):3004–3014. doi: 10.1182/blood-2015-08-664649. [DOI] [PMC free article] [PubMed] [Google Scholar]
- 23.Yoshimi A, et al. Robust patient-derived xenografts of MDS/MPN overlap syndromes capture the unique characteristics of CMML and JMML. Blood. 2017;130(4):397–407. doi: 10.1182/blood-2017-01-763219. [DOI] [PMC free article] [PubMed] [Google Scholar]
Associated Data
This section collects any data citations, data availability statements, or supplementary materials included in this article.


