Abstract
Dormant or slow-cycling tumor cells can form a residual chemoresistant reservoir responsible for relapse in patients, years after curative surgery and adjuvant therapy. We have adapted the pulse-chase expression of H2BeGFP for labeling and isolating slow-cycling cancer cells (SCCCs). SCCCs showed cancer initiation potential and enhanced chemoresistance. Cells at this slow-cycling status presented a distinctive nongenetic and cell-autonomous gene expression profile shared across different tumor types. We identified TET2 epigenetic enzyme as a key factor controlling SCCC numbers, survival, and tumor recurrence. 5-Hydroxymethylcytosine (5hmC), generated by TET2 enzymatic activity, labeled the SCCC genome in carcinomas and was a predictive biomarker of relapse and survival in cancer patients. We have shown the enhanced chemoresistance of SCCCs and revealed 5hmC as a biomarker for their clinical identification and TET2 as a potential drug target for SCCC elimination that could extend patients’ survival.
Keywords: Oncology
Keywords: Cancer, Epigenetics, Expression profiling
Introduction
Cancer remains a deadly disease since patients often relapse after surgery and adjuvant therapy, progressing to advanced metastatic stages (1). Recent studies have shown that cancer cells, beyond their genetic alterations, are heterogeneous in their contribution to tumor growth, metastasis, or resistance to therapy (2, 3). The study of the nongenetic molecular mechanisms governing such heterogeneity and its clinical implications currently represents a conceptual and technical challenge for the cancer research community.
Given that most conventional and target-directed drugs eliminate proliferating cancer cells, one direct explanation for resistance and relapse in patients could be the existence of dormant or slow-cycling cells within tumors. This hypothesis would implicate intratumoral heterogeneity at the individual cell proliferation level. In this context, a growing tumor mass could be considered as a dynamic ecosystem built by millions of cancer cells with different proliferation rates where some populations would eventually enter a slow-cycling status or prolonged dormancy. Such a minor reservoir of dormant tumor cells (DTCs) would resist antiproliferative drugs and retain cancer-initiating potential, fueling tumor regrowth after disease remission. Indeed, the existence of residual DTCs has been well documented in the clinic, since relapse and metastasis can occur years after a prolonged disease-free period achieved through initial curative surgery and effective treatment (4). However, this evidence is of little clinical utility without a clear understanding of the molecular mechanisms governing cancer cell dormancy or quiescence.
Most data generated on physiological quiescence derive from description of long-living minor cell populations in normal tissues such as skin, bone marrow, intestine, or breast (5–9). The description or isolation of these cells has mostly been based on their capacity to retain different labels incorporated in their genome (e.g., BrdU) (10) or chromatin (e.g., H2BeGFP) (5–9). Whereas proliferative cells diluted these marks upon cell division, quiescent populations were detected as label-retaining cells (LRCs) in pulse-chase experiments (11). These LRCs are responsible for tissue self-renewal and regeneration upon injury, exerting all major functions of adult stem cells (5–7). Unfortunately, most of these studies have been developed with transgenic mouse models and only a few in human tissues, tumors in particular.
Pece et al. used a cell membrane PKH26 pulse-chase labeling approach to reveal a minor population of breast cancer cells with enhanced tumor initiation potential and a distinctive gene expression profile (12). The presence of a higher proportion of these slow-cycling cells correlated with tumor subtypes presenting the worst overall survival in breast cancer patients. A couple of studies labeled slow-cycling human cells with green fluorescent protein (GFP) expressed under the control of NES/Nestin or KDM5B/JARID1B gene promoters in glioblastoma or melanoma cells, respectively (13, 14). Although the existence of slow-cycling cancer cells (SCCCs) negative for the expression of NES or KDM5B genes was not excluded in these studies, authors described SCCCs as a reservoir required for long-term tumor growth and chemoresistance.
A more detailed study of SCCCs is essential to unmask the cell-autonomous factors controlling their distinctive behavior and to reveal novel biomarkers for their clinical evaluation as well as drug targets for their elimination. In response, we adapted the use of histone H2B fused to enhanced GFP (H2BeGFP) (5) to an all-in-one lentivirus for its pulse-chase expression upon doxycycline (DOX) treatment in human cells. We observed that slow cycling is a transient state defining a constant minor proportion of undifferentiated cancer cells retaining cancer-initiating potential and enhanced chemoresistance. Cells at this slow-cycling status presented a distinctive gene expression profile common across tumor types as biologically diverse as colorectal carcinoma, melanoma, and glioblastoma. This gene expression profile was cell-autonomous and was shared by SCCCs with cancer genomes driven by different sets of oncogenic mutations. Their expression pattern indicated low proliferation and energy metabolism and simultaneous activation of genes related to stemness, chemoresistance, hypoxia, or crosstalk with immune cells and tumor vasculature.
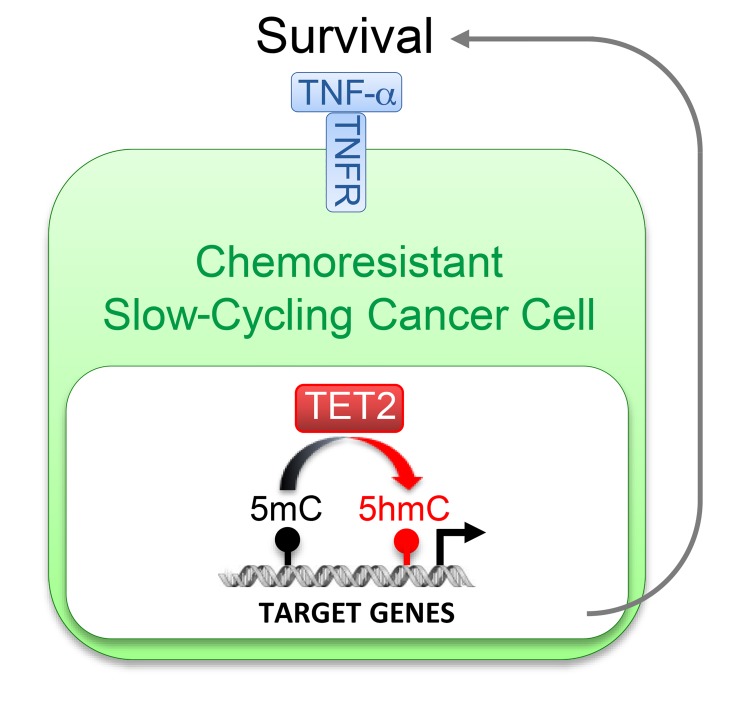
We identified TET2 as a key factor governing the fate of chemoresistant SCCCs that controls their numbers and survival. It determines tumor recurrence and is a potential drug target for SCCC elimination. TET2 is an epigenetic dioxygenase responsible for the enzymatic oxidation of genomic 5-methylcytosine (5mC) to 5-hydroxymethylcytosine (5hmC) (15, 16). We show that 5hmC was actually an epigenetic biomarker that predicted relapse and worse patient survival.
Results
Slow cycling is a reversible state acquired by undifferentiated cancer cells with tumor-initiating potential.
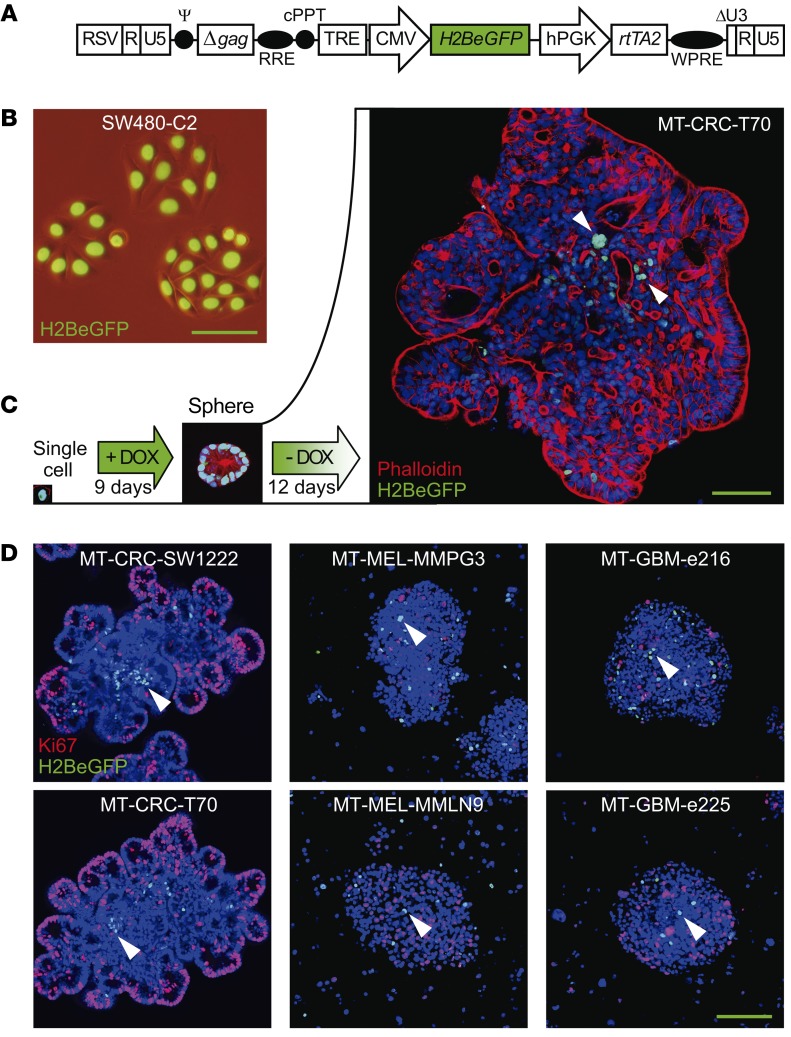
To label human SCCCs, we developed a DOX-inducible all-in-one lentivirus vector to express H2BeGFP (Figure 1A). After a DOX pulse chase, the accumulated H2BeGFP signal in the chromatin was diluted with mathematical precision upon cell divisions in 4 different colon cancer cell lines (Figure 1B, Supplemental Figure 1, and Supplemental Video 1; supplemental material available online with this article; https://doi.org/10.1172/JCI96393DS1). We then infected cells from patient-derived xenograft (PDX) models generated from melanomas (MEL-MMPG3, MEL-MMLN9), glioblastomas (GBM-e216, GBM-e225), a colorectal carcinoma (CRC-T70), and the colon cancer cell line CRC-SW1222, which all preserved cell heterogeneity and multipotency (Supplemental Table 1) (17). We selected fresh-infected PDX models since they more faithfully recapitulate human disease than regular cell lines at all relevant levels, including intratumoral cell heterogeneity and drug response (18, 19).
Figure 1. An H2BeGFP pulse-chase system marks slow-cycling cells.
(A) Schematic representation of tetracycline-inducible lentiviral pSIN-TRE-H2BeGFP-rtTA2 construct. H2BeGFP is expressed via a tetracycline response element–containing promoter (TRE), which is activated by the reverse tetracycline transactivator (rtTA) induced in the presence of the tetracycline derivative doxycycline (DOX). RSV, constitutive promoter Rous sarcoma virus; RRE, Rev response element; cPPT, central polypurine tract; hPGK, human phosphoglycerate kinase promoter; WPRE, woodchuck hepatitis virus post-transcriptional regulatory element. (B) Chromatin accumulation of H2BeGFP in infected colon cancer cells upon DOX treatment. (C and D) Representative immunofluorescence picture of H2BeGFP-infected minitumors (MTs) growing embedded in Matrigel for colorectal (CRC) models or in suspension for melanoma (MEL) and glioblastoma (GBM) cancer models generated from single-cell suspensions. Cultures were treated with a DOX pulse chase to evaluate SCCCs together with cellular organization (phalloidin) (C) or proliferation (Ki67) (D). (C and D) Arrowheads, SCCCs. Hoechst was used as counterstain. (B–D) Scale bars: 100 μm.
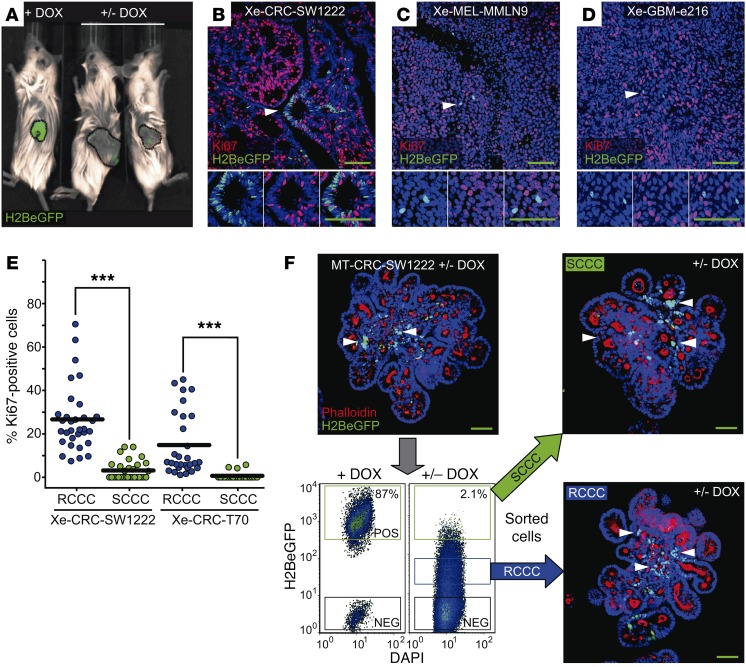
Colorectal carcinoma (CRC), glioblastoma (GBM), and melanoma (MEL) cells were grown in vitro as minitumors (MTs) embedded in either Matrigel (CRC models) or sphere suspension (GBM and MEL models), or in vivo as xenografts (Xe) upon injection in NOD/SCID or nude mice. For simplicity, cells in all in vitro cultures were referred to as MT. After a DOX pulse-chase treatment, nuclear H2BeGFP signal was progressively diluted revealing label-retaining cells (SCCCs) in all models (Figure 1, C and D; Figure 2, A–D; and Supplemental Figure 2, A and B). SCCCs from all models were negative for the proliferation marker protein Ki67 and, in the case of CRC, for differentiation (mucin-2 [MUC2], cytokeratin-20 [CK20], chromogranin-A [CGA], and lysozyme [LYZ]) and the senescence/DNA damage marker phospho–histone H2AX (pH2AX) (Figure 1D; Figure 2, B–E; and Supplemental Figure 2, B–D). We further confirmed that SW1222 or SW620 H2BeGFP-retaining cells were slow cycling in tumor xenografts by a simultaneous pulse-chase treatment with DOX and 5-bromo-2′-deoxyuridine (BrdU) or 5-ethynyl-2′-deoxyuridine (EdU) (Supplemental Figure 2, E and F). Almost all BrdU- or EdU-retaining cells were also positive for H2BeGFP. Both MT and xenograft models continuously treated with DOX (+ DOX) showed 2 populations by flow cytometry, a minor one with a background signal equivalent to noninfected cells and a major one with maximum H2BeGFP signal (Figure 2F and Supplemental Figure 2G). To gate SCCCs retaining H2BeGFP after a DOX pulse-chase treatment, we used the same nonarbitrary gate at maximum signal (+ DOX). On the contrary, we defined those infected cells that significantly diluted the H2BeGFP signal as a consequence of consecutive cell divisions, as rapid-cycling cancer cells (RCCCs). We observed that SCCCs represented up to 3% of all cells (Figure 2F and Supplemental Figure 2G). When CRC-SW1222 SCCCs and RCCCs isolated from MTs were reseeded at a single-cell density, both generated MTs with SCCCs and RCCCs after a second DOX pulse chase, revealing slow cycling as a transient and reversible state as opposed to a cell population entity (Figure 2F). FACS-isolated SCCCs from MTs of different tumor types presented a slightly higher MT reinitiation capacity than RCCCs when seeded back in culture at single-cell density despite their original slow-cycling behavior (Supplemental Figure 2H). Similarly, FACS-isolated CRC-SW1222 SCCCs from xenografts showed cancer initiation potential equivalent to that of RCCCs upon injection at limiting numbers in the kidney capsule of NOD/SCID mice (Supplemental Figure 2I).
Figure 2. Slow cycling is a transient and reversible state.
(A) H2BeGFP signal in subcutaneous xenograft tumors developed from colon cancer cells infected with H2BeGFP upon DOX (+ DOX) or after a DOX pulse-chase treatment (+/– DOX). (B–D) Representative immunofluorescence picture of H2BeGFP (green) and proliferation (Ki67, red) in DOX pulse-chase subcutaneous tumor xenografts (Xe) from CRC-SW1222 (B), MEL-MMLN9 (C), and GBM-e216 (D) cancer models infected with H2BeGFP. (E) Quantification of Ki67-positive RCCCs (blue dots) and SCCCs (green dots) in the indicated subcutaneous xenografts (n = 8). Data are represented as mean ± SEM. ***P ≤ 0.001, 2-tailed Student’s t test. (F) FACS-isolated SCCCs and RCCCs from MTs were embedded back into Matrigel and treated with a second DOX pulse chase. SCCCs were evaluated by immunofluorescence against GFP. Representative pictures of MT formation from isolated SCCCs and RCCCs are shown. Phalloidin was used as counterstain. (B–D and F) Arrowheads, SCCCs. Hoechst was used as counterstain. Scale bars: 100 μm.
In summary, our H2BeGFP labeling approach identified a minor proportion of cancer cells in a transient, slow-cycling, and undifferentiated status that preserved cancer initiation potential (Supplemental Figure 2J).
Molecular profiling of SCCCs.
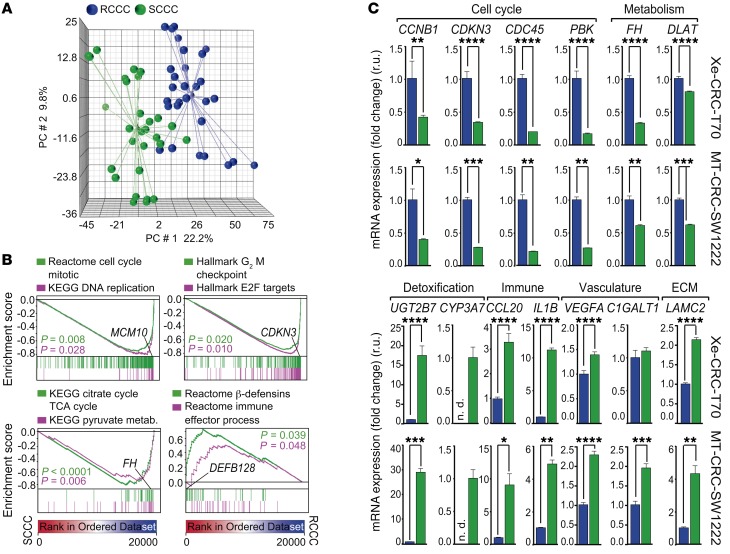
We compared the gene expression profile of 58 paired replicates of SCCCs and RCCCs isolated by FACS from subcutaneous tumor xenografts or minitumors that were generated from the 6 infected cancer cell models previously indicated (Figure 1, Supplemental Figure 2, and Supplemental Table 1). SCCCs showed a distinctive gene expression profile (PanC-SCCC signature) common across all models irrespectively of their intrinsic differences according to tumor type (CRC, MEL, and GBM), individual patient traits, mutation repertoire, or experimental model analyzed (xenograft or MT) (Figure 3A and Supplemental Tables 1 and 2).
Figure 3. SCCCs show a distinctive gene expression profile.
Gene expression profiles were analyzed from 29 replicates of SCCCs and 29 paired RCCCs isolated from 3 different cancer types: colorectal, melanoma, and glioblastoma, grown as MTs or xenografts. (A) Principal component (PC) analysis showing microarray data. Light-colored spheres represent mean-derived centroids. (B) Gene set enrichment analysis (GSEA) plots showing enrichment of the indicated gene sets from all integrated cancer models. P values by 1-way ANOVA. (C) Differential expression evaluation of indicated genes by qPCR analysis in RCCCs (blue bars) and SCCCs (green bars). Data are represented as mean ± SD of triplicates from 3 independent experiments. n.d., not detected; r.u., relative units. *P ≤ 0.05; **P ≤ 0.01; ***P ≤ 0.001; ****P ≤ 0.0001, 2-tailed Student’s t test.
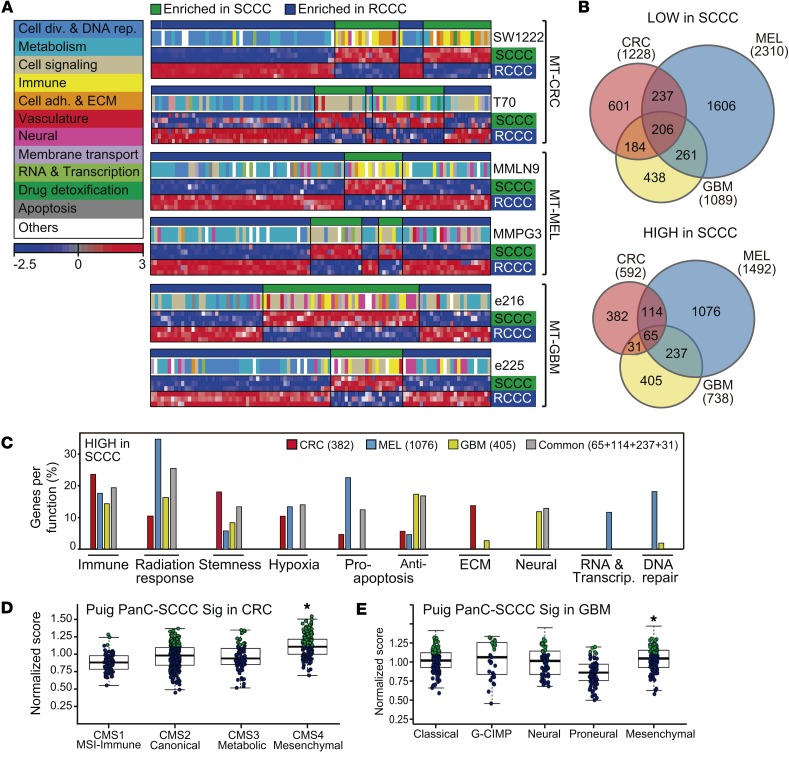
General processes such as proliferation and metabolism were negatively enriched in SCCCs, whereas those related to drug detoxification, stemness, hypoxia, or crosstalk with the immune system were positively enriched (Figure 3, B and C, and Figure 4A). In addition to these common characteristics, SCCCs also showed some tissue-specific features such as enrichment of DNA repair genes in melanoma as well as enrichment of neural or epithelial traits in SCCCs from GBM or CRC tumors, respectively (Figure 4, B and C, and Supplemental Table 2). Moreover, the PanC-SCCC signature was enriched in tumors from CRC and GBM patients subtyped as mesenchymal, which have been previously associated with a poor prognosis (Figure 4, D and E, and refs. 20, 21).
Figure 4. SCCC signature includes genes related to several biological functions.
(A) Single-sample GSEA projections for each indicated MT cancer model. Colored boxes correspond to general functions grouping differentially enriched gene sets. Color bar legend: blue, downregulated expression; red, upregulated expression. ECM, extracellular matrix. (B) Venn diagrams comparing genes lowly (top) or highly (bottom) expressed in SCCCs versus RCCCs. (C) Genes more highly expressed in SCCCs were grouped depending on their function following the Broad Institute’s ontology. Bars represent the percentage of genes related to a particular function with respect to all genes more highly expressed in SCCCs that are exclusive or common to models of each cancer type as defined in the Venn diagram shown in B, bottom. (D and E) Normalized PanC-SCCC signature score of The Cancer Genome Atlas (TCGA) CRC (D) and GBM (E) cohorts with intrinsic gene expression classifier labels. Significantly higher scores in the upper quartile are marked in green dots. *P < 0.001, Kruskal-Wallis test.
SCCCs in CRC-SW1222 (non-hypermutant) MTs growing embedded in Matrigel and not exposed to mouse stroma and those isolated from CRC-T70 (hypermutant) xenografts in vivo presented a gene expression profile that was mostly equivalent, revealing a nongenetic and cell-autonomous phenotype (Figure 3C; Figure 4A; Supplemental Figure 3, A and B; and Supplemental Table 1).
The PanC-SCCC signature showed lower expression of cyclins and cyclin-dependent kinases. This could in itself explain the observed accumulation of CRC-SW1222 SCCCs at the S and G2/M phases of the cell cycle (Supplemental Figure 3, C–E). SCCCs also presented a significantly lower expression of a compendium of genes involved in DNA replication (TOP2A and TYMS), centromere/kinetochore assembly machinery, or chromosome segregation (TUBB isoforms) essential for cell division (Supplemental Figure 4, A–C). The product of some of these genes is the direct target of chemotherapeutic drugs such as topoisomerase (TOP2A) and microtubule polymerization (TUBB) inhibitors or 5-fluorouracil (TYMS). Indeed, cancer cell lines (Cancer Therapeutics Research, Broad Institute) enriched in such a PanC-SCCC signature were more resistant to topoisomerase and microtubule inhibitors (Supplemental Figure 4D).
SCCCs present enhanced chemoresistance.
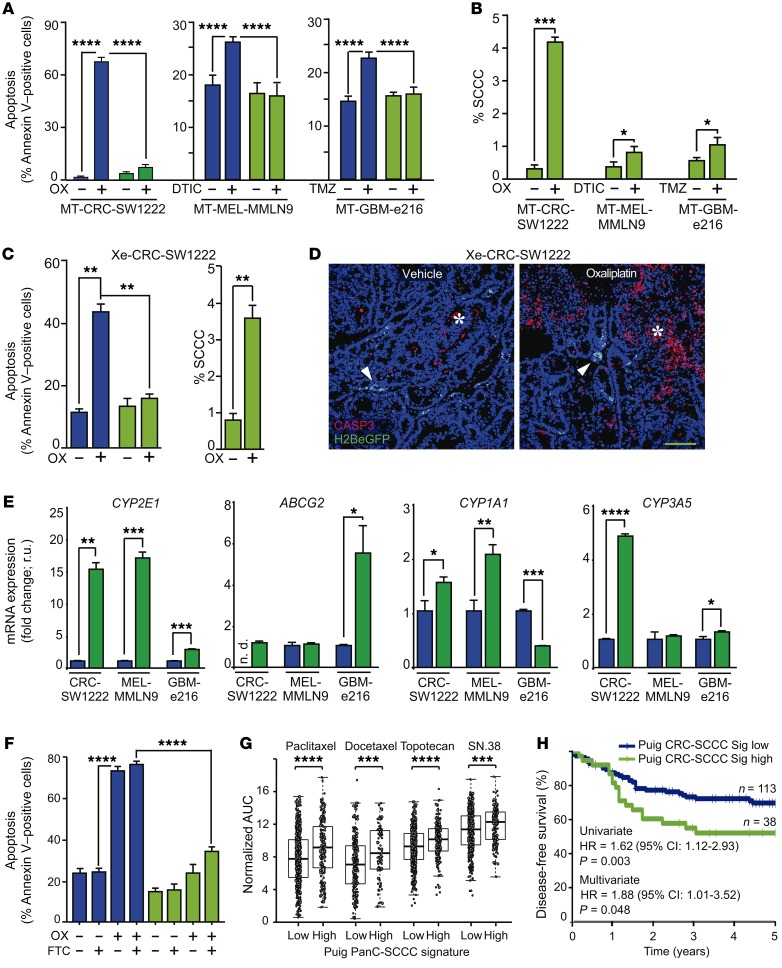
We observed that SCCCs from CRC, MEL, or GBM were more resistant to chemotherapy-induced apoptosis and thus increased their proportion upon treatment of MTs in vitro and CRC-SW1222 xenografts in vivo (Figure 5, A–D). Oxaliplatin increased the proportion of pH2AX-positive cells presenting DNA damage in both RCCC and SCCC populations (Supplemental Figure 5). However, most H2BeGFP-retaining cells (96.6%) were negative for pH2AX, suggesting that the enrichment of SCCCs upon chemotherapy was not due to a cell cycle arrest induced by oxaliplatin but rather was a consequence of their intrinsic resistance to treatment.
Figure 5. SCCCs present enhanced chemoresistance.
(A–D) Chemoresistance evaluation of SCCCs and RCCCs in indicated models. (A–C) Analysis of apoptosis (A and C) and proportion of SCCCs (B and C) after chemotherapy exposure. OX, oxaliplatin; DTIC, light-activated dacarbazine; TMZ, temozolomide. Apoptosis measurements: SW1222 RCCC vehicle (VEH) vs. SCCC OX (P ≤ 0.01); RCCC OX vs. SCCC VEH (P ≤ 0.0001); MMLN9 RCCC DTIC vs. SCCC VEH (P ≤ 0.0001); e216 RCCC TMZ vs. SCCC VEH (P ≤ 0.0001). (D) Immunofluorescence of caspase-3 (CASP3) (n = 6 per group) treated or not treated with oxaliplatin. Arrowheads, SCCCs; asterisk, apoptotic areas. Scale bar: 100 μm. (E) qPCR of indicated genes. Data are represented as mean ± SD of triplicates. ND, not detected; r.u., relative units. (F) Apoptosis flow cytometric evaluation in RCCCs and SCCCs from CRC-SW1222-H2BeGFP cells growing as MTs. FTC, fumitremorgin C. Apoptosis measurements: RCCC VEH/FTC vs. RCCC OX/OX+FTC (P ≤ 0.0001); RCCC VEH/FTC vs. SCCC VEH/FTC (P ≤ 0.01); RCCC VEH/FTC vs. SCCC OX+FTC (P ≤ 0.001); RCCC OX/OX+FTC vs. SCCC VEH/FTC/OX/OX+FTC (P ≤ 0.0001); SCCC VEH/FTC vs. SCCC OX+FTC (P ≤ 0.0001); SCCC OX vs. SCCC OX+FTC (P ≤ 0.001). (G) Drug sensitivity of cancer cell lines according to PanC-SCCC signature scores. Adjusted Wilcoxon test. (H) Disease-free survival of chemo-treated high-risk stage II/III colon cancer patients (GSE39582, n = 151) according to CRC-SCCC signature score. HR, hazard ratio. Cox proportional hazards model. (A–C and F) Data are represented as mean ± SEM. (A, B, E, and F) Data were obtained from triplicates of 3 independent experiments. (A–C, E, and F) Blue bars, RCCCs; green bars, SCCCs. (A and F) 1-way ANOVA. (B, C, and E) 2-tailed Student’s t test. (A–C and E–G) *P ≤ 0.05; **P ≤ 0.01; ***P ≤ 0.001; ****P ≤ 0.0001.
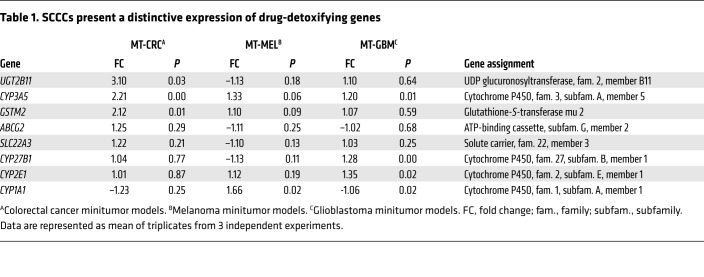
SCCCs from MTs showed higher expression of genes related to active drug detoxification (Table 1, Figure 5E, and Supplemental Table 2). Some drug resistance genes highly expressed in SCCCs were common and others exclusive to each tumor type. Inhibition of ABCG2 pump in CRC-SW1222 MTs with the specific inhibitor fumitremorgin C (22) did not significantly increase oxaliplatin-induced apoptosis in SCCCs (Figure 5F). Furthermore, cell lines enriched in our PanC-SCCC signature were also more resistant to standard-of-care chemotherapeutics such as paclitaxel, docetaxel, topotecan, or SN.38 (Figure 5G). Finally, in a cohort of CRC patients treated with 5-fluorouracil–based adjuvant chemotherapy, those classified as positive for a CRC-SCCC signature had significantly shorter disease-free survival after adjustment for other known prognostic risk factors (Figure 5H and Supplemental Table 2).
Table 1. SCCCs present a distinctive expression of drug-detoxifying genes.
In summary, we demonstrated that although SCCCs from different tumor types were all resistant to standard chemotherapy, the molecular mechanisms responsible for this phenotype could be diverse and rely on a variety of drug detoxifying enzymes and/or membrane pumps. Therefore, inhibition of just a single one of these targets (ABCG2 with fumitremorgin C) may not be effective as a universal therapy to sensitize resistant SCCCs to chemotherapy.
TET2 controls gene expression, number and survival of SCCCs, and tumor recurrence.
We had by this point elaborated a detailed description of the biological and molecular traits of SCCCs, but not yet defined a strategy for their identification and elimination in patient tumors. To do so, we decided to address one crucial question: are there any key factors governing SCCC phenotype?
Different epigenetic regulators have been described to impose nongenetic and transient phenotypes recapitulating molecular features that we reveal here as distinctive of SCCCs: slow cycling, chemoresistance, cancer initiation potential, and a cell-autonomous gene expression profile (23).
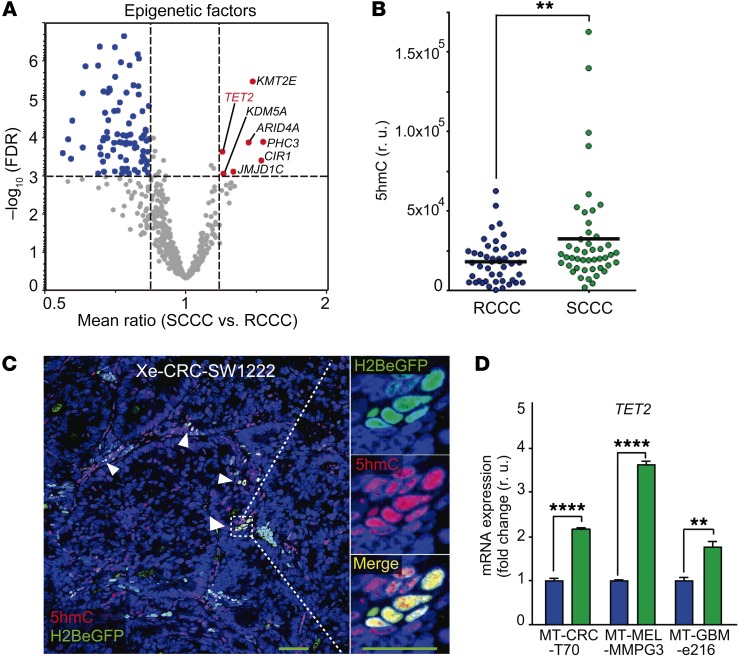
We observed 7 epigenetic factors recurrently highly expressed in SCCCs from all the different tumor types studied (Table 2, Figure 6A, and Supplemental Table 2). Four of these were described as general repressors of gene expression, whereas JMJD1C, KMT2E, and TET2 were contrarily shown to activate transcription of target genes (24–28). JMJD1C is a histone demethylase of mono- and dimethylated Lys-9 that would activate gene expression by removing this repressive epigenetic mark. However, such enzymatic activity is controversial and has not been demonstrated in all cellular contexts studied (29–31). KMT2E is a histone methyltransferase that specifically mono- and dimethylates Lys-4 of histone H3, promoting transcriptional activation of target genes (28). Unfortunately, in histological analyses of tumor xenografts, we revealed an accumulation of H3K4me1 and H3K4me2 marks in the nucleus of most cancer cells that was not specific to H2BeGFP-positive SCCCs (Supplemental Figure 6A and Isabel Puig, unpublished observations). Finally, TET2 promotes the oxidation of genomic 5mC to 5hmC, activating the expression of target genes (16). 5hmC was significantly enriched in SCCCs (Figure 6, B and C), encouraging us to further investigate the potential role of TET2 as a key determinant of SCCCs’ distinctive properties.
Table 2. Epigenetic factors highly expressed in SCCCs.
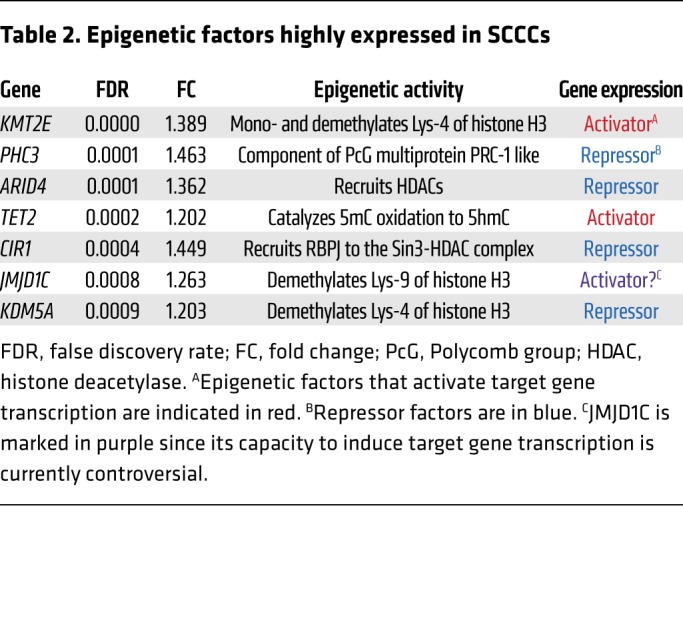
Figure 6. SCCCs present high TET2 expression and 5hmC.
(A) Evaluation of differential expression of epigenetic factors in SCCCs versus RCCCs was analyzed by microarrays integrating the data from all cancer models. Volcano plot shows epigenetic factors differentially expressed in SCCCs versus RCCCs (x axis) against their significance (false discovery rate [FDR], y axis). Upregulated and downregulated epigenetic factors are indicated in red and blue, respectively. (B and C) 5hmC levels in SCCCs and RCCCs were evaluated by immunostaining in CRC-SW1222-H2BeGFP xenografts (n = 8). Forty-six images per condition were analyzed. (B) Histological quantification of 5hmC content in RCCCs and SCCCs per picture. r.u., relative units. (C) Representative picture of double 5hmC and H2BeGFP immunostaining. White arrowheads, SCCCs containing 5hmC. Scale bar: 100 μm; high-magnification scale bar: 20 μm. Hoechst was used as counterstain. (D) Expression of TET2 measured by qPCR. Data are represented as mean ± SD of triplicates from 3 independent experiments. Blue bars, RCCCs; green bars, SCCCs. (B and D) **P ≤ 0.01; ****P ≤ 0.0001, 2-tailed Student’s t test.
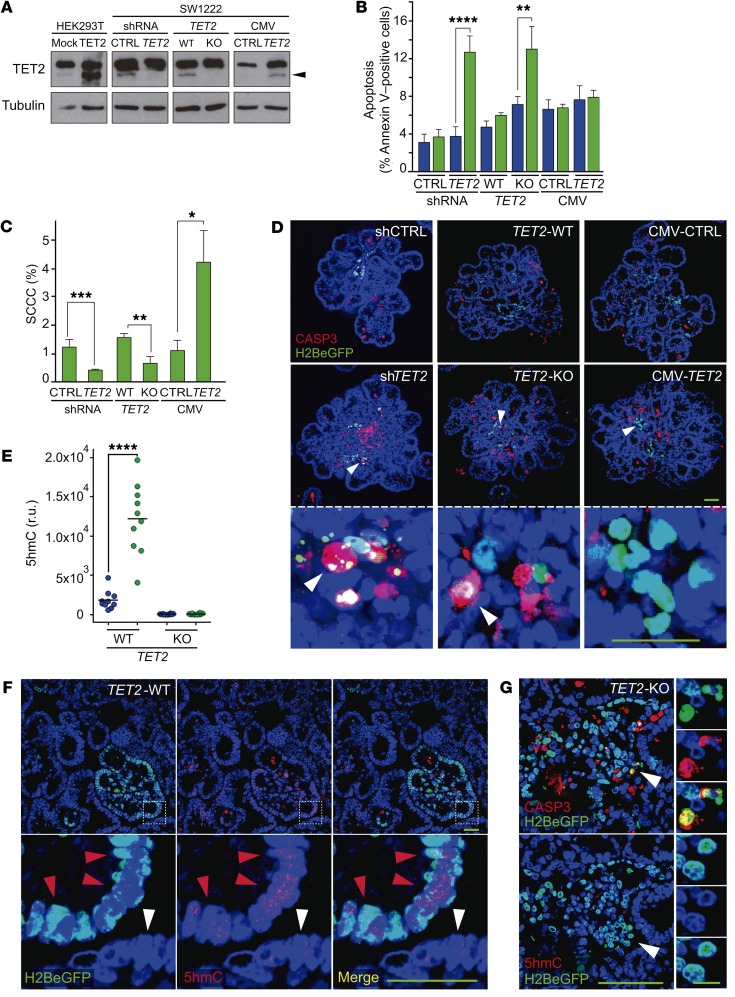
We first confirmed that TET2 was highly expressed in SCCCs of different tumor types (Figure 6D). We then modified the levels of TET2 expression in CRC-SW1222-H2BeGFP cells by shRNA (knockdown, shTET2), CRISPR/Cas9 (knockout, TET2-KO), or overexpression (CMV-TET2) (Figure 7A and Supplemental Figure 6B). None of these modifications significantly affected the proliferation of CRC-SW1222 cells growing as MTs (Supplemental Figure 6C). However, suppression of TET2 expression in shTET2 and KO cells increased apoptosis exclusively in SCCCs, reducing their proportion in MTs (Figure 7, B–D). When overexpressing TET2, MTs accumulated higher levels of SCCCs but without affecting their basal apoptosis. We confirmed that SCCCs presented higher 5hmC than RCCCs in TET2-WT MTs, whereas it was undetectable in both populations when TET2 was knocked out (TET2-KO) (Figure 7, E and F). We also observed that apoptotic TET2-KO SCCCs did not accumulate 5hmC (Figure 7G).
Figure 7. TET2 is essential for SCCC numbers and survival.
(A) Expression of TET2 was evaluated by Western blot in the indicated cell lines. Transient transfection of TET2 in HEK293T cells was used as positive control. Tubulin was used as loading control. The lanes were run on the same gel but were noncontiguous. Arrowhead, TET2 protein. CTRL, control; CMV, cytomegalovirus promoter. (B–G) Analysis of SCCC and RCCC viability was evaluated in the indicated cell lines growing as MTs. (B and C) Analysis of apoptosis (B) and proportion of SCCCs (C) by flow cytometry. Data are represented as mean ± SEM of triplicates from 3 independent experiments. Blue bars, RCCCs; green bars, SCCCs. (D) Representative pictures of immunofluorescence analysis of caspase-3 (CASP3). White arrowheads, SCCCs. (E) Histological quantification of 5hmC content in RCCCs and SCCCs per picture of paraffin-embedded MTs generated from the indicated cell lines. r.u., relative units. (F) Representative pictures of double 5hmC and H2BeGFP immunostaining of paraffin-embedded TET2-WT MTs. Red arrowheads, SCCCs containing 5hmC; white arrowheads, RCCCs. (G) Representative pictures of immunofluorescence staining to detect CASP3, H2BeGFP, and 5hmC colocalization in consecutive histological sections from paraffin-embedded TET2-KO MTs. White arrowheads, apoptotic SCCCs without 5hmC content. (D, F, and G) Scale bars: 100 μm; high-magnification scale bar: 20 μm. Hoescht was used as counterstain. (B, C, and E) *P ≤ 0.05; **P ≤ 0.01; ***P ≤ 0.001; ****P ≤ 0.0001, 2-tailed Student’s t test.
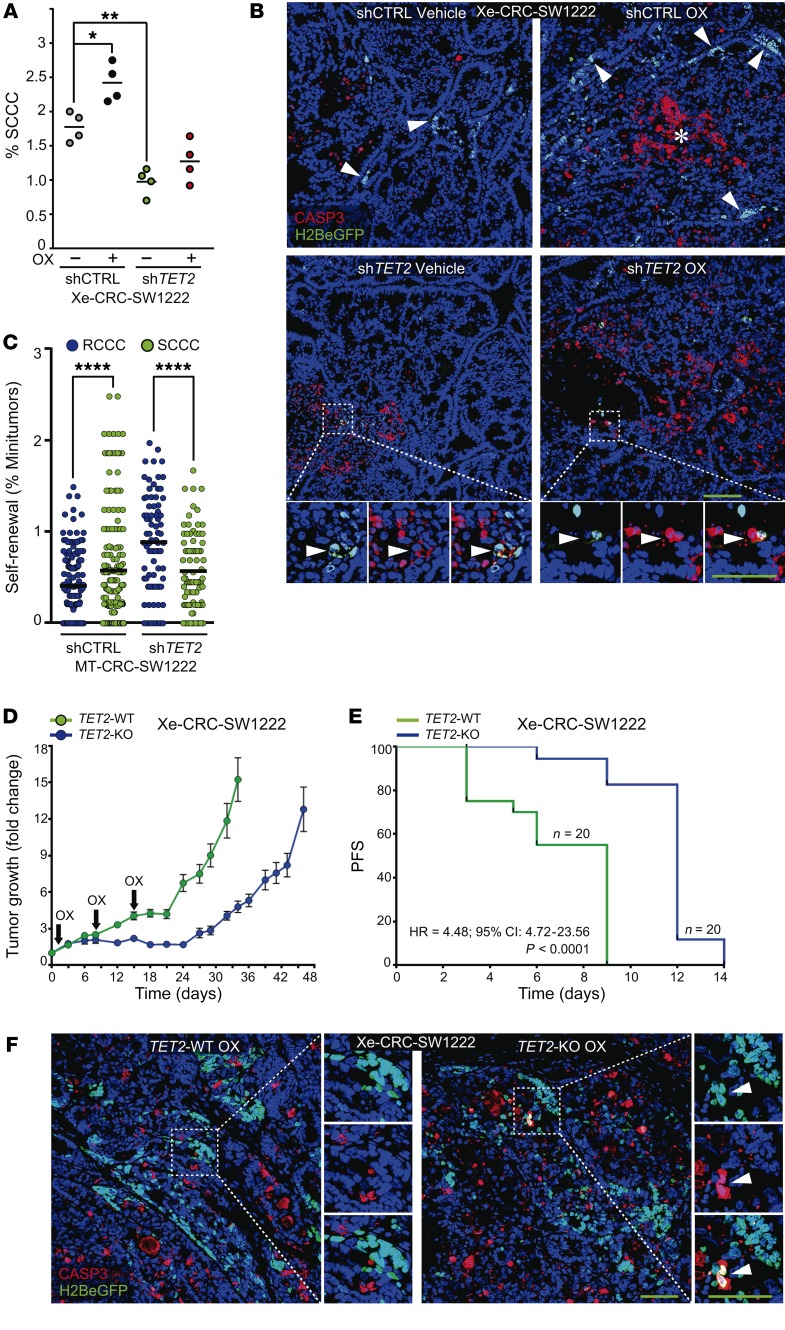
Furthermore, shTET2 xenografts showed a significantly lower proportion of SCCCs that was not enriched upon oxaliplatin treatment, as was the case in shCTRL tumors (Figure 8A). shTET2 also promoted higher apoptosis in SCCCs in tumor xenografts (Figure 8B). We concluded that TET2 also played a direct role in SCCC survival in growing tumors. In addition, we observed that SCCCs isolated from MT shCTRL or shTET2 retained equivalent self-renewal capacity (Figure 8C). These data suggested that TET2 was relevant to SCCC survival and numbers and thus to cancer relapse after chemotherapy without affecting their self-renewal capacity. We observed that complete elimination of TET2 (TET2-KO) delayed subcutaneous tumor regrowth after an effective phase of oxaliplatin treatment (Figure 8D). When measuring tumor regrowth using adapted RECIST criteria (increase of 20% of tumor volume), we observed that progression-free survival (PFS) was significantly longer in TET2-KO tumors after releasing from oxaliplatin treatment (Figure 8E). We also observed that oxaliplatin treatment had a more rapid and potent effect stabilizing the growth of TET2-KO than TET2-WT tumors. This higher sensitivity is in line with the observed increase of intrinsic apoptosis in chemoresistant SCCCs in TET2-KO tumors (Figure 8F).
Figure 8. TET2 determines tumor recurrence.
(A and B) SCCC proportion (n = 4 xenografts per condition) (A) and apoptosis (n = 6–16 xenografts per condition) (B) were evaluated by flow cytometry (A) and caspase-3 (CASP3) immunostaining (B) in the indicated cell lines growing as xenografts in mice treated or not treated with oxaliplatin (OX). Percentage of SCCC measurements: shCTRL OX vs. shTET2 VEH (P ≤ 0.0001)/shTET2 OX (P ≤ 0.001). 1-way ANOVA. (C) MT formation capacity was evaluated for RCCCs and SCCCs isolated from the indicated cell lines. Dots indicate the percentage of MTs grown in each single well. Data are represented as mean ± SEM of triplicates from 3 independent experiments. 2-tailed Student’s t test. (D and E) Evaluation of tumor regrowth after chemotherapy treatment. (D) NOD/SCID mice with established subcutaneous TET2-WT and TET2-KO xenografts were treated with OX. The animals received a total of 3 doses and were maintained for post-treatment observation. Each point represents the mean ± SEM of 20 xenografts. (E) The survival curve represents progression-free survival (PFS) percentages showing the impact of OX on the regrowth of TET2-WT or -KO xenografts. A 20% increase in tumor volume after treatment release was considered as regrowth or progression. Significance was calculated using the log-rank (Mantel-Cox) test. HR, hazard ratio; log-rank P value. (F) Representative pictures of SCCC apoptosis evaluated by CASP3 immunostaining in indicated xenografts. (B and F) Scale bars: 100 μm; high-magnification scale bars: 20 μm. Hoechst was used as nuclei counterstain. White arrowheads, SCCCs. (A and C) *P ≤ 0.05; **P ≤ 0.01; ****P ≤ 0.0001.
In summary, our data indicate that TET2 is required for the survival and number of chemoresistant SCCCs in growing tumors, and thus it could determine the time to recurrence.
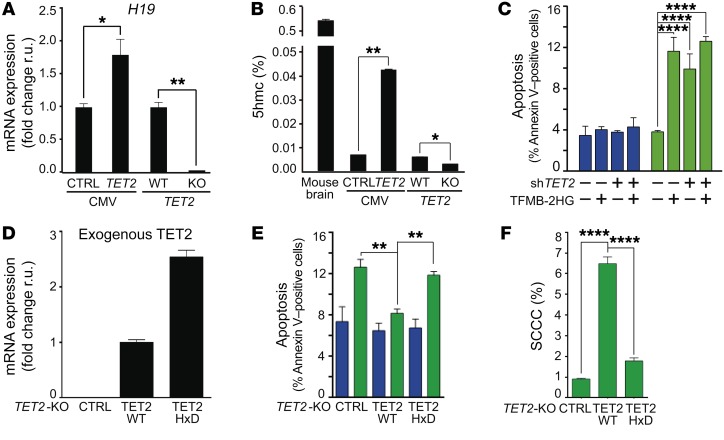
We then studied the specific contribution of TET2 enzymatic activity controlling SCCC survival. First, TET2 overexpression increased and its knockout reduced the global levels of 5hmC in CRC-SW1222 genomes and the expression of its target gene H19 (Figure 9, A and B, and refs. 32, 33). Second, a cell membrane–permeable competitive inhibitor of TET2 enzymatic activity, TFMB-(R)-2HG, which blocks the capacity of TET2 to oxidize 5mC to 5hmC (34), reproduced SCCC-exclusive apoptosis (Figure 7B and Figure 9C). Third, re-expression of a full-length TET2-WT in SW1222 TET2-KO cells was capable of rescuing SCCC apoptosis and numbers, whereas a TET2-HxD mutant lacking enzymatic activity did not (ref. 35; Figure 9, D–F; and Supplemental Figure 6, D–F). Altogether these data indicated that it was the enzymatic activity of TET2, oxidizing genomic 5mC to 5hmC, and not simply TET2 expression that was responsible for controlling SCCC survival.
Figure 9. SCCC survival depends on TET2 enzymatic activity.
(A) Expression of H19 gene measured by qPCR. (B) Percentage of 5hmC in total genomic DNA from mouse brain or the indicated cell lines. (C) Evaluation of apoptosis by flow cytometry in RCCCs and SCCCs after cell-permeable 2-hydroxyglutarate (TFMB-2HG) exposure. Apoptosis measurements: shCTRL/shTET2 RCCC VEH/TFMB-2HG vs. shCTRL SCCC TFMB-2HG (P ≤ 0.0001); shCTRL/shTET2 RCCC VEH/TFMB-2HG vs. shTET2 SCCC VEH/TFMB-2HG (P ≤ 0.0001); shCTRL SCCC VEH vs. shCTRL/shTET2 SCCC TFMB-2HG (P ≤ 0.0001); shCTRL SCCC VEH vs. shTET2 SCCC VEH (P ≤ 0.0001); shTET2 SCCC VEH vs. shTET2 SCCC TFMB-2HG (P ≤ 0.01). (D) Expression of exogenous TET2 (TET2-WT or -HxD FLAG-tagged) was evaluated by qPCR in the indicated cell lines. Specific primers for TET2 (forward) and FLAG (reverse) were used. (E and F) Analysis of apoptosis (E) and proportion of SCCCs (F) was performed by flow cytometry in the indicated cell lines. Apoptosis measurements: TET2-KO RCCC vs. TET2-KO SCCC (P ≤ 0.001); TET2-KO/-HxD RCCC vs. TET2-HxD SCCC (P ≤ 0.01); TET2-KO SCCC vs. TET2-WT/-HxD RCCC (P ≤ 0.001); TET2-WT RCCC vs. TET2-HxD SCCC (P ≤ 0.001). (C, E, and F) Blue bars, RCCCs; green bars, SCCCs. (A–F) Data are represented as mean ± SEM (B, C, E, and F) or ± SD (A and D) of triplicates from 3 independent experiments. (A and B) 2-tailed Student’s t test. (C, E, and F) 1-way ANOVA. (A–C, E, and F) *P ≤ 0.05; **P ≤ 0.01; ****P ≤ 0.0001. All analyses were performed in the indicated SW1222-H2BeGFP cell lines growing as MTs.
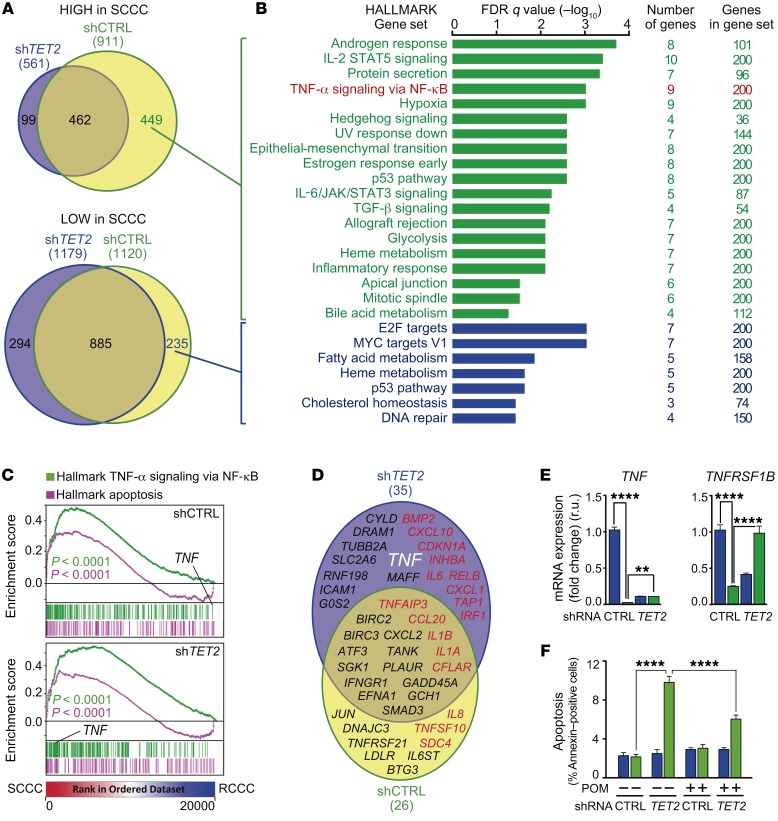
We then analyzed the gene expression profile of FACS-isolated SCCCs and RCCCs from MT-CRC-SW1222 expressing shCTRL or shTET2 (Supplemental Table 3). We observed a global impact of TET2 on gene expression in SCCCs (Figure 10, A and B). TET2-modulated genes were preferentially those expressed more highly in SCCCs than in RCCCs and involved in a wide range of biological functions. We detected a positive enrichment of gene sets related to apoptosis and TNF-α signaling activation in both control and shTET2 SCCCs (Figure 10C). However, certain genes, such as TNF ligand and its receptor TNFRSF1B, were highly expressed in shTET2 SCCCs but not in control SCCCs (Figure 10, C–E), suggesting an enhanced activation of this proapoptotic pathway in the absence of TET2. In this sense, treatment with the TNF-α inhibitor pomalidomide (36, 37) partially rescued the increased apoptosis of shTET2 SCCCs (Figure 10F).
Figure 10. TET2 controls SCCC survival by modulating TNF-α signaling.
(A) Venn diagrams comparing genes highly (top) or lowly (bottom) expressed in SCCCs versus RCCCs isolated from the indicated cell lines. (B) Gene ontology analyses of TET2-induced (green) and TET2-repressed (blue) genes in SCCCs versus RCCCs. (C) GSEA plots showing enrichment of the indicated gene sets in SCCC versus RCCC expression profiles from the indicated cell lines. 1-way ANOVA P value. (D) Genes related to apoptosis were selected from the Molecular Signatures Database (Broad Institute). Venn diagram showing genes related to apoptosis and highly expressed in SCCCs versus RCCCs from the indicated cell lines. Proapoptotic (red) and antiapoptotic (black) genes are shown. The gene of interest is indicated in white (TNF). (E) Expression of the indicated genes was measured by qPCR. TNF mRNA measurements: shCTRL RCCC vs. shTET2 RCCC/SCCC (P ≤ 0.0001); shCTRL SCCC vs. shTET2 RCCC (P ≤ 0.01). TNFRSF1B mRNA measurements: shCTRL RCCC vs. shTET2 RCCC (P ≤ 0.0001); shCTRL SCCC vs. shTET2 RCCC (P ≤ 0.05); shTET2 RCCC vs. shTET2 SCCC (P ≤ 0.0001). (F) Evaluation of apoptosis by flow cytometry in RCCCs and SCCCs of the indicated cell lines after vehicle or pomalidomide (POM) treatment. Apoptosis measurements: shCTRL SCCC/RCCC VEH vs. shTET2 SCCC VEH/POM (P ≤ 0.0001); shTET2 RCCC VEH vs. shTET2 VEH/POM SCCC (P ≤ 0.0001); shTET2 SCCC VEH vs. shCTRL/shTET2 RCCC/SCCC POM (P ≤ 0.0001); shCTRL RCCC/SCCC POM vs. shTET2 SCCC POM (P ≤ 0.0001); shTET2 RCCC POM vs. shTET2 SCCC POM (P ≤ 0.0001). (E and F) Blue bars, RCCCs; green bars, SCCCs. Data are represented as mean ± SD (E) or ± SEM (F) of triplicates from 3 independent experiments. 1-way ANOVA. **P ≤ 0.01; ****P ≤ 0.0001. All analyses were performed in the indicated SW1222-H2BeGFP cell lines growing as MTs.
In summary, our results indicate that TET2 enzymatic activity determines the survival and number of SCCCs by controlling the expression of TNF-α signaling components and restraining its proapoptotic signaling. Our data unmasked TET2 as a survival factor for SCCCs, and thus a potential new drug target for their elimination.
The TET2 product 5hmC is a biomarker to detect chemoresistant SCCCs and predict relapse in patients.
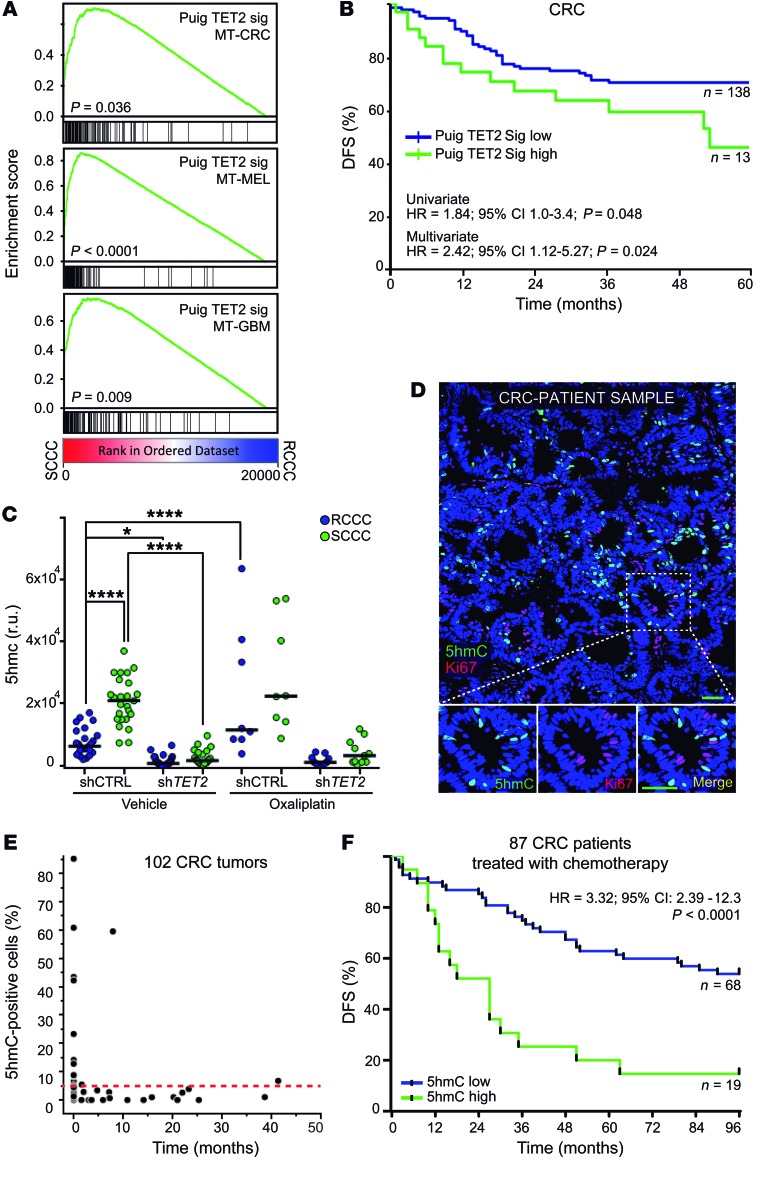
We first captured TET2 activity by defining a gene expression signature built with target genes more highly expressed in SCCCs from shCTRL CRC-SW1222 MTs that were not more highly expressed in SCCCs from shTET2 MTs, when compared with their paired RCCCs. We refined this list by excluding those genes that were not highly expressed in our PanC-SCCC signature (Supplemental Tables 2 and 3). This TET2 signature (Puig TET2 Sig) was positively enriched in SCCCs not only in CRC models but also in MEL and GBM (Figure 11A). More importantly, early stage II and III tumors from CRC patients treated with adjuvant chemotherapy that presented enrichment in TET2 signature relapsed significantly earlier (Figure 11B and Supplemental Table 3).
Figure 11. TET2/5hmC predicts shorter survival in CRC patients.
(A) GSEA plots showing enrichment of TET2 signature in SCCC versus RCCC expression profiles in the indicated models. 1-way ANOVA P value. (B) Disease-free survival (DFS) of chemo-treated high-risk stage II and stage III colon cancer patients (GSE39582, n = 151) according to TET2 signature score. (C) Histological quantification of 5hmC content in RCCCs and SCCCs per image from the indicated xenografts after vehicle or oxaliplatin treatments (n = 5 to 6 xenografts per group). Between 8 and 30 images per condition were evaluated. Data are represented as mean ± SEM. *P ≤ 0.05; ****P ≤ 0.0001, 1-way ANOVA. 5hmC measurements: shCTRL RCCC VEH vs. shCTRL SCCC OX (P ≤ 0.0001); shCTRL SCCC VEH vs. shTET2 RCCC/SCCC VEH/OX (P ≤ 0.0001); shTET2 RCCC/SCCC VEH vs. shCTRL RCCC/SCCC OX (P ≤ 0.0001); shCTRL RCCC/SCCC OX vs. shTET2 RCCC/SCCC OX (P ≤ 0.0001). (D) Immunofluorescence analysis of 5hmC and the proliferation marker (Ki67) in a colorectal cancer patient sample. Scale bar: 100 μm; high-magnification scale bar: 20 μm. (E) Dot plot correlating the percentage of 5hmC-positive versus Ki67-positive cells quantified by immunofluorescence and immunohistochemistry, respectively, in primary tumors (n = 55) and liver metastases (n = 47) from CRC patients. Red dashed line indicates the cutoff value above which a sample was considered high for 5hmC (5%). (F) DFS of chemo-treated CRC (Vall d’Hebron Institute of Oncology tissue microarray cohort, n = 87) patients. Tumors were considered 5hmC-high when at least 5% of tumor cells presented signal equal to or higher than that of adjacent stroma, and 5hmC-low when fewer than 5% of tumor cells did. Negative tumors did not show any detectable 5hmC signal in cancer cells. Negative tumors are included as 5hmC-low. (B and F) HR, hazard ratio. P values were calculated using Cox proportional hazards model.
We then confirmed by immunohistochemistry that cells accumulating high 5hmC levels also presented high TET2 protein and observed a positive correlation between both in a cohort of 83 CRC cases (Supplemental Figure 7, A and B). This correlation was validated by measurement of TET2 mRNA in an independent cohort of 53 CRC patients’ tumors (Supplemental Figure 7C). Furthermore, shTET2 xenografts showed lower 5hmC amounts than controls, whereas oxaliplatin only increased this mark in shCTRL tumors where treatment enriched SCCC proportion (Figure 8A and Figure 11C). Finally, we confirmed that 5hmC-positive cells were negative for Ki67 proliferation marker in tumors from CRC patients (Figure 11D). Indeed, tumor samples with a high proportion of 5hmC-positive cells were negative for Ki67 proliferation marker and vice versa (Figure 11E and Supplemental Figure 7D). These data demonstrated that 5hmC was a robust biomarker of TET2 activity in tumor tissue.
We then analyzed a cohort of 87 baseline stage II or III primary tumors from CRC patients treated with adjuvant chemotherapy after curative surgery, and observed that 5hmC predicted relapse (Figure 11F and Supplemental Table 4). When we increased this CRC cohort, adding nontreated patients (n = 108), we also observed that 5hmC predicted shorter PFS independently of other factors relevant to patient prognosis including age, sex, tumor stage, tumor site, microsatellite status, KRAS or BRAF oncogenic mutations, and chemotherapy treatment (Supplemental Table 4).
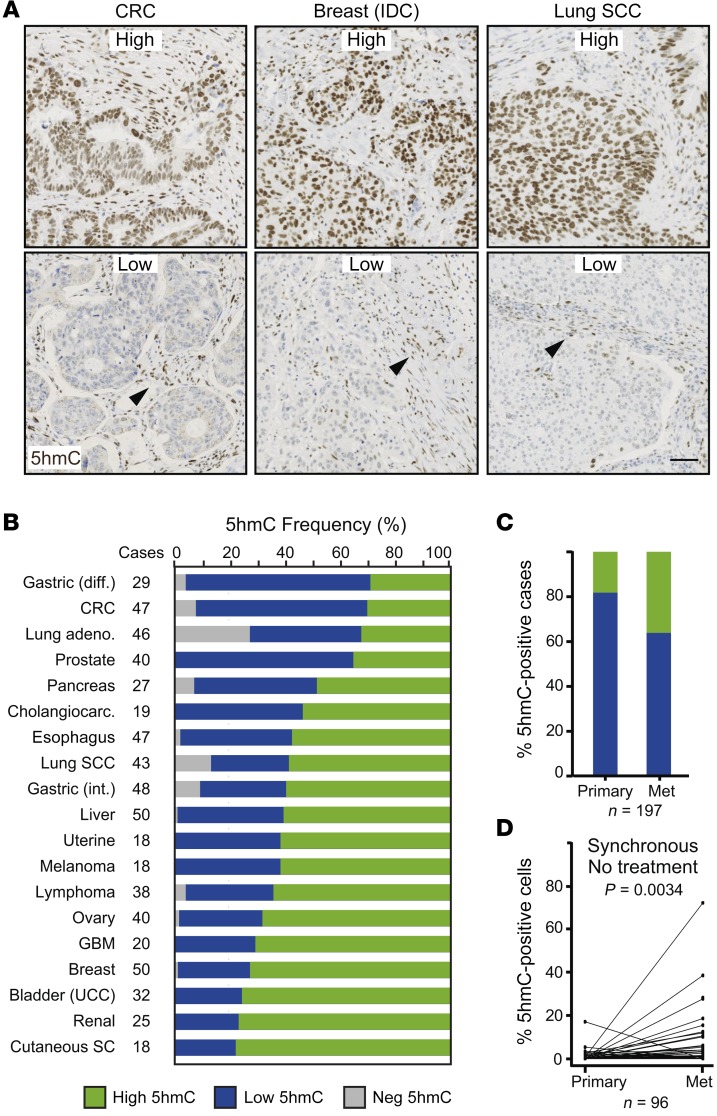
We then evaluated the landscape of 5hmC across 656 patient tumor samples spanning 19 different types of cancer (Figure 12, A and B, and Supplemental Table 4). First, we observed that the proportion of cases with high accumulation of 5hmC significantly varied across different tumor types, ranging from 30% in diffuse gastric cancer to 80% in renal tumors (Figure 12B). We also detected a higher proportion of 5hmC-positive cases in liver metastases (38%) compared with paired primary tumors (18%) in a cohort of 197 CRC patients (Figure 12C and Supplemental Table 5). This was even confirmed in a subset of 96 synchronous cases that did not receive treatment prior to sample collection (Figure 12D).
Figure 12. 5hmC levels across cancer types.
(A and B) 5hmC levels were evaluated by immunohistochemistry on a tissue microarray containing 656 patient samples from 19 different tumor types. (A) Representative pictures showing high and low levels of 5hmC from 3 different cancer types. IDC, invasive ductal carcinoma; SCC, squamous cell carcinoma. Arrowheads: 5hmC-positive stromal cells used as internal control staining. Scale bar: 100 μm. (B) Proportion of tumor samples with different amounts of 5hmC for each cancer type. Tumors were considered 5hmC-high when at least 5% of tumor cells presented signal equal to or higher than that of adjacent stroma, and 5hmC-low when fewer than 5% of tumor cells did. Negative (NEG) tumors did not show any detectable 5HmC signal in cancer cells. Diff, diffuse; int, intestinal; CRC, colorectal cancer; UCC, urothelial carcinoma; GBM, glioblastoma; SC, sebaceous carcinoma. (C and D) Histological quantification of 5hmC in paired primary tumor and liver metastases of CRC patients evaluated by immunofluorescence on formalin-fixed, paraffin-embedded sections. (C) Proportion of 5hmC-positive (green) and -negative (blue) cases (n = 197). (D) Paired comparison of primary tumors and liver metastases from synchronous nontreated patients (n = 96) from the cohort analyzed in C. P value of Wilcoxon paired test.
In summary, our data provide a general overview of 5hmC levels across multiple tumor types and show their value as a biomarker to predict patients’ disease progression in colorectal cancer.
Discussion
With our inducible H2BeGFP strategy we revealed the existence of a minor proportion of SCCCs in different cancer types as biologically diverse as colorectal, melanoma, and glioblastoma. More importantly, these chemoresistant cancer cells with cancer-initiating capacity shared a core molecular identity despite their intrinsic disparity of mutations or epigenetic programs inherited from their somatic tissues of origin. Our results uncovered the existence of a nongenetic primitive program governing dormancy that could be common in slow-cycling cells across different tumor types.
Particular epigenetic codes imposed by a precise circuit of enzymes could coordinate such expression patterns as effective nongenetic mechanisms governing SCCC distinctive phenotype. For instance, KDM5B/JARID1B is a histone demethylase expressed in a minor population of SCCCs with enhanced capacity to fuel long-term melanoma growth (14). Importantly, melanoma shows high plasticity and JARID1B-positive and -negative cells can originate from each other. Similarly, we observed that FACS-isolated colorectal SCCCs and RCCCs could generate each other after a second DOX pulse chase. We therefore concluded that slow cycling is a temporary state that proliferating cells eventually acquire during solid tumor growth. This could occur multiple times at different anatomical parts of a solid tumor wherein SCCCs reside as drug-resistant seeds, triggering proliferation after therapy, initiating tumor regrowth and relapse in patients.
Our analyses actually revealed a group of epigenetic modulators more highly expressed in SCCCs, such as PHC3, ARID4A, CIR1, and KDM5A, that could be responsible for the repressed expression of the observed compendium of genes implicated in cell proliferation and energy metabolism. KMT2E and TET2 could contrarily sustain higher expression of a panel of genes distinctive of SCCCs. In fact, the activity of both epigenetic factors has been described as regulated by the O-linked N-acetylglucosamine (O-GlcNAc) transferase (OGT) in particular loci with active gene expression (38). Further studies will be required to clarify the mechanism of action of these epigenetic nodes in controlling gene expression in SCCCs.
Here we focused on TET2 epigenetic enzyme as a key factor controlling the fate of cancer cells in a slow-cycling stage within growing tumors. TET2 eliminates 5mC by catalyzing its consecutive transformation to 5hmC, 5-formylcytosine (5fC), and 5-carboxylcytosine (5caC), followed by hymine-DNA-glycosylase–dependent (TDG-dependent) base excision repair (BER) (16, 39, 40). TET2 can activate genes by removing 5mC from hypermethylated CpG islands and distant regulatory enhancers. In this sense, we observed that exogenous TET2 elimination reduced global genomic 5hmC levels and deeply altered the gene expression profile of SCCCs, including many genes such as H19 previously described as regulated by 5mC/5hmC marks (32, 33).
Mapping the distribution of 5mC and 5hmC in SCCC genomes will be crucial in linking TET2-dependent phenotypes with the epigenetic regulation of specific loci and thus the expression of direct target genes. Unfortunately, SCCCs represent a very minor proportion of cancer cells within a growing tumor (up to 3% H2BeGFP label–retaining cells), preventing the profiling of their methylome/hydroxymethylome or many of their other biochemical traits. The future establishment of protocols to map these epigenetic marks from very low amounts of cells and genomic DNA will be key in unmasking the role of TET2 in SCCC biology.
Despite these limitations, we have described TET2 as crucial in balancing survival and apoptosis in SCCCs by controlling the expression of a complete set of cell death–related genes moderating TNF-α ligand levels and its proapoptotic signaling. Abrogation of TET2 reduced, and its overexpression increased, SCCC proportion despite its lack of effect on general growth or apoptosis. These data suggest that for different types of tumors, TET2 activity might only be critical for cancer cells when transiting to and/or consolidating a slow-cycling state, sustaining their survival when exposed to soporiferous and/or life-threatening stimuli. In fact, SCCC gene expression profile indicated the activation of genes that respond to hypoxia or nutrient deprivation — both stimuli known to compromise cell survival and promote slow proliferation. In this manner, tumors with higher TET2 activity would be prompted to accumulate a higher proportion of chemoresistant SCCCs. We show that TET2 elimination induces SCCC apoptosis, determines tumor regrowth after chemotherapy, and prolongs PFS in mice. Indeed, we observed that CRC patients with tumors enriched in TET2 signature or with high 5hmC levels relapsed earlier after surgery and chemotherapy. We also observed that our SCCC signature was enriched in patients with glioblastomas or CRC tumors subtyped as mesenchymal who showed worst survival. It also predicted relapse in CRC patients treated with adjuvant chemotherapy. In summary, our data uncovered an unpredicted oncogenic hue of TET2 determining numbers and survival of chemoresistant SCCCs, thus increasing the risk of relapse and reducing the survival of cancer patients. However, previous studies have mostly described TET2 as a tumor suppressor and therefore apparently contradict our findings. TET2 is frequently inactivated by truncating mutations in different tumor types, leading to reduced 5hmC levels and promoting hyperproliferation of progenitor cancer cell populations (40). In this sense, most studies indicate that low 5hmC tumoral levels correlate with worse patient survival (41–44).
Furthermore, some loss-of-function studies showed the capacity of TET2 in restraining general proliferation of cancer cells and tumor growth (45). Our data do not necessarily conflict with this tumor suppressor view, but would otherwise suggest that in some tumors TET2 could restrain proliferation in only a minor proportion of cells entering a slow-cycling status (SCCCs) as opposed to the majority of cycling cells in the tumor bulk. We indeed observed that 5hmC staining and Ki67 staining were mutually exclusive, marking distinctive cancer cell populations even in tumor samples (regions) with high enrichment of 5hmC (46–48).
In addition, the methods used to quantify 5hmC in different studies are quite diverse and include immunohistochemistry, ELISA, mass spectrometry, and dot blot, preventing a consensus on its value as a biomarker in cancer. A future standardization of these methods will be crucial to establish a cutoff to catalog 5hmC-positive versus -negative cases and to conclude on its value as a prognostic biomarker. In this sense, our new insights into intratumoral cell heterogeneity at the levels of proliferation and TET2/5hmC activity could be clinically relevant. To predict patient progression more precisely, we propose not simply evaluating 5hmC levels as an absolute value per tumor, but considering the existence of minor 5hmC-positive populations as chemoresistant SCCCs responsible for relapse. Future studies on larger cohorts of patients with detailed clinical annotation and under homogeneous treatments will be required to confirm the value of measuring SCCC and TET2 activity as predictive biomarkers of patients’ progression and survival.
The major goal of this study was to identify drug targets for eradicating resistant SCCCs or DTCs and thus reduce patients’ relapse. Unfortunately, few therapies directed against DTCs have proven effective thus far. The most promising results have been reported in hematological tumors where mobilization of DTCs by different factors, such as G-CSF or IFN-α, sensitizes them to chemotherapy (49, 50).
In solid tumors such as CRC, single cells with equivalent cancerous genomes showed distinct capacities to resist chemotherapy (oxaliplatin) (51). These dormant and hidden genetic clones, which were only detectable after enrichment by oxaliplatin, could be responsible for relapse after therapy. In this sense, our data revealed that SCCCs expressed low levels of TYMS, TOP2A, or TUBB genes, which are targets of standard chemotherapies. These mechanisms could therefore confer SCCC passive resistance to antiproliferative drugs.
We also observed that SCCCs from different tumor types expressed a variety of detoxifying enzymes and pumps that would confer active drug resistance on them. Pharmacological inhibition of a single target, as we noted for ABCG2, would not be sufficient to sensitize SCCCs to chemotherapy. Alternatively, we propose the inhibition of TET2 activity as a key regulator of their survival. We actually show that SCCC survival was rescued in TET2-KO cells with a full-length TET2 wild type but not TET2-HxD mutant without enzymatic activity. In this line, TET2 blockade by TFMB-2HG promoted SCCC apoptosis, corroborating that its enzymatic activity oxidizing genomic 5mC to 5hmC is crucial for SCCC survival. Indeed, oxaliplatin treatment was more effective reducing the growth of TET2-KO tumors that presented intrinsic apoptosis of chemoresistant SCCCs. Future TET2 inhibitors, combined with chemotherapeutics against proliferative cancer cells, could therefore be effective as adjuvant therapy to clear out residual SCCCs as well as prevent relapse in patients. Since metastases showed higher levels of 5hmC, these inhibitors may also be effective in delaying disease progression and the appearance of new metastatic lesions in patients with advanced disease.
Our results have uncovered certain molecular intricacies of SCCCs and expanded our understanding surrounding their distinctive behavior. They indicate 5hmC as a biomarker for detection of chemoresistant SCCCs predictive of worse survival, and TET2 as a potential drug target for their elimination. These two insights could be translated into the clinic in the future in order to improve cancer therapeutics and extend survival of our patients.
Methods
Cell lines and patient-derived cells.
CRC-SW1222 cells were provided by Meenhard Herlyn (Wistar Institute, Philadelphia, PA). Primary MEL-MMLN9 and MEL-MMPG3 cells were derived from melanoma patients. Primary GBM-e216 and GBM-e225 glioblastoma and CRC-T70 colorectal models were generated as previously described (18, 52). All cancer models, cell lines, and patient-derived cells were transduced with lentiviruses expressing H2BeGFP protein (pSIN-TRE-H2BeGFP-hPGK-rtTA2). Knockdown cell derivatives were generated by expression of different nontargeting shRNA (shCTRL) and TET2 TRC-shRNA (shTET2). After transduction, cells were selected with puromycin (Life Technologies) (1 μg/ml). TET2-KO and -WT (scramble) cell lines were generated using a CRISPR/Cas9 system. CRC-SW1222-H2BeGFP cells were transfected with pSpCas9-sgRNATET2guide2-2A-GFP or pSpCas9-sgRNAscramble-2A-GFP constructs using linear polyethylenimine (PEI 25000, Polysciences Inc.). Forty-eight hours after transfection, cells were pelleted and sorted using FACS with a FACS Aria II cell sorter (BD Biosciences). Single cells were expanded to obtain individual clones. Genomic DNA was isolated from edited clones and nonedited CRC-SW1222-H2BeGFP control cells. A 100-bp fragment of exon 1 of TET2 was amplified by PCR using genomic DNA–specific primers (Supplemental Table 6), and PCR products were analyzed by next-generation sequencing (Illumina HighSeq). To generate stable overexpressing cell lines, CRC-SW1222-H2BeGFP TET2-WT and TET2-KO cells were transfected with pCMV6-Entry (CMV-CTRL), pCMV6-TET2 WT (CMV-TET2), or pCMV6-TET2 HxD (CMV-TET2 HxD) plasmids using X-tremeGENE HP DNA Transfection Reagent (Roche) according to the manufacturer’s protocol. After transfection, cells were selected with geneticin (Gibco) (500 μg/ml). Plasmids used in this study are described in Supplemental Methods.
For doxycycline (DOX) pulse chase, cells were treated with 5 μg/ml of DOX for at least 3 days. Next, cells continued to grow in DOX-free medium. For each experiment, detailed description is provided in Supplemental Methods.
Mice, xenografts, and tumor growth.
Four-week-old female NOD/SCID (NOD.CB17-Prkdcscid/NcrCrl) and nude (Crl:NU-Foxn1nu) mice were purchased from Charles River Laboratories. Cells were resuspended in PBS, mixed 1:1 with Matrigel, and injected s.c. into both flanks of mice. Within 2 weeks tumors were detectable. When matching endpoint criteria, mice were euthanized and parts of the xenograft tumors were processed to again obtain cell suspensions as previously described (18) or fixed for histological analysis. Tumors were measured 3 times per week, and volume was estimated using the following formula: V = (length × width2)/2, where length represents the largest tumor diameter and width represents the perpendicular tumor diameter. For e225-H2BeGFP orthotopic injections, 3 × 10⁵ tumor cells from disaggregated patient-derived neurospheres were stereotactically inoculated into the corpus striatum of the right brain hemisphere (1 mm anterior and 1.8 mm lateral to the bregma; 2.5 mm intraparenchymal) of NOD/SCID mice. Tumor growth was monitored by a Xenogen IVIS Spectrum system.
For DOX pulse chase, mice were treated with 2 mg/ml of DOX ad libitum in drinking water until tumors reached between 5 and 8 mm in diameter. Next, treatment was removed until the end of the experiment. For each experiment, detailed description is provided in Supplemental Methods.
For BrdU (5-bromo-2′-deoxyuridine) and EdU (5-ethynyl-2′-deoxyuridine) pulse chase, mice received 2 i.p. injections of BrdU (50 mg/kg body weight; Sigma-Aldrich) or EdU (50 mg/kg body weight; Invitrogen) 48 hours before and the same day as DOX removal.
In vitro and in vivo chemoresistance.
For in vitro assays, minitumors (MTs) were grown embedded in Matrigel from CRC-SW1222 or in suspension from MEL-MMLN9 and GBM-e216 cancer models infected with H2BeGFP. After a DOX (5 μg/ml) pulse-chase treatment, cells were treated with 20 μM oxaliplatin, 250 μM light-activated dacarbazine, or 125 μM temozolomide (Sigma-Aldrich), respectively, for an additional 5 days before apoptosis was measured. For fumitremorgin C assay, Matrigel-embedded MTs were treated with DOX (pulse) 9 days. Then DOX was removed, and 7 days later MTs were pretreated with 5 μM fumitremorgin C (Sigma-Aldrich). The next day, 20 μM of oxaliplatin was added to MTs. Five days after treatments, single cells were obtained as described in Supplemental Methods, and apoptosis and SCCC proportion were measured by flow cytometry. Data are represented as mean ± SEM from 3 independent experiments.
For in vivo assays, nude or NOD/SCID mice were injected s.c. in both flanks with CRC-SW1222-H2BeGFP, shCTRL, or shTET2 cell lines as described above. Between 6 and 20 xenografts per cell line and treatment were grown (vehicle and oxaliplatin). Four days after s.c. cell injection, doxycycline (+ DOX) was added to the drinking water. DOX induced H2BeGFP expression in cancer cells during 7 days (pulse) while tumors were growing. Then doxycycline was removed (– DOX), allowing H2BeGFP dilution (chase) until the end of the experiment 13 days later. Seven days after DOX removal, when H2BeGFP was diluted, we administered 10 mg/kg oxaliplatin. A second oxaliplatin dose was administered 10 days after DOX removal, and 3 days later mice were sacrificed and tumor tissues collected and fixed. Depending on the experiment, after mice were euthanized, whole tumors were used for caspase-3 evaluation, or 1 part of each xenograft tumor was processed to obtain cell suspensions that were analyzed for apoptosis and/or SCCC proportion by flow cytometry, and the other part was fixed for caspase-3 assessment by IHC-fluorescence. Apoptosis assays are detailed in Supplemental Methods.
For in vivo regrowth assays, NOD/SCID mice were injected s.c. in both flanks with CRC-SW1222-H2BeGFP TET2-WT or TET2-KO cell lines. Twenty xenografts per cell line were grown. After a DOX pulse-chase treatment, oxaliplatin was administered once per week by i.p. injection during 3 weeks. Then, xenografts were led to grow without treatment until the endpoint of the experiment. Throughout the experiment, tumors were measured 3 times per week, and volume was estimated as described above.
For PFS analysis, after oxaliplatin treatment release we defined regrowth or progression as when s.c. tumors increased at least 20% in volume, taking as reference the smallest volume on study (this includes the baseline if that is the smallest on study).
Reverse transcription and quantitative PCR.
To analyze the expression of selected genes in RCCCs and SCCCs, the resulting single-stranded DNA obtained from the total RNA linearly amplified for microarray analysis (described above) was used as input (2 ng) for quantitative PCR (qPCR). To analyze expression genes from other cell lines, RNA was extracted and used to synthesize cDNA using Superscript III reverse transcriptase with oligo-dT and random hexamer primers (Life Technologies). A 7900HT qPCR System was used with Power SYBR-Green (Applied Biosystems) and specific pairs of primers (Supplemental Table 6) to detect the indicated transcripts. Relative gene expression was determined by the comparative CT method (53). We applied geNorm algorithms (54) to select TATA-binding protein (TBP) and peptidylprolyl isomerase A (cyclophilin A, PPIA) as the most stable reference transcripts. The geometric means of the expression values for both housekeeping genes were used to normalize the expression and to calculate the normalized SD of all transcripts analyzed. Relative expression levels were calculated after normalization. Data were represented as mean ± SD of triplicates from 3 independent experiments.
Data deposition.
The gene expression microarray data sets reported in this article were deposited in ArrayExpress with accession number E-MTAB-4004.
Statistics.
Data presented in figures are represented as mean ± SEM. For qPCR analyses, fold changes were expressed relative to the RCCC values unless otherwise stated, and data are represented as mean ± SD. A P value less than 0.05 was considered significant; *P ≤ 0.05, **P ≤ 0.01, ***P ≤ 0.001, ****P ≤ 0.0001. Statistical tests used are reported in the figure legends. In summary, statistical analyses were performed in GraphPad Prism 6 (GraphPad Software Inc.) using a 2-tailed Student’s t test to compare differences between 2 groups or 1-way ANOVA with multiple-comparisons tests to compare 3 or more groups. Statistical tests used for the analyses of transcriptomes (microarrays and gene set enrichment analysis) were performed in Partek Genomic Suite software (Partek Inc.). R statistical software was used to determine significance differences in Figure 4, D and E; Figure 5, G and H; Figure 11B; Figure 12, C and D; and Supplemental Figure 4D. The Cox proportional hazards model was used for analyzing significance in overall and disease-free survivals. Overall survival was calculated in GraphPad Prism 6. We used Cox proportional hazards univariate and multivariate modeling with R package “survival” to analyze disease-free survival. Drug sensitivity of cancer cell lines was analyzed using Wilcoxon test. Puig PanC-SCCC signature comparison with CRC and GBM consensus subtypes was tested with a Kruskal-Wallis test. For microarray analysis, fold change statistical significance was calculated using parametric 2-tailed t test. One-way ANOVA was used for analyzing significance in gene set enrichment analysis. The correlation between 5hmC content and TET2 mRNA expression (Supplemental Figure 7C) in CRC samples was evaluated using a Pearson’s test.
Additional experimental procedures and more details about statistical analyses can be found in Supplemental Methods.
Study approval.
Experiments with mice were conducted following the European Union’s animal care directive (86/609/CEE) and were approved by the Ethical Committee of Animal Experimentation of the Vall d’Hebron Research Institute (approval ID, 40/08 CEEA, 47/08 CEEA, 06/12 CEEA, 87/12 CEEA, 17/15 CEEA, and 18/15 CEEA). Human tumor samples for PDX were obtained after approval from the Ethics Committee of the Vall d’Hebron University Hospital [approval ID, PR(IR)79/2009]. Written informed consent was signed by all patients. The construction of tissue microarrays was performed in accordance with the Swiss Human Research Act (of January 2014) and approved by the regional ethical committee (Ethikkommission Nordwest- und Zentralschweiz; permission number 361/12).
Author contributions
IP performed most of the experiments, helped in their design, and contributed to writing the manuscript. SPT cloned the H2BeGFP-expressing lentivirus, helped on initial experiments for functional validation, and analyzed most of the gene expression data. IC, OA, JMQ, ECB, and LR contributed to the execution of some experiments. PG, AGA, and OC designed, developed, and analyzed the experiments on tumor xenografts. SA helped with the design and cloning of the H2BeGFP-expressing lentivirus. CE contributed to analyzing TET2 target genes. AP designed gene expression profiles with Nanostring nCounter platform. GA helped with the selection and analysis of colorectal cancer samples and interpretation of patients’ data. SL, PN, and LT provided cancer patients’ samples. VS, A Villaneuva, JS, AS, and JAR provided PDX models of different tumor types. A Vivancos and GC supervised the mutational data on all samples genotyped. RD analyzed tumor gene expression data and helped with their clinical interpretation. JT supervised the study. HGP designed and supervised the whole project, compiled the manuscript, drew the figures, and developed the initial experiments with H2BeGFP-infected cancer cell models. HGP is a member of the EuroPDX Consortium.
Supplementary Material
Acknowledgments
We thank Meenhard Herlyn for providing the SW1222 cell line. We acknowledge Irene Sales and Ricardo Gonzalo for helping on FACS and microarray experiments, respectively. We very much thank Amanda Wren for her assistance preparing the English manuscript, and Fundación Cellex for its institutional support. IP was supported by Fundación Científica de la Asociación Española Contra el Cancer. SPT was supported by Fundación Olga Torres and Red Temática de Investigación Cooperativa en Cancer (RD12/0036/0012). OA and JMQ were supported by the Agència de Gestió d’Ajuts Universitaris i de Recerca. Work developed by PG and AGA was supported by Ministerio de Economía y Competitividad SAF2014-52050-R. The project was funded by Instituto de Salud Carlos III through 4 consecutive grants (PI08/1356, PI11/02499, PI14/00103, PI17/00945), CIBERONC Network, TRANSCAN-TACTIC (AC15/00064), and a Miguel Servet contract granted to HGP (MSII14/00037).
Version 1. 06/26/2018
In-Press Preview
Version 2. 08/06/2018
Electronic publication
Version 3. 08/31/2018
Print issue publication
Funding Statement
The project was funded by Instituto de Salud Carlos III (ISCIII) through four consecutive grants.
Two consecutive grants.
Footnotes
Conflict of interest: The authors have declared that no conflict of interest exists.
Reference information: J Clin Invest. 2018;128(9):3887–3905.https://doi.org/10.1172/JCI96393.
Contributor Information
Isabel Puig, Email: ipuig@vhio.net.
Stephan P. Tenbaum, Email: stenbaum@gmail.com.
Irene Chicote, Email: ichicote@vhio.net.
Oriol Arqués, Email: oarques@vhio.net.
Jordi Martínez-Quintanilla, Email: jmartinez@vhio.net.
Estefania Cuesta-Borrás, Email: ecuesta@vhio.net.
Lorena Ramírez, Email: lramirez@vhio.net.
Pilar Gonzalo, Email: pgonzalo@cnic.es.
Atenea Soto, Email: ateneasoto@gmail.com.
Susana Aguilar, Email: susaguilar1975@yahoo.es.
Cristina Eguizabal, Email: CRISTINA.EGUIZABALARGAIZ@osakidetza.eus.
Ginevra Caratù, Email: gcaratu@vhio.net.
Aleix Prat, Email: APRAT@VHIO.NET.
Guillem Argilés, Email: gargiles@vhio.net.
Stefania Landolfi, Email: slandolfi@vhebron.net.
Oriol Casanovas, Email: ocasanovas@iconcologia.net.
Violeta Serra, Email: vserra@vhio.net.
Alberto Villanueva, Email: avillanueva@iconcologia.net.
Alicia G. Arroyo, Email: agarroyo@cnic.es.
Luigi Terracciano, Email: luigi.terracciano@usb.ch.
Paolo Nuciforo, Email: pnuciforo@vhio.net.
Joan Seoane, Email: jseoane@vhio.net.
Juan A. Recio, Email: juan.recio@vhir.org.
Ana Vivancos, Email: avivancos@vhio.net.
Rodrigo Dienstmann, Email: rdienstmann@vhio.net.
Josep Tabernero, Email: jtabernero@vhio.net.
Héctor G. Palmer, Email: hgpalmer@vhio.net.
References
- 1.Jemal A, Bray F, Center MM, Ferlay J, Ward E, Forman D. Global cancer statistics. CA Cancer J Clin. 2011;61(2):69–90. doi: 10.3322/caac.20107. [DOI] [PubMed] [Google Scholar]
- 2.Dieter SM, et al. Distinct types of tumor-initiating cells form human colon cancer tumors and metastases. Cell Stem Cell. 2011;9(4):357–365. doi: 10.1016/j.stem.2011.08.010. [DOI] [PubMed] [Google Scholar]
- 3.Kreso A, O’Brien CA. Colon cancer stem cells. Curr Protoc Stem Cell Biol. 2008;Chapter 3:Unit 3.1. doi: 10.1002/9780470151808.sc0301s7. [DOI] [PubMed] [Google Scholar]
- 4.Sosa MS, Bragado P, Aguirre-Ghiso JA. Mechanisms of disseminated cancer cell dormancy: an awakening field. Nat Rev Cancer. 2014;14(9):611–622. doi: 10.1038/nrc3793. [DOI] [PMC free article] [PubMed] [Google Scholar]
- 5.Tumbar T, et al. Defining the epithelial stem cell niche in skin. Science. 2004;303(5656):359–363. doi: 10.1126/science.1092436. [DOI] [PMC free article] [PubMed] [Google Scholar]
- 6.Wilson A, et al. Hematopoietic stem cells reversibly switch from dormancy to self-renewal during homeostasis and repair. Cell. 2008;135(6):1118–1129. doi: 10.1016/j.cell.2008.10.048. [DOI] [PubMed] [Google Scholar]
- 7.Buczacki SJ, et al. Intestinal label-retaining cells are secretory precursors expressing Lgr5. Nature. 2013;495(7439):65–69. doi: 10.1038/nature11965. [DOI] [PubMed] [Google Scholar]
- 8.Foudi A, et al. Analysis of histone 2B-GFP retention reveals slowly cycling hematopoietic stem cells. Nat Biotechnol. 2009;27(1):84–90. doi: 10.1038/nbt.1517. [DOI] [PMC free article] [PubMed] [Google Scholar]
- 9.dos Santos CO, et al. Molecular hierarchy of mammary differentiation yields refined markers of mammary stem cells. Proc Natl Acad Sci U S A. 2013;110(18):7123–7130. doi: 10.1073/pnas.1303919110. [DOI] [PMC free article] [PubMed] [Google Scholar]
- 10.Cotsarelis G, Sun TT, Lavker RM. Label-retaining cells reside in the bulge area of pilosebaceous unit: implications for follicular stem cells, hair cycle, and skin carcinogenesis. Cell. 1990;61(7):1329–1337. doi: 10.1016/0092-8674(90)90696-C. [DOI] [PubMed] [Google Scholar]
- 11.Blanpain C, Simons BD. Unravelling stem cell dynamics by lineage tracing. Nat Rev Mol Cell Biol. 2013;14(8):489–502. doi: 10.1038/nrm3625. [DOI] [PubMed] [Google Scholar]
- 12.Pece S, et al. Biological and molecular heterogeneity of breast cancers correlates with their cancer stem cell content. Cell. 2010;140(1):62–73. doi: 10.1016/j.cell.2009.12.007. [DOI] [PubMed] [Google Scholar]
- 13.Chen J, et al. A restricted cell population propagates glioblastoma growth after chemotherapy. Nature. 2012;488(7412):522–526. doi: 10.1038/nature11287. [DOI] [PMC free article] [PubMed] [Google Scholar]
- 14.Roesch A, et al. A temporarily distinct subpopulation of slow-cycling melanoma cells is required for continuous tumor growth. Cell. 2010;141(4):583–594. doi: 10.1016/j.cell.2010.04.020. [DOI] [PMC free article] [PubMed] [Google Scholar]
- 15.Ponnaluri VK, Maciejewski JP, Mukherji M. A mechanistic overview of TET-mediated 5-methylcytosine oxidation. Biochem Biophys Res Commun. 2013;436(2):115–120. doi: 10.1016/j.bbrc.2013.05.077. [DOI] [PubMed] [Google Scholar]
- 16.Wu H, Zhang Y. Mechanisms and functions of Tet protein-mediated 5-methylcytosine oxidation. Genes Dev. 2011;25(23):2436–2452. doi: 10.1101/gad.179184.111. [DOI] [PMC free article] [PubMed] [Google Scholar]
- 17.Yeung TM, Gandhi SC, Wilding JL, Muschel R, Bodmer WF. Cancer stem cells from colorectal cancer-derived cell lines. Proc Natl Acad Sci U S A. 2010;107(8):3722–3727. doi: 10.1073/pnas.0915135107. [DOI] [PMC free article] [PubMed] [Google Scholar]
- 18.Puig I, et al. A personalized preclinical model to evaluate the metastatic potential of patient-derived colon cancer initiating cells. Clin Cancer Res. 2013;19(24):6787–6801. doi: 10.1158/1078-0432.CCR-12-1740. [DOI] [PubMed] [Google Scholar]
- 19.Hidalgo M, et al. Patient-derived xenograft models: an emerging platform for translational cancer research. Cancer Discov. 2014;4(9):998–1013. doi: 10.1158/2159-8290.CD-14-0001. [DOI] [PMC free article] [PubMed] [Google Scholar]
- 20.Guinney J, et al. The consensus molecular subtypes of colorectal cancer. Nat Med. 2015;21(11):1350–1356. doi: 10.1038/nm.3967. [DOI] [PMC free article] [PubMed] [Google Scholar]
- 21.Brennan CW, et al. The somatic genomic landscape of glioblastoma. Cell. 2013;155(2):462–477. doi: 10.1016/j.cell.2013.09.034. [DOI] [PMC free article] [PubMed] [Google Scholar]
- 22.Rabindran SK, Ross DD, Doyle LA, Yang W, Greenberger LM. Fumitremorgin C reverses multidrug resistance in cells transfected with the breast cancer resistance protein. Cancer Res. 2000;60(1):47–50. [PubMed] [Google Scholar]
- 23.Wilting RH, Dannenberg JH. Epigenetic mechanisms in tumorigenesis, tumor cell heterogeneity and drug resistance. Drug Resist Updat. 2012;15(1–2):21–38. doi: 10.1016/j.drup.2012.01.008. [DOI] [PubMed] [Google Scholar]
- 24.Schwartz YB, Pirrotta V. A new world of Polycombs: unexpected partnerships and emerging functions. Nat Rev Genet. 2013;14(12):853–864. doi: 10.1038/nrg3603. [DOI] [PubMed] [Google Scholar]
- 25.Lai A, et al. RBP1 recruits both histone deacetylase-dependent and -independent repression activities to retinoblastoma family proteins. Mol Cell Biol. 1999;19(10):6632–6641. doi: 10.1128/MCB.19.10.6632. [DOI] [PMC free article] [PubMed] [Google Scholar]
- 26.Hsieh JJ, Zhou S, Chen L, Young DB, Hayward SD. CIR, a corepressor linking the DNA binding factor CBF1 to the histone deacetylase complex. Proc Natl Acad Sci U S A. 1999;96(1):23–28. doi: 10.1073/pnas.96.1.23. [DOI] [PMC free article] [PubMed] [Google Scholar]
- 27.Baxter E, Windloch K, Gannon F, Lee JS. Epigenetic regulation in cancer progression. Cell Biosci. 2014;4:45. doi: 10.1186/2045-3701-4-45. [DOI] [PMC free article] [PubMed] [Google Scholar]
- 28.Tian X, et al. Histone lysine-specific methyltransferases and demethylases in carcinogenesis: new targets for cancer therapy and prevention. Curr Cancer Drug Targets. 2013;13(5):558–579. doi: 10.2174/1568009611313050007. [DOI] [PMC free article] [PubMed] [Google Scholar]
- 29.Kim SM, et al. Regulation of mouse steroidogenesis by WHISTLE and JMJD1C through histone methylation balance. Nucleic Acids Res. 2010;38(19):6389–6403. doi: 10.1093/nar/gkq491. [DOI] [PMC free article] [PubMed] [Google Scholar]
- 30.Brauchle M, et al. Protein complex interactor analysis and differential activity of KDM3 subfamily members towards H3K9 methylation. PLoS One. 2013;8(4):e60549. doi: 10.1371/journal.pone.0060549. [DOI] [PMC free article] [PubMed] [Google Scholar]
- 31.Kuroki S, et al. JMJD1C, a JmjC domain-containing protein, is required for long-term maintenance of male germ cells in mice. Biol Reprod. 2013;89(4):93. doi: 10.1095/biolreprod.113.108597. [DOI] [PubMed] [Google Scholar]
- 32.Piccolo FM, et al. Different roles for Tet1 and Tet2 proteins in reprogramming-mediated erasure of imprints induced by EGC fusion. Mol Cell. 2013;49(6):1023–1033. doi: 10.1016/j.molcel.2013.01.032. [DOI] [PMC free article] [PubMed] [Google Scholar]
- 33.Bermejo-Álvarez P, et al. Tet-mediated imprinting erasure in H19 locus following reprogramming of spermatogonial stem cells to induced pluripotent stem cells. Sci Rep. 2015;5:13691. doi: 10.1038/srep13691. [DOI] [PMC free article] [PubMed] [Google Scholar]
- 34.Losman JA, et al. (R)-2-hydroxyglutarate is sufficient to promote leukemogenesis and its effects are reversible. Science. 2013;339(6127):1621–1625. doi: 10.1126/science.1231677. [DOI] [PMC free article] [PubMed] [Google Scholar]
- 35.Ko M, et al. Impaired hydroxylation of 5-methylcytosine in myeloid cancers with mutant TET2. Nature. 2010;468(7325):839–843. doi: 10.1038/nature09586. [DOI] [PMC free article] [PubMed] [Google Scholar]
- 36.Moreira AL, Sampaio EP, Zmuidzinas A, Frindt P, Smith KA, Kaplan G. Thalidomide exerts its inhibitory action on tumor necrosis factor alpha by enhancing mRNA degradation. J Exp Med. 1993;177(6):1675–1680. doi: 10.1084/jem.177.6.1675. [DOI] [PMC free article] [PubMed] [Google Scholar]
- 37.Muller GW, et al. Amino-substituted thalidomide analogs: potent inhibitors of TNF-alpha production. Bioorg Med Chem Lett. 1999;9(11):1625–1630. doi: 10.1016/S0960-894X(99)00250-4. [DOI] [PubMed] [Google Scholar]
- 38.Fardini Y, Dehennaut V, Lefebvre T, Issad T. O-GlcNAcylation: a new cancer hallmark? Front Endocrinol (Lausanne) 2013;4:99. doi: 10.3389/fendo.2013.00099. [DOI] [PMC free article] [PubMed] [Google Scholar]
- 39.Huang Y, Rao A. Connections between TET proteins and aberrant DNA modification in cancer. Trends Genet. 2014;30(10):464–474. doi: 10.1016/j.tig.2014.07.005. [DOI] [PMC free article] [PubMed] [Google Scholar]
- 40.Jeschke J, Collignon E, Fuks F. Portraits of TET-mediated DNA hydroxymethylation in cancer. Curr Opin Genet Dev. 2016;36:16–26. doi: 10.1016/j.gde.2016.01.004. [DOI] [PubMed] [Google Scholar]
- 41.Lian CG, et al. Loss of 5-hydroxymethylcytosine is an epigenetic hallmark of melanoma. Cell. 2012;150(6):1135–1146. doi: 10.1016/j.cell.2012.07.033. [DOI] [PMC free article] [PubMed] [Google Scholar]
- 42.Zhang F, et al. 5-Hydroxymethylcytosine loss is associated with poor prognosis for patients with WHO grade II diffuse astrocytomas. Sci Rep. 2016;6:20882. doi: 10.1038/srep20882. [DOI] [PMC free article] [PubMed] [Google Scholar]
- 43.Yang Q, et al. Decreased 5-hydroxymethylcytosine (5-hmC) is an independent poor prognostic factor in gastric cancer patients. J Biomed Nanotechnol. 2013;9(9):1607–1616. doi: 10.1166/jbn.2013.1713. [DOI] [PubMed] [Google Scholar]
- 44.Chen Z, Shi X, Guo L, Li Y, Luo M, He J. Decreased 5-hydroxymethylcytosine levels correlate with cancer progression and poor survival: a systematic review and meta-analysis. Oncotarget. 2017;8(1):1944–1952. doi: 10.18632/oncotarget.13719. [DOI] [PMC free article] [PubMed] [Google Scholar]
- 45.Neri F, et al. TET1 is a tumour suppressor that inhibits colon cancer growth by derepressing inhibitors of the WNT pathway. Oncogene. 2015;34(32):4168–4176. doi: 10.1038/onc.2014.356. [DOI] [PubMed] [Google Scholar]
- 46.Jin SG, et al. 5-Hydroxymethylcytosine is strongly depleted in human cancers but its levels do not correlate with IDH1 mutations. Cancer Res. 2011;71(24):7360–7365. doi: 10.1158/0008-5472.CAN-11-2023. [DOI] [PMC free article] [PubMed] [Google Scholar]
- 47.Kraus TF, Kolck G, Greiner A, Schierl K, Guibourt V, Kretzschmar HA. Loss of 5-hydroxymethylcytosine and intratumoral heterogeneity as an epigenomic hallmark of glioblastoma. Tumour Biol. 2015;36(11):8439–8446. doi: 10.1007/s13277-015-3606-9. [DOI] [PubMed] [Google Scholar]
- 48.Pfeifer GP, Xiong W, Hahn MA, Jin SG. The role of 5-hydroxymethylcytosine in human cancer. Cell Tissue Res. 2014;356(3):631–641. doi: 10.1007/s00441-014-1896-7. [DOI] [PMC free article] [PubMed] [Google Scholar]
- 49.Essers MA, et al. IFNα activates dormant haematopoietic stem cells in vivo. Nature. 2009;458(7240):904–908. doi: 10.1038/nature07815. [DOI] [PubMed] [Google Scholar]
- 50.Vora AJ, Toh CH, Peel J, Greaves M. Use of granulocyte colony-stimulating factor (G-CSF) for mobilizing peripheral blood stem cells: risk of mobilizing clonal myeloma cells in patients with bone marrow infiltration. Br J Haematol. 1994;86(1):180–182. doi: 10.1111/j.1365-2141.1994.tb03271.x. [DOI] [PubMed] [Google Scholar]
- 51.Kreso A, et al. Variable clonal repopulation dynamics influence chemotherapy response in colorectal cancer. Science. 2013;339(6119):543–548. doi: 10.1126/science.1227670. [DOI] [PMC free article] [PubMed] [Google Scholar]
- 52.Anido J, et al. TGF-β receptor inhibitors target the CD44(high)/Id1(high) glioma-initiating cell population in human glioblastoma. Cancer Cell. 2010;18(6):655–668. doi: 10.1016/j.ccr.2010.10.023. [DOI] [PubMed] [Google Scholar]
- 53.Schmittgen TD, Livak KJ. Analyzing real-time PCR data by the comparative C(T) method. Nat Protoc. 2008;3(6):1101–1108. doi: 10.1038/nprot.2008.73. [DOI] [PubMed] [Google Scholar]
- 54.Vandesompele J, et al. Accurate normalization of real-time quantitative RT-PCR data by geometric averaging of multiple internal control genes. Genome Biol. 2002;3(7):RESEARCH0034. doi: 10.1186/gb-2002-3-7-research0034. [DOI] [PMC free article] [PubMed] [Google Scholar]
Associated Data
This section collects any data citations, data availability statements, or supplementary materials included in this article.


