Abstract
We verify both theoretically and by simulation that an AC electric field, with a frequency much higher than the dissociation rate, can significantly accelerate the dissociation rate of biological molecules under isothermal conditions. The cumulative effect of the AC field is shown to break a key bottleneck by reducing the entropy (and increasing the free energy of the local minimum) via the alignment of the molecular dipole with the field. For frequencies below a resonant frequency which corresponds to the inverse Debye dipole relaxation time, the dissociation rate can be accelerated by a factor that scales as , where ω is the field frequency, E0 is the field amplitude, and ϵ′(ω) is the frequency-dependent real permittivity of the molecule. At large amplitudes, we find that the accelerated melting rate becomes universal, independent of duplex size and sequence, which is in drastic contrast to Ohmic thermal melting. We confirm our theory with isothermal all-atomic molecular dynamics simulation of short DNA duplexes with known melting rates, demonstrating several orders in enhancement with realistic fields.
I. INTRODUCTION
External fields exerted by hydrodynamic shear, optical tweezer, AFM, etc. are known to catalyze association and dissociation of biomolecules.1–3 They can hence be used to replace thermal force to enhance the selectivity and rate of important reactions such as the Polymerase Chain Reaction (PCR), antibody-antigen complexification, enzyme-nucleic acid docking, and even protein-DNA interaction. This is a welcomed substitution for PCR thermal cycling, for example, as heating to the duplex melting temperature of 95 °C without boiling and cooling from such elevated temperature are the rate-limiting steps. Less well-known is the effect of AC fields on both association and dissociation reactions. AC fields offer the important advantage of no net force on the molecule so that the reaction can be carried out in a small batch reactor, such as a PCR tube. It also allows excitation by optical and acoustic means. AC electric field is particularly interesting, as biomolecules are highly polarizable at both optical and acoustic frequencies.4,5 There are some recent reports on how AC electric and electromagnetic field can indeed accelerate the rate of dehybridization and complexification reactions.6,7 However, as dielectric and Ohmic heating by the AC field can also raise the temperature of the water medium, it is unclear if these effects are not thermal in origin.
The electric field across an ion channel is as high as 10 × 106 V/m and the voltage-gated firing time of gap junctions can be as fast as micro-seconds. These observations suggest that the voltage-gated membrane ion-channel protein conformation transformation and the action potential triggering neuro-transmitter/receptor association are quite sensitive to fast transient electric fields. There must hence be some universalities to their field-driven association and dissociation kinetics that enable them to synchronize. Such field effects must be isothermal at the cellular level. We hence believe electrophysiological phenomena across cell membranes are very relevant to the current topic.
In this article, we will develop a theory for the effects of AC fields in isothermal dissociation reactions, which we will verify with molecular dynamics simulations for the case of DNA melting. We will show that this theory is consistent with previous experimental results on the isothermal melting of DNA molecules and that it explains the observation that for large enough fields in the microwave spectrum, melting is independent of the DNA length and sequence.6 This is a unique signature of isothermal field-enhanced melting, which is not exhibited by thermal melting through Ohmic heating.
II. THEORETICAL MODEL
A. Dielectric properties
When a beam of electromagnetic waves interacts with a dielectric medium, energy transfer may take place between them. On the one hand, some of the electromagnetic energy of the waves may be dissipated, converting to thermal energy due to dielectric and magnetic losses during the polarization and magnetization cycles, respectively. As a result, the temperature of the dielectric medium will rise—a phenomenon called dielectric heating. On the other hand, other portions of the electromagnetic energy of the waves could do (non-thermal) work on the material resulting from polarization and magnetization, which may then directly increase the (isothermal) free energy of the molecule without causing a change in temperature.8 This isothermal mechanism is particularly important for dissociation reactions in contact with a larger thermal reservoir, such as a thermal cycler, as one typically desires to melt the DNA duplex at a fixed lower temperature.
The dielectric properties of a material dictate its tendency to either convert electromagnetic energy into thermal energy or store it. This is reflected in the definition of the dielectric permittivity as a complex frequency-dependent quantity
| (1) |
where ϵ′ is the real part of the dielectric permittivity and ϵ″ is its complex counterpart, also known as dielectric loss. The real part is a measure of the ability to store the external electromagnetic energy due to electric polarization effects and dielectric relaxation involving unpaired point defects, bound charges, and polarized interfaces.9 The imaginary part relates to the ability of the material to dissipate the energy from an external electromagnetic field and convert it to heat, which is due to anharmonic interactions of the electromagnetic fields with the phonon system of the material.10
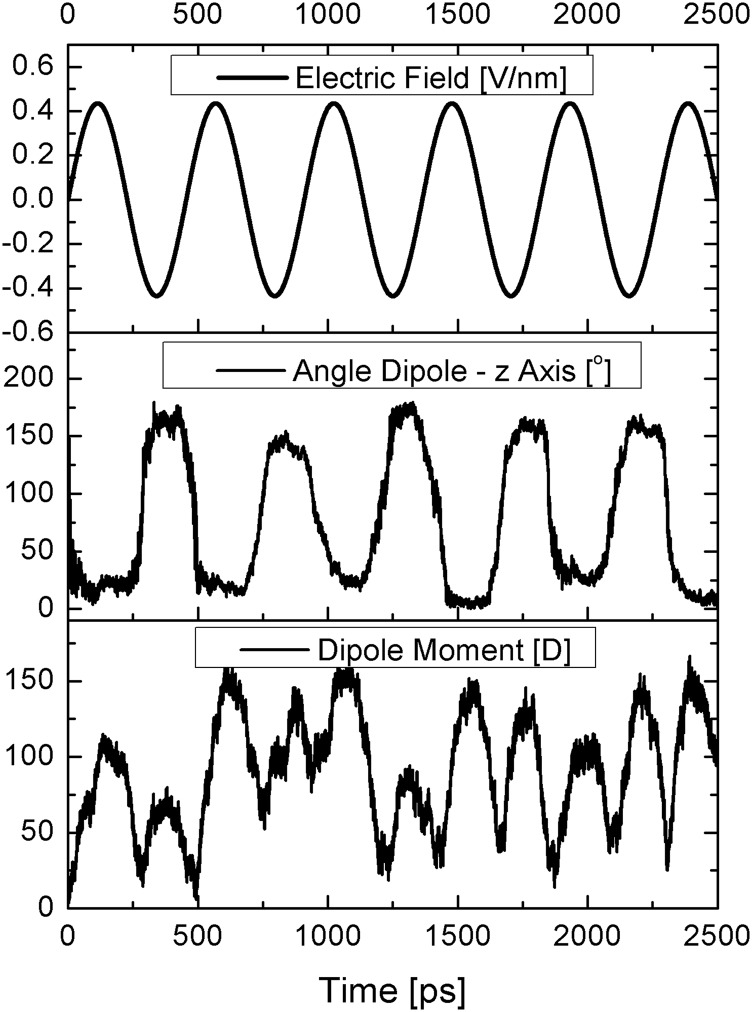
When applying an alternating field to a dielectric material, molecular dipoles reorganize in an attempt to align themselves with the oscillating electric field11 (see Fig. 1). However, thermal agitation, collisions, and lattice vibrations try to randomize the dipole orientations, leading to a minimum reorientation time τD. In the linear response approximation, the thermal fluctuations of the dipole are equivalent to the macroscopic re-alignment caused by the external field, and therefore the dielectric permittivity of a material can be associated with the total dipole autocorrelation function Φ through12,13
| (2) |
where is the Laplace transform and ϵ(0) is the static dielectric constant of the material. This constant is related to the fluctuations of the dipole moment in the absence on an external field and can be calculated through12,13
| (3) |
where M is the total dipole moment, ⟨M2⟩ and ⟨M⟩2 are averages of the squared M and the square of the average M, V and T are the volume and temperature of the cell considered, kB is the Boltzmann constant, and ϵ0 is the permittivity of vacuum.
FIG. 1.
Alignment of the dipole of a DNA molecule (“ACAAGTCCT”) with an alternating electric field. (top) Magnitude of the electric field E = E0 sin(ωt), where ω = 13.8 GHz and E0 = 0.438 V/nm. (middle) Angle of the net dipole of the molecule with the direction of the electric field. (bottom) Magnitude of the dipole of the molecule (in D).
For an AC field, one needs to introduce the dipole relaxation time for the induced molecular dipole. Approximating the dipole autocorrelation function by an exponentially decaying function leads to the classical Debye approximation for the permittivity14
| (4) |
where the limit for high-frequency permittivity ϵ(∞) is taken as 1 for rigid (non-polarizable) molecular models.13,15
The Debye approximation describes the expected behavior of idealized dielectric materials. For most real materials, the dynamics deviate from the single relaxation model assumed in this theory, as many phonon modes absorb energy in a non-uniform manner, leading to many relaxation and resonance processes.16–18 For example, the dielectric properties of bulk water have been shown to be well described by a triexponential Debye relaxation model,
| (5) |
where τD,1 is an ultrafast inertial relaxation of the order of 10 fs, and τD,2 and τD,3 are time scales related to diffusive motions of water, of the order of 0.1 and 1 ps, respectively.19 A more general expression for the dielectric permittivity of a molecule or material is, then, as a sum of Debye relaxation processes with different relaxation times,16,18
| (6) |
where the contribution of resonance events has been omitted for the sake of simplicity. Empirical models such as the Cole-Davidson,20
| (7) |
and Havriliak-Negami21 models have been developed to approximate the dielectric permittivity for frequent high-frequency relaxation events, which lead to broader dielectric spectra. However, the nature of the most appropriate fit function for biological systems is still a matter of debate.19 These different relaxation models with different number of time scales will determine the resonant frequency for maximum AC effect, as the induced dipole cannot respond to the AC field at a frequency beyond the inverse value of the smallest relaxation time.
B. Electrical work input to dielectric molecules
The electric polarization vector of a molecule is the vector field that expresses the density of permanent or induced electric dipole moments in a dielectric molecule. This vector is defined as the dipole moment per unit volume.22 For a polarizable molecule in the presence on an external electric field , the polarization vector is given by
| (8) |
where is the polarization vector at zero electric field and is the density of induced dipole moments oriented in the direction of the field (see Fig. 2). According to classical electrodynamics, the total electric energy transferred to a linear, non-magnetic, isotropic, and homogeneous dielectric system under planar electromagnetic wave irradiation is given by8
| (9) |
where τ and V are the irradiation time and the irradiated volume of the dielectric system, respectively. We are hence capturing the total work done by the AC field to rotate the induced dipole, whose orientation is never perfectly aligned with the field. Hence, for a polarizable molecule in the presence of an unidimensional electric field, we can write
| (10) |
FIG. 2.
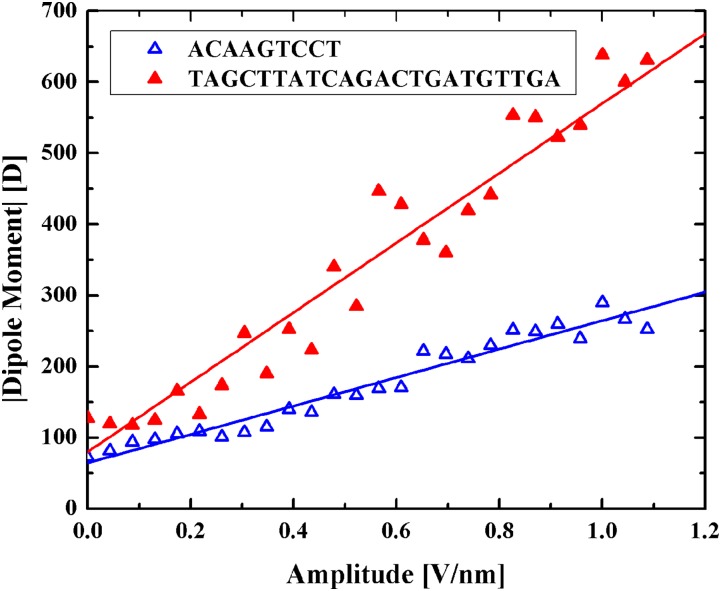
Magnitude of the dipole moment of two DNA molecules with different lengths at different amplitudes of a DC electric field. A good approximation for the ratio of their slopes is the ratio of their lengths, as the dipole moment is proportional to the volume. Data points represent results from simulations, while lines are their best linear fits.
Substituting Eq. (1) in this equation, this energy can be decomposed into its real and complex components
| (11) |
where WEM is the polarization electromagnetic work done by the electromagnetic waves to align the dipole of the system to the field and DTH is the total thermal dissipation (loss). Considering a sinusoidal electric field E = E0 sin(ωt), these integrals can be calculated explicitly, leading to
| (12) |
and
| (13) |
where ⟨EEM⟩ and ⟨DEM⟩ are the averages over a single irradiation cycle and is the number of irradiation cycles. We have assumed that the molecular permittivity does not change over the dissociation transient, and this assumption should be valid if the bonds that are broken are the hydrogen bonds between base pairs, which do not contribute to the molecular permittivity.23–25
On the one hand, the polarization work is work done on the dipoles, which will funnel into the slow degrees of freedom leading to a configurational energy change dependent both on the frequency and applied power. On the other hand, the thermal dissipation term leads to a net temperature increment (dielectric heating), whose effect can be neglected in molecular dynamics simulations through the use of high-frequency thermostats. Hence, we will focus on the term WEM from Eq. (12) for the isothermal work.
C. Enhancement of reaction rates
Many activated processes in biology such as DNA melting are well characterized by the Eyring-Polanyi equation26
| (14) |
where k is the transition rate, kB is the Boltzmann constant, T is the temperature of the system, h is the Planck constant, and ΔG‡ is the activation free energy, which can be decomposed into its enthalpy and entropy terms ΔG‡ = ΔH‡ − TΔS‡. Assuming that all the non-isothermal work done by the AC field is used to reduce the barrier, we can define a electromagnetically enhanced transition rate by
| (15) |
As the melting occurs after a time of 1/kEM, the total work done on the system by the electromagnetic radiation is WEM(1/kEM). This results in a transcendental equation for kEM that can be formally inverted, leading to
| (16) |
where W is the omega (or Lambert W) function, defined as the inverse relation of the function
| (17) |
Working at high amplitudes and frequencies, an asymptotic expansion of the omega function leads to an enhanced rate
| (18) |
Where . Note from this equation that, as , the melting rate will increase quadratically with the field amplitude E0 and linearly with ω(ϵ′(ω) − 1). This rate is equivalent to an entropic free energy barrier
| (19) |
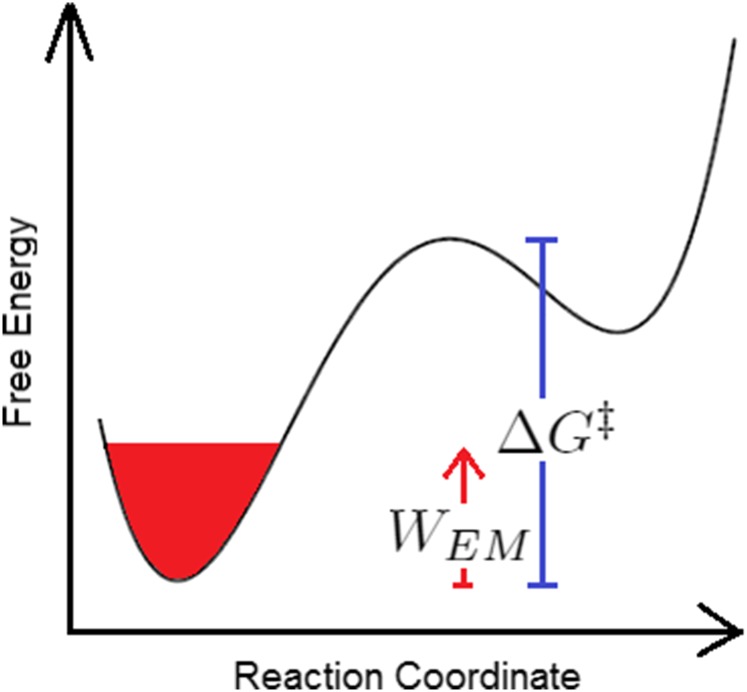
Although the mechanism for melting changes upon application of the external field, modifying both the transition state and the equilibrium configurations, we then predict that the effect of the field is equivalent to lowering the initial free energy barrier ΔG‡ by
| (20) |
where is an entropic term given by Eq. (19) (see Fig. 3).
FIG. 3.
Scheme of the effect of the electromagnetic field on the free energy landscape.
III. SIMULATION RESULTS
A. Dielectric properties of DNA
Previous work both in experiments and simulations suggest that, due to its high negative charge, DNA is a highly polarizable molecule.5,23–25 Estimates of the dielectric constant have been obtained experimentally5 (ϵ(0) ∼ 8) and through the use of all-atomic simulations (ϵ(0) = 12 ± 1.4 with the CHARMM27 force field5). In this work, the dielectric properties of the double stranded molecule “ACAAGTCCT” have been determined from all-atomic simulations in explicit water27 using NAMD28 with the CHARMM36 force field29 by following the procedure established by Cuervo et al.5 In order to avoid solvent effects, only the minimum number of Na+ ions for charge neutrality was included. The static dielectric constants were estimated using Eq. (3) from 10-ns-long simulations after 400 ns of equilibration (where output was saved every 100 fs), at four different temperatures (from 276.15 K to 306.15 K), leading to ϵ(0) = 14.4 ± 3.6.
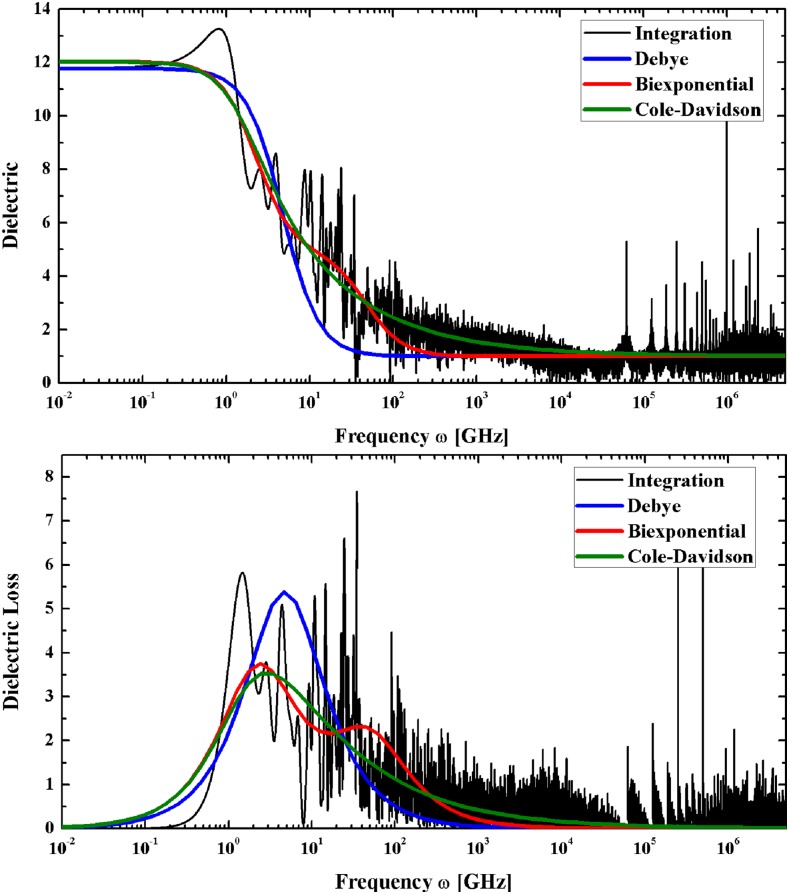
The frequency-dependent permittivities ϵ(ω) were determined from these same simulations by means of Eq. (2) (see Fig. 4). Figure 4 also fits the permittivities obtained numerically from Eq. (2) with the Debye,14 biexponential Debye,30 and Cole-Davidson20 models. We also fitted the permittivities to the Cole-Cole31 and Havriliak-Negami21 models, fittings which coincided with the Debye and Cole-Davidson fittings, respectively. It is important to mention that resonance effects (which are observed in the terahertz spectrum26,32,33) are not captured by either of these approximations.
FIG. 4.
Dielectric properties of the DNA molecule “ACAAGTCCT” at 276.15 K obtained through direct integration of the dipole autocorrelation function measured in the simulations using Eq. (2) (black) and their respective fittings to the Debye (blue), Biexponential Debye (red), and Cole-Davidson models (green).
The Debye approximation yields relaxation times of 80-150 ps, which have been linked to structural conformational changes of the DNA molecule.34,35 The biexponential Debye approximation yields two Debye-type relaxation events, one with a characteristic time of 200-400 ps, linked to base pair step shift, slide, rise, tilt, roll, and twist motions,35 and another one with a characteristic time of 10-20 ps, which has been linked to the motions of the water molecules bound to the DNA.19
B. DNA melting kinetics
DNA melting is the process of separation of double stranded DNA into two single strands. Over the years, there has been a special interest in the study of the effects of electromagnetic waves on DNA melting, especially in the terahertz32,36–40 and gigahertz18,41,42 regions. Under the influence of alternating electric fields, it has been suggested experimentally that DNA melting can proceed more rapidly than through the use of conventional thermal heating methods.6 To verify the theoretical scaling of our suggested enhancement with the field properties, we worked with the molecule “ACAAGTCCT,” whose melting rates are experimentally known at three different temperatures.43
The volume of this molecule (∼5540 Å3) was determined from its equilibrated structure, and its dielectric properties were determined from equilibrium simulations. In order to focus on relaxation events, which can be modeled through the usual permittivity models, the range of field frequencies ω where simulations were performed ranged from 3.5 to 70 GHz. The values of the electric field amplitudes E0 used in our simulations range from 0.4 to 1.1 V/nm. These amplitudes and frequencies were selected due to the time limitations of all-atomic molecular dynamics simulations as well as to keep the system stable enough to be controlled with the standard thermostats (Langevin thermostat with a frequency of 1 THz). A Nose-Hoover Langevin piston was applied to keep the pressure at 1.013 25 bars.44,45
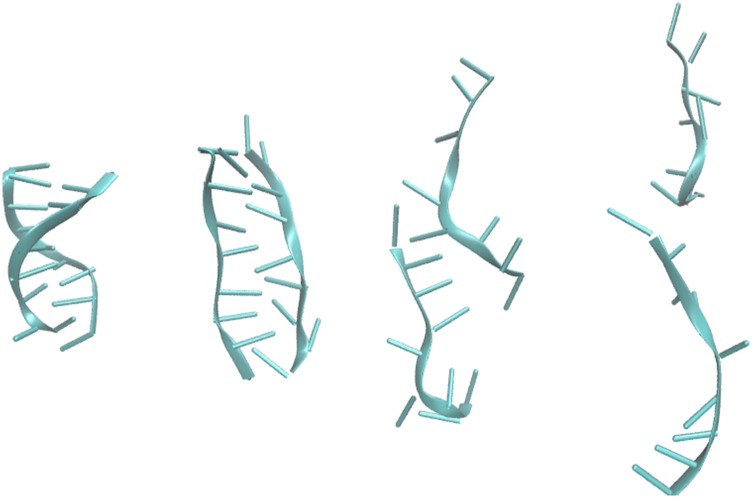
The suggested mechanism for melting of short DNA molecules without secondary structures is through an unzipping process;26 however, when melting the DNA molecule “ACAAGTCCT” through the use of an AC field, we observe that the molecule aligns with the field and stretches until one of the strands slides from the other (see Fig. 5), suggesting a very different mechanism than the thermal26 and the resonance-induced32,33 ones.
FIG. 5.
Conformations of the DNA duplex ACAAGTCCT sampled during an enhanced melting simulation.
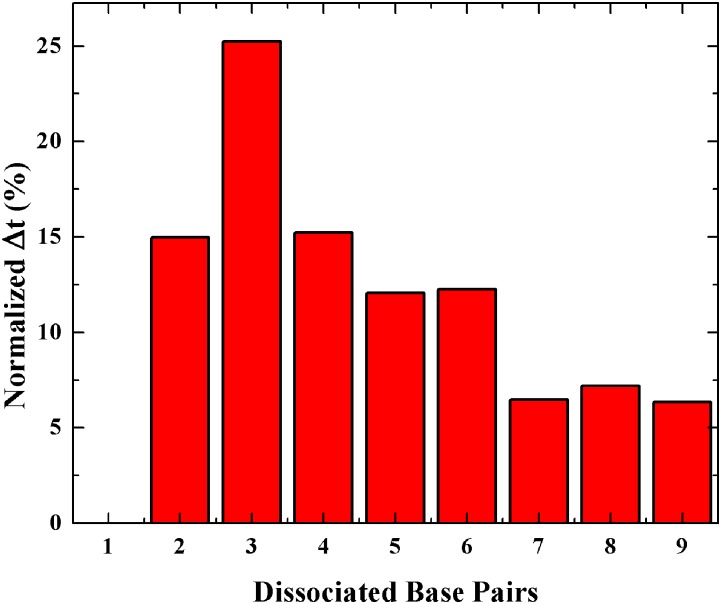
Hence, the suggested definition of the melting time as the time when the center of mass of the central five bases of each single strand is larger than a certain constant46 is not sufficient, and we also require all of the hydrogen bonds and base stacking interactions between interacting strands to be broken. We hence examine the melting of the individual base pair and found that they melt sequentially, starting with one of the end base pairs. In agreement with previous simulations,47,48 we observe that the speed of base-pair dissociation generally becomes larger and larger during the melting process (see Fig. 6). The melting intervals exhibit a single maximum, suggesting that under an AC field, the melting still has a single barrier and our assumption in Eq. (15) is justified. The kinetics is then controlled by the opening of the first few base pairs, giving rise to a single effective dissociation rate whose barrier is lowered by WEM.
FIG. 6.
Normalized melting interval time versus the number of dissociated base-pairs averaged over fifteen enhanced simulations at 286.15 K, ω = 13.82 GHz, and E0 = 0.7 V/nm for sequence “ACAAGTCCT.” The melting interval time associated with two base pairs is defined as the interval of time between the instant one base pair breaks and the instant two base pairs break. These intervals were normalized with the time it takes to break all base pairs.
IV. COMPARISON TO SIMULATIONS AND DISCUSSION
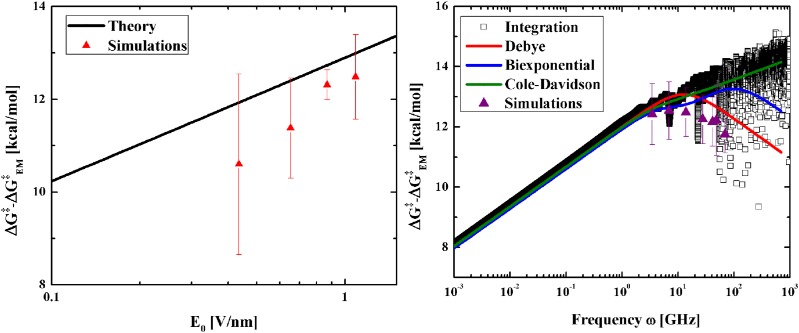
Figure 7 compares the free energy enhancement obtained from simulations with our theoretical results, both in function of field amplitude and frequency, for sequence “ACAAGTCCT.” The dielectric permittivities used were those obtained numerically from Eq. (2), and the analytic enhancement was obtained from Eq. (16). To avoid problems with the known inaccuracies in the determination of the static dielectric constant due to the long simulation times required for their accurate estimation,12 the static dielectric constant ϵ(0) was fitted to the experimental value ϵ(0) = 8. Working with experimentally determined dielectric constants has shown to provide satisfactory results when combined with simulations for calculating the heat absorbed from microwaves on alcohols and glycols.12
FIG. 7.
(left) Semi-logarithmic plot of the free energy enhancement in function of the field amplitude E0 for simulations and theory, where ΔG‡ is the experimentally determined free energy barrier. Simulations were performed at 306.15 K, ω = 13.82 GHz. For our estimates, the static dielectric constant was taken as 8, in accordance with the experiments. Ten simulations were performed with each field amplitude. (right) Semi-logarithmic plot of the free energy enhancement in function of the field frequency ω for simulations and theory. Four different permittivity models were used to fit the data: direct numerical integration of the dipole autocorrelation function [Eq. (2)], Debye model (ϵ(0) = 8, τD = 78.7 ps), biexponential Debye model (ϵ(0) = 8, τD,1 = 187 ps, ϵ1 = 2.2, τD,2 = 10 ps), and Cole-Davidson model (ϵ(0) = 8, τD = 284 ps, γ = 0.48). These theoretical curves were determined from Eq. (16), while the simulated results were obtained from measuring the melting time (1/kEM) of twenty different simulations at each field frequency [using Eqs. (15) and (20)]. Simulations performed at 306.15 K, E0 = 1.1 V/nm.
Figure 7 (left) compares the simulated and theoretical free energy enhancements in function of the field amplitude and shows very good accuracy as well as a logarithmic scaling consistent with Eq. (19). To analyze the frequency dependence, we considered four possible models for the dielectric permittivity of the molecule: a direct integration of Eq. (2), a Debye approximation, a biexponential Debye approximation, and a Cole-Davidson approximation. The Debye approximation of the dielectric permittivity of our molecule leads to ω⟨EEM⟩ = ⟨DTH⟩/τD; therefore, Eq. (16) implies that ω = 2π/τD is a turnover frequency which maximizes the melting rate. For a sum of Debye processes,
| (21) |
where is the dielectric loss associated with the j-th relaxation event. Hence we expect the maximum enhancement to be dominated by the high-frequency relaxation events. As the Cole-Davidson and Havriliak-Negami models are approximations of these cases, the same behavior is expected for materials whose dielectric properties are well represented by these models.
It is clear why an optimum frequency exists. The dipole can respond longer to the AC field and allow energy transfer when the frequency is beyond the inverse dipole relaxation time. At low frequencies, the dipole will be aligned with the field rapidly within one cycle such that no more energy is transferred for the rest of the cycle. The number of barriers (bonds) that will be crossed (broken) per interval in time will hence also decrease, resulting in a lower melting rate. This optimum frequency lies roughly at the inverse dipole relaxation time (the turn-over frequency) for the Debye model and shifts to higher values, with a broader resonant peak, for models with multiple relaxation time scales.
Comparing the scaling of our theory to simulations [see Fig. 7 (right)], we observe that the Debye approximation is the most consistent model for our theory. We have two possible explanations for this behavior. The first one is that the dynamics of non-resonant processes which involve very short relaxation times could be geometrically confined by lower-frequency modes, which absorb most of the energy that is not converted into heat. As these modes change the conformations of the molecule to align its dipole to the field, high-frequency modes become essentially frozen, a phenomenon previously observed in bulk supercooled liquids.49 The second possible explanation is that short relaxation times are mostly related to the dynamics of surrounding water molecules,19 and hence, as these molecules are non-polarizable with these field frequencies, the effect of our electromagnetic waves on them is negligible.
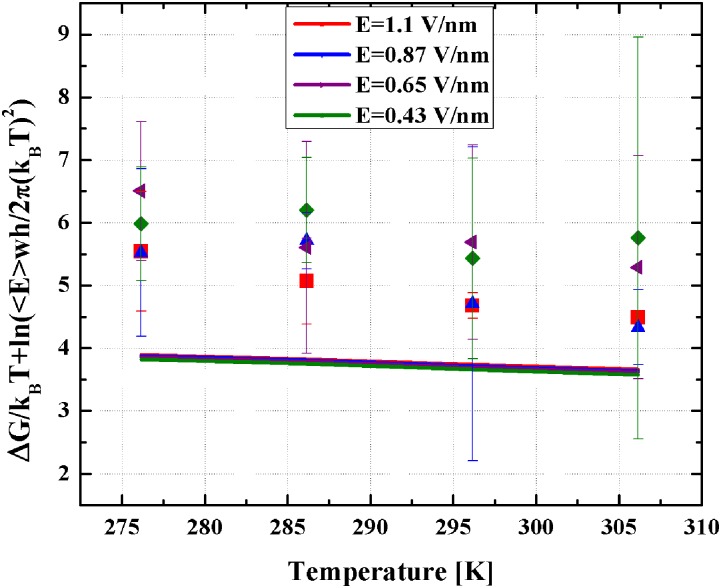
Comparing the temperature dependence of the scaling of our model to simulations is slightly more convoluted than for field amplitude and frequency. Working with Eq. (19), we observe that
| (22) |
where , implying that the left term is only weakly temperature dependent. Note that this expression collapses the theoretical curves to a single curve. Comparing our theoretical estimates for this expression with simulated results (see Fig. 8), we see good agreement with differences of 1–1.5 kcal/mol (2–3 kBTs), what is within the error of our simulations.
FIG. 8.
Enhanced free energy in function of the temperature T for simulations (symbols) and theory (lines). Simulations performed with ω = 13.82 GHz. Ten simulations were performed at each temperature-field amplitude.
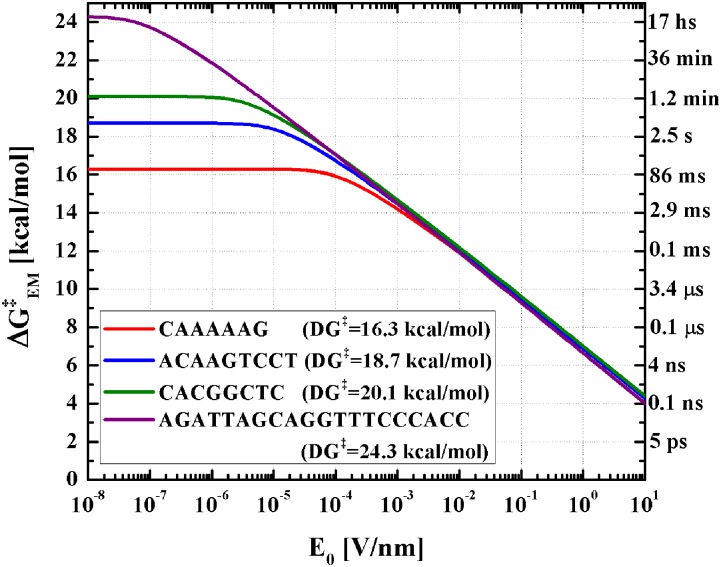
To analyze the capacity of discriminating different sequences with this method, we analyzed the enhanced melting rates of sequences “CAAAAAG,” “ACAAGTCCT,” “CACGGCTC,” and “AGATTAGCAGGTTTCCCACC” at 298.15 K, which are among the few melting rates of short DNA sequences within our simulation capabilities that have been measured and published.26,50 The free energy barriers of these sequences take the values of 16.3, 18.7, 20.1, and 24.3 kcal/mol, respectively, at this temperature, corresponding to melting rates of 6.9, 0.1, 0.01, and 9.5 × 10⁻⁵ s−1.
These disparate melting rates for very different DNA lengths and sequences are chosen to demonstrate the isothermal field-enhanced melting mechanism. If the enhanced melting rate is due to Ohmic thermal effects, their enhanced rates would still be very different. Figure 9 compares the enhanced melting rates suggested from our theory at a constant field frequency ω of 13.82 GHz. Our theoretical estimates consider the same frequency-dependent dielectric properties for the four sequences, their only differences being their volumes (4220, 4770, 5540, and 11 500 Å3, respectively) and their thermal free energy barriers. For short DNA molecules (with lengths below the persistence length of the double stranded molecule), we can approximate the volume to be linear with the length of the molecule and hence, as a general formula, we will take V = 650N Å3, where N is the number of base pairs of the molecule.
FIG. 9.
Theoretical enhanced free energy at ω = 13.82 GHz and T = 298.15 K for four different sequences. Note that the differences become noticeable for amplitudes below 10−3 V/nm, where the minimum enhanced melting time is of the order of 10 ms. Labels on the right axis mark the melting time associated with each kinetic barrier.
Analyzing the expression of F, we can observe that, for a sequence with thermal melting rate k, if we consider a strong enough AC field such that
| (23) |
then
| (24) |
and Eq. (22) can be simplified to
| (25) |
Given two sequences with N1 and N2 base pairs and associated free energies and , this result implies that
| (26) |
This logarithm dependence of the activation energy with respect to the base pair number and the original barrier reduce the dependence on both. Hence, two sequences with equal lengths whose thermal free energy barriers take a ratio of 10 would have a difference in enhanced barriers of barely 2.3 kBT ≈ 1.4 kcal/mol, and the difference will be even smaller if the more stable duplex is longer than the less stable one. This is consistent with experimental findings on microwave-assisted DNA melting, which suggest that even molecules with very different thermal melting temperatures melt at virtually the same microwave power.6 It also suggests that the observed melting is not due to thermal effect by Ohmic heating. As we can observe from Fig. 9, decreasing field frequencies and amplitudes would lead to higher selectivity; however, as a trade-off, the enhancement becomes less significant.
In summary, this article proposes a theory to quantify the non-thermal catalytic effect of electromagnetic fields on highly polarizable molecules, which lead to the kinetic enhancement of activated reactions such as DNA melting. This theory suggests that, for large enough fields, the melting rate will scale quadratically with the field amplitude, weakly with the temperature, and its response to different field frequencies will depend on the dielectric properties of the material. For DNA, we observe that a single Debye model gives the best estimation for the enhancement, leading to a turnover frequency in the low gigahertz region. Although this article introduces a theory for the enhancement of isothermal dissociation events in the presence of an AC electric field by focusing on DNA melting, its reach is not limited to these dissociation events, this theory being applicable to other transitions that could be enhanced through the use of alternating fields such as the dissociation of antibody-antigen complexes, the unfolding of DNA hairpins, and the melting of crystals.
The assembly and disassembly of membrane ion-channels and pump proteins are particularly relevant, as the field across the lipid bilayer is in excess of 10 × 106 V/m or 0.01 V/nm and is well within the asymptotic region in Fig. 9. It has long been postulated that the voltage sensing features of membrane proteins are related to field-effects on the irreversible partial disassembly of the proteins.51 The firing and discharge of individual cardiac cell gap junction ion channels can be as fast as 1 micro-second, which corresponds to an AC frequency of MHz. Our DNA melting result in Fig. 7 and our universal asymptote in Fig. 9 indicate a reduction of up to 12 kBTs in the barrier under physiological conditions even at this low frequency. Perhaps the universal disassembly rate demonstrated in our theory explains why the ion channels can synchronize their firing and why actin molecules can assemble rapidly into filaments with specific orientation.
ACKNOWLEDGMENTS
S.S. and H.-C.C. are partially supported by No. NIHR21CA206904. Z.P. acknowledges the support from the National Science Foundation (No. 1706436-CBET) and the Indiana Clinical and Translational Sciences Institute (No. UL1TR001108) from the National Institutes of Health, National Center for Advancing Translational Sciences, and Clinical and Translational Sciences Award. This work used the Extreme Science and Engineering Discovery Environment (XSEDE52), which is supported by National Science Foundation Grant No. ACI-1548562, through Allocation No. TG-MCB180016. The authors acknowledge the Texas Advanced Computing Center (TACC) at The University of Texas at Austin for providing HPC resources that have contributed to the research results reported within this paper.
Contributor Information
Zhangli Peng, Email: .
Hsueh-Chia Chang, Email: .
REFERENCES
- 1.Basuray S., Senapati S., Aijian A., Mahon A. R., and Chang H.-C., “Shear and ac field enhanced carbon nanotube impedance assay for rapid, sensitive, and mismatch-discriminating dna hybridization,” ACS Nano 3, 1823–1830 (2009). 10.1021/nn9004632 [DOI] [PubMed] [Google Scholar]
- 2.Cheng I.-F., Senapati S., Cheng X., Basuray S., Chang H.-C., and Chang H.-C., “A rapid field-use assay for mismatch number and location of hybridized dnas,” Lab Chip 10, 828–831 (2010). 10.1039/b925854j [DOI] [PubMed] [Google Scholar]
- 3.Li D., Wang C., Sun G., Senapati S., and Chang H.-C., “A shear-enhanced cnt-assembly nanosensor platform for ultra-sensitive and selective protein detection,” Biosens. Bioelectron. 97, 143–149 (2017). 10.1016/j.bios.2017.05.053 [DOI] [PubMed] [Google Scholar]
- 4.Wang S., Chang H.-C., and Zhu Y., “Hysteretic conformational transition of single flexible polyelectrolyte under resonant ac electric polarization,” Macromolecules 43, 7402–7405 (2010). 10.1021/ma101571s [DOI] [Google Scholar]
- 5.Cuervo A., Dans P. D., Carrascosa J. L., Orozco M., Gomila G., and Fumagalli L., “Direct measurement of the dielectric polarization properties of dna,” Proc. Natl. Acad. Sci. U. S. A. 111, E3624–E3630 (2014). 10.1073/pnas.1405702111 [DOI] [PMC free article] [PubMed] [Google Scholar]
- 6.Edwards W. F., Young D. D., and Deiters A., “The effect of microwave irradiation on dna hybridization,” Org. Biomol. Chem. 7, 2506–2508 (2009). 10.1039/b903609a [DOI] [PubMed] [Google Scholar]
- 7.Ahirwar R., Tanwar S., Bora U., and Nahar P., “Microwave non-thermal effect reduces elisa timing to less than 5 minutes,” RSC Adv. 6, 20850–20857 (2016). 10.1039/c5ra27261k [DOI] [Google Scholar]
- 8.Wong B., “Roles of electromagnetically-enhanced free energy on non-thermal microwave effects in materials processing–a review and discussion,” Processing, Properties, and Design of Advanced Ceramics and Composites, Volume 259 of Ceramic Transactions Series (John Wiley & Sons Inc., 2016), p. 243–259. [Google Scholar]
- 9.Wang Z., Luo J., and Zhao G.-L., “Dielectric and microwave attenuation properties of graphene nanoplatelet–epoxy composites,” AIP Adv. 4, 017139 (2014). 10.1063/1.4863687 [DOI] [Google Scholar]
- 10.Gurevich V. and Tagantsev A., “Intrinsic dielectric loss in crystals,” Adv. Phys. 40, 719–767 (1991). 10.1080/00018739100101552 [DOI] [Google Scholar]
- 11.Chang H.-C. and Yeo L. Y., Electrokinetically driven microfluidics and nanofluidics (Cambridge University Press, New York, 2010). [Google Scholar]
- 12.Cardona J., Fartaria R., Sweatman M. B., and Lue L., “Molecular dynamics simulations for the prediction of the dielectric spectra of alcohols, glycols and monoethanolamine,” Mol. Simul. 42, 370–390 (2016). 10.1080/08927022.2015.1055741 [DOI] [Google Scholar]
- 13.Olmi R. and Bittelli M., “Can molecular dynamics help in understanding dielectric phenomena?,” Meas. Sci. Technol. 28, 014003 (2016). 10.1088/1361-6501/28/1/014003 [DOI] [Google Scholar]
- 14.Debye P. J. W., Polar Molecules (Chemical Catalog Company, Incorporated, 1929). [Google Scholar]
- 15.Lyubimov Y. A., “Permittivity at infinite frequency,” Russ. J. Phys. Chem. 80, 2033–2040 (2006). 10.1134/s0036024406120284 [DOI] [Google Scholar]
- 16.Belyaev B., Drokin N., Shabanov V., and Shepov V., “Specific features of the approximation of the dielectric spectra of alkylcyanobiphenyl liquid crystals,” Phys. Solid State 45, 598–602 (2003). 10.1134/1.1562253 [DOI] [Google Scholar]
- 17.Richert R., “Reverse calorimetry of a supercooled liquid: Propylene carbonate,” Thermochim. Acta 522, 28–35 (2011). 10.1016/j.tca.2010.09.016 [DOI] [Google Scholar]
- 18.Richert R., “Nonlinear dielectric effects in liquids: a guided tour,” J. Phys.: Condens. Matter 29, 363001 (2017). 10.1088/1361-648x/aa7cc4 [DOI] [PubMed] [Google Scholar]
- 19.Furse K. E. and Corcelli S. A., “The dynamics of water at dna interfaces: Computational studies of hoechst 33258 bound to dna,” J. Am. Chem. Soc. 130, 13103–13109 (2008). 10.1021/ja803728g [DOI] [PubMed] [Google Scholar]
- 20.Davidson D. W. and Cole R. H., “Dielectric relaxation in glycerol, propylene glycol, and n-propanol,” J. Chem. Phys. 19, 1484–1490 (1951). 10.1063/1.1748105 [DOI] [Google Scholar]
- 21.Havriliak S. and Negami S., “A complex plane representation of dielectric and mechanical relaxation processes in some polymers,” Polymer 8, 161–210 (1967). 10.1016/0032-3861(67)90021-3 [DOI] [Google Scholar]
- 22.Neeraj M., Applied Physics for Engineers (PHI Learning Pvt. Ltd., 2011). [Google Scholar]
- 23.Hobza P. and Šponer J., “Structure, energetics, and dynamics of the nucleic acid base pairs: nonempirical ab initio calculations,” Chem. Rev. 99, 3247–3276 (1999). 10.1021/cr9800255 [DOI] [PubMed] [Google Scholar]
- 24.Kilina S., Tretiak S., Yarotski D. A., Zhu J.-X., Modine N., Taylor A., and Balatsky A. V., “Electronic properties of dna base molecules adsorbed on a metallic surface,” J. Phys. Chem. C 111, 14541–14551 (2007). 10.1021/jp070805u [DOI] [Google Scholar]
- 25.Preuss M., Schmidt W. G., Seino K., Furthmüller J., and Bechstedt F., “Ground-and excited-state properties of dna base molecules from plane-wave calculations using ultrasoft pseudopotentials,” J. Comput. Chem. 25, 112–122 (2004). 10.1002/jcc.10372 [DOI] [PubMed] [Google Scholar]
- 26.Sensale S., Peng Z., and Chang H.-C., “Kinetic theory for dna melting with vibrational entropy,” J. Chem. Phys. 147, 135101 (2017). 10.1063/1.4996174 [DOI] [PubMed] [Google Scholar]
- 27.Jorgensen W. L., Chandrasekhar J., Madura J. D., Impey R. W., and Klein M. L., “Comparison of simple potential functions for simulating liquid water,” J. Chem. Phys. 79, 926–935 (1983). 10.1063/1.445869 [DOI] [Google Scholar]
- 28.Phillips J. C., Braun R., Wang W., Gumbart J., Tajkhorshid E., Villa E., Chipot C., Skeel R. D., Kale L., and Schulten K., “Scalable molecular dynamics with namd,” J. Comput. Chem. 26, 1781–1802 (2005). 10.1002/jcc.20289 [DOI] [PMC free article] [PubMed] [Google Scholar]
- 29.Huang J. and MacKerell A. D., “Charmm36 all-atom additive protein force field: Validation based on comparison to nmr data,” J. Comput. Chem. 34, 2135–2145 (2013). 10.1002/jcc.23354 [DOI] [PMC free article] [PubMed] [Google Scholar]
- 30.Briman M., Armitage N., Helgren E., and Grüner G., “Dipole relaxation losses in dna,” Nano Lett. 4, 733–736 (2004). 10.1021/nl049961s [DOI] [Google Scholar]
- 31.Cole K. S. and Cole R. H., “Dispersion and absorption in dielectrics i. alternating current characteristics,” J. Chem. Phys. 9, 341–351 (1941). 10.1063/1.1750906 [DOI] [Google Scholar]
- 32.Alexandrov B., Gelev V., Bishop A., Usheva A., and Rasmussen K., “Dna breathing dynamics in the presence of a terahertz field,” Phys. Lett. A 374, 1214–1217 (2010). 10.1016/j.physleta.2009.12.077 [DOI] [PMC free article] [PubMed] [Google Scholar]
- 33.Man V. H., Pan F., Sagui C., and Roland C., “Comparative melting and healing of b-dna and z-dna by an infrared laser pulse,” J. Chem. Phys. 144, 145101 (2016). 10.1063/1.4945340 [DOI] [PubMed] [Google Scholar]
- 34.Pal S. K., Zhao L., and Zewail A. H., “Water at dna surfaces: ultrafast dynamics in minor groove recognition,” Proc. Natl. Acad. Sci. U. S. A. 100, 8113–8118 (2003). 10.1073/pnas.1433066100 [DOI] [PMC free article] [PubMed] [Google Scholar]
- 35.Ponomarev S. Y., Thayer K. M., and Beveridge D. L., “Ion motions in molecular dynamics simulations on dna,” Proc. Natl. Acad. Sci. U. S. A. 101, 14771–14775 (2004). 10.1073/pnas.0406435101 [DOI] [PMC free article] [PubMed] [Google Scholar]
- 36.Bohr H. and Bohr J., “Microwave-enhanced folding and denaturation of globular proteins,” Phys. Rev. E 61, 4310 (2000). 10.1103/physreve.61.4310 [DOI] [PubMed] [Google Scholar]
- 37.Alexandrov B. S., Rasmussen K. Ø., Bishop A. R., Usheva A., Alexandrov L. B., Chong S., Dagon Y., Booshehri L. G., Mielke C. H., Phipps M. L. et al. , “Non-thermal effects of terahertz radiation on gene expression in mouse stem cells,” Biomed. Opt. Express 2, 2679–2689 (2011). 10.1364/boe.2.002679 [DOI] [PMC free article] [PubMed] [Google Scholar]
- 38.Alexandrov B. S., Phipps M. L., Alexandrov L. B., Booshehri L. G., Erat A., Zabolotny J., Mielke C. H., Chen H.-T., Rodriguez G., Rasmussen K. Ø. et al. , “Specificity and heterogeneity of terahertz radiation effect on gene expression in mouse mesenchymal stem cells,” Sci. Rep. 3, 1184 (2013). 10.1038/srep01184 [DOI] [PMC free article] [PubMed] [Google Scholar]
- 39.Titova L. V., Ayesheshim A. K., Golubov A., Rodriguez-Juarez R., Woycicki R., Hegmann F. A., and Kovalchuk O., “Intense thz pulses down-regulate genes associated with skin cancer and psoriasis: a new therapeutic avenue?,” Sci. Rep. 3, 2363 (2013). 10.1038/srep02363 [DOI] [PMC free article] [PubMed] [Google Scholar]
- 40.Bogomazova A., Vassina E. M., Goryachkovskaya T., Popik V., Sokolov A., Kolchanov N., Lagarkova M., Kiselev S., and Peltek S., “No dna damage response and negligible genome-wide transcriptional changes in human embryonic stem cells exposed to terahertz radiation,” Sci. Rep. 5, 7749 (2015). 10.1038/srep07749 [DOI] [PMC free article] [PubMed] [Google Scholar]
- 41.Garaj-Vrhovac V., Horvat D., and Koren Z., “The effect of microwave radiation on the cell genome,” Mutat. Res. Lett. 243, 87–83 (1990). 10.1016/0165-7992(90)90028-i [DOI] [PubMed] [Google Scholar]
- 42.Faridi K. and Khan A. A., “Effects of radiofrequency electromagnetic radiations (rf-emr) on sector ca3 of hippocampus in albino rats-a light and electron-microscopic study,” Curr. Neurobiol. 4, 13–18 (2013), ISSN 0975-9042. [Google Scholar]
- 43.Cisse I. I., Kim H., and Ha T., “A rule of seven in watson-crick base-pairing of mismatched sequences,” Nat. Struct. Mol. Biol. 19, 623 (2012). 10.1038/nsmb.2294 [DOI] [PMC free article] [PubMed] [Google Scholar]
- 44.Martyna G. J., Tobias D. J., and Klein M. L., “Constant pressure molecular dynamics algorithms,” J. Chem. Phys. 101, 4177–4189 (1994). 10.1063/1.467468 [DOI] [Google Scholar]
- 45.Feller S. E., Zhang Y., Pastor R. W., and Brooks B. R., “Constant pressure molecular dynamics simulation: the langevin piston method,” J. Chem. Phys. 103, 4613–4621 (1995). 10.1063/1.470648 [DOI] [Google Scholar]
- 46.Hinckley D. M., Freeman G. S., Whitmer J. K., and De Pablo J. J., “An experimentally-informed coarse-grained 3-site-per-nucleotide model of dna: Structure, thermodynamics, and dynamics of hybridization,” J. Chem. Phys. 139, 144903 (2013). 10.1063/1.4822042 [DOI] [PMC free article] [PubMed] [Google Scholar]
- 47.Qamhieh K., Wong K.-Y., Lynch G. C., and Pettitt B. M., “The melting mechanism of dna tethered to a surface,” Int. J. Numer. Anal. Model. 6, 474 (2009). [PMC free article] [PubMed] [Google Scholar]
- 48.He Y., Shang Y., Liu Y., Zhao S., and Liu H., “Melting dynamics of short dsdna chains in saline solutions,” SpringerPlus 4, 777 (2015). 10.1186/s40064-015-1581-7 [DOI] [PMC free article] [PubMed] [Google Scholar]
- 49.Richert R., “Confinement effects in bulk supercooled liquids,” Eur. Phys. J.: Spec. Top. 189, 223–229 (2010). 10.1140/epjst/e2010-01326-8 [DOI] [Google Scholar]
- 50.Morrison L. E. and Stols L. M., “Sensitive fluorescence-based thermodynamic and kinetic measurements of dna hybridization in solution,” Biochemistry 32, 3095–3104 (1993). 10.1021/bi00063a022 [DOI] [PubMed] [Google Scholar]
- 51.Bezanilla F., “How membrane proteins sense voltage,” Nat. Rev. Mol. Cell Biol. 9, 323 (2008). 10.1038/nrm2376 [DOI] [PubMed] [Google Scholar]
- 52.Towns J., Cockerill T., Dahan M., Foster I., Gaither K., Grimshaw A., Hazlewood V., Lathrop S., Lifka D., Peterson G. D. et al. , “Xsede: accelerating scientific discovery,” Comput. Sci. Eng. 16, 62–74 (2014). 10.1109/mcse.2014.80 [DOI] [Google Scholar]


