

Introduction
Ocean temperatures will increase significantly over the next 100 years due to global climate change1. As temperatures increase beyond current ranges, it is unclear how adaptation will impact the distribution and ecological role of marine microorganisms2. To address this major unknown, we imposed a stressful high temperature regime for 500 generations on a strain from the abundant marine Roseobacter clade. High temperature adapted isolates significantly improved their fitness but also increased biofilm formation at the air-liquid interface. Furthermore, this altered lifestyle was coupled with genomic changes linked to biofilm formation in individual isolates as well as dominant in evolved populations. We hypothesize that increasing biofilm formation was driven by lower oxygen availability at elevated temperature and observe a relative fitness increase at lower oxygen. The response is uniquely different from Escherichia coli adapted to high temperature3 as only 3% of mutated genes were shared in both studies. Thus, future increased temperatures could have a direct effect on organismal physiology and an indirect effect via a decrease in ocean oxygen solubility leading to an alteration in microbial lifestyle.
Climatically driven temperature shifts may extend beyond the confines of acclimation resulting in organisms requiring adaptations to cope with thermal stress4–6. Due to their short generation times and large populations, bacteria may evolve concurrently with ocean temperature changes6,7. Thus, environmental change can select for different existing lineages but could also lead to selection of de novo beneficial mutations. In model laboratory studies (e.g., Escherichia coli), short-term adaptation to high temperature leads to mutations in genes involved in transcriptional and translational regulation, as broad regulation level changes can shift an organism towards a pre-stressed state8. When E. coli evolved to high temperature, all 115 independent isolates had mutations in the RNA polymerase operon or in rho, a termination factor, both of which broadly regulate transcription3. Other researchers have seen a negative correlation between temperature and the concentrations of cellular protein and ribosomes in existing marine bacteria, leading to a large impact on their cellular resource allocation and biogeochemical role9–11. However, the physiological outcome of adaptation to higher thermal environments is largely unknown in abundant marine bacterial lineages.
The marine Roseobacter clade is an abundant heterotrophic bacterial group representing up to 25% of cells in marine communities12 and plays an important role in marine ecosystem functioning13. They proliferate in coastal and polar waters across a broad temperature range12,14. Members of the clade can be planktonic or associated with biofilms and often interact with particles or other organisms15. Due to the widespread range, generalist lifestyle, and importance in carbon and sulfur biogeochemical cycles, it is critical to understand how marine Roseobacter will adapt to changes in ocean conditions.
To investigate the capacity and ecological implications of adaptation to warmer ocean environments, we experimentally evolved a member of the Roseobacter clade, Roseovarius sp. strain TM1035, to a high temperature that coastal marine phytoplankton could experience by year 2100 (Supplementary Fig. 1). We hypothesized that fitness would rapidly increase and that adaptation to higher temperature would result in changes in growth and resource allocation strategies. We followed this phenotypic characterization with genomic sequencing at the individual and population level hypothesizing that the genotypic basis for adaptation would be diverse. Finally, to explore the generality of short-term bacterial evolutionary responses to high temperature, we compared the biochemical mechanisms for adaptation to high temperature with those found in E. coli.
To test our hypotheses, we evolved replicate (2 × 22) populations of Roseovarius sp. TM1035 to the optimal (low, 25°C) and high (33°C) temperature for 500 generations (Supplementary Figs. 2, 3) and randomly picked an isolate from each population for downstream physiological analyses and sequencing. We found that Roseovarius sp. TM1035 had the capacity to evolve rapidly. High temperature adapted lines (HTLs) had a significantly elevated selection rate constant at 33°C compared to 25°C (Fig. 1, Supplementary Figs. 4, 5, Supplementary Table 1, one sample t-test, p=9.78e-05).
Figure 1. Increased fitness of HTLs competed against control temperature line 10.
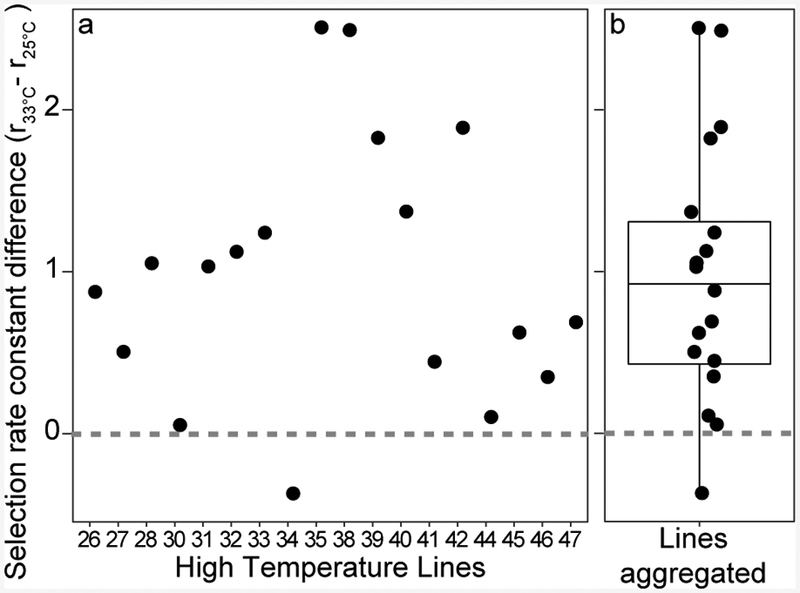
a, Difference between selection rate constants (r) of High Temperature Lines (HTLs), n=18 biological replicates, relative to line 10 (L10) competed at 33°C and 25°C. b, boxplot of values in a. Boxplot represents the interquartile range including the median and the ends of the whiskers represent ±1.5*interquartile range. Gray dashed line represents if L10 and HTLs had the same rate constant difference. Data exclusions explained in methods.
Over the course of the experiment, high temperature populations increased biofilm production at the air-liquid interface (Supplementary Figs. 6, 7, Supplementary Table 2) and colonies formed wrinkly types in several populations (Supplementary Fig. 2, Supplementary Table 3). In contrast, biofilm formation was rare in the low temperature adapted populations (Fig. 2, Supplementary Fig. 6). The ancestor, LTLs, and HTLs differed in their level of biofilm formation when grown at 25°C suggesting that this phenotype was the outcome of adaptation and not acclimation (Fig. 2a, 2b, Supplementary Table 4, p=2.2e-04). However, the level of biofilm formed was also variable among the HTLs (Supplementary Table 4, nested ANOVA, p<2e-16). Additionally, growth rates of HTLs were slightly higher than LTLs when grown at 33°C (Supplementary Fig. 8, Supplementary Table 4, nested ANOVA, p=3.7e-03). We also assessed the elemental composition of the isolates but found no significant difference between groups (Supplementary Fig. 9, Supplementary Table 5). Thus, adaptation to high temperature led to increased biofilm formation at the air-liquid interface but did not alter resource requirements.
Figure 2. Changes in phenotypes due to adaptation.
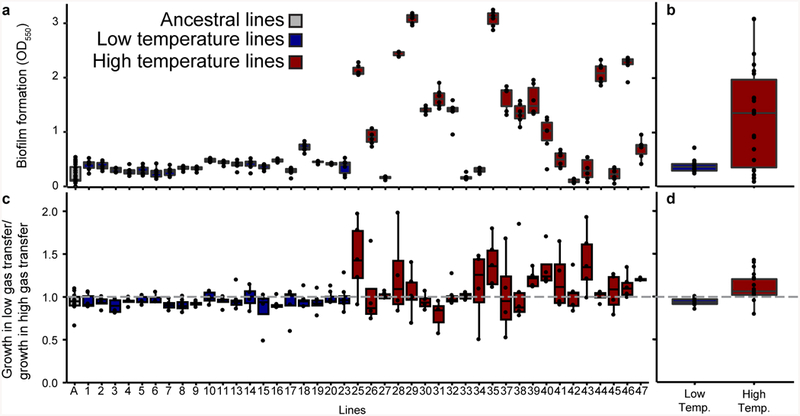
a, biofilm formation as measured by crystal violet assay grown at 25°C, n = 6 technical replicates of 22 HTLs and 20 Control Temperature Lines (CTLs), n=40 technical replicates of ancestor. b, as in a, but mean of isolate line aggregated by temperature regime. c, growth ratio of low vs. high gas transfer flasks, 22 HTLs and 20 CTLs with numbers of independent cultures described in methods. d, as in c, but mean of isolate line aggregated by temperature regime. A value at the dashed line of 1 represents clones that grew equally well in their low and high gas transfer flasks. In all, boxplots represent the interquartile range including the median and the ends of the whiskers represent ±1.5*interquartile range. For b and d, low temperature lines n=20 and high temperature lines n=22.
We hypothesized that biofilm formation may be a response to oxygen limitation as oxygen solubility in seawater decreases 12.1% between 25°C and 33°C16. In support, we observed less oxygen availability for the ancestor grown at 33°C vs. 25°C (Supplementary Fig. 10). Thus, we next tested (i) if HTLs had improved access to oxygen and (ii) had improved fitness for growth under low oxygen availability. First, we manipulated the volume-normalized gas transfer rate and detected a significant difference in growth between the ancestor, LTLs, and HTLs (Supplementary Table 4, nested ANOVA, p=1.3e-04). The ancestor grew poorly in the low gas transfer environment relative to the high gas transfer environment (mean ratio=0.93, sd=0.1) and continued to grow poorly when adapted to the low temperature environment (mean ratio=0.94, sd=0.04). This disadvantage was overcome in the HTLs (mean ratio=1.12, sd=0.16). On average, the HTLs grew faster in the low vs. high gas transfer environment compared to both the ancestor (Supplementary Table 4, nested ANOVA, p=0.04) and LTLs (Fig. 2c, 2d, Supplementary Table 4, nested ANOVA, p<2e-16). Secondly, we found that HTLs relative to a LTL had significantly higher selection rate constants at 1% than at 21% O2 (Supplementary Fig. 11, Supplementary Table 6, factorial ANOVA, p=2.4e-09). The combined results suggested that adaptation to higher temperature led to increased HTL fitness in low oxygen environments.
We next identified the genomic variation underlying high temperature adaptation. 182 mutations were observed among all isolates (Fig. 3a,b and Supplementary Table 7), with more mutations accrued in high (6.8) vs. low (1.7) temperature lines (Welch two-sided t-test, t=−14.27, df=35.49, p=2.9e-16). We also quantified population-wide mutations using metagenomic sequencing of high temperature populations. Many genes with established population mutations (>0.5 frequency, >2 populations) were found in isolate HTL genomes (68.2%, Supplementary Fig. 12). In contrast, mutations in genes encoding ribosomal and mobile element proteins were not detected in any isolate line’s genome. Examining the HTL mutations, most were represented in their respective populations (77.3% 106/137 mutations), while those not represented were primarily either replication slippage events (51.6%, 16/31) or synonymous mutations (16.1%, 5/31) (Supplementary Figs. 13, 14). Although isolate genomes did not capture all the diversity, there was a strong congruence between abundant mutations detected at the individual isolate and population levels.
Figure 3. Mutation distribution across the genome and compared to E. coli.
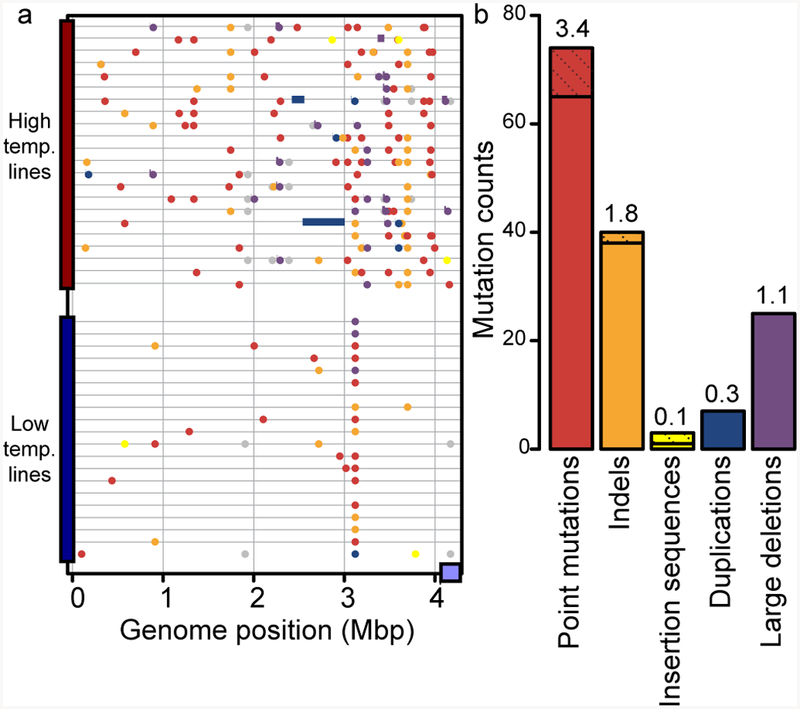
a, mutations in 42 independently evolved clones (22 HTL and 20 CTL). Mutational types are colored as in b. Purple block at end of genome is a putative plasmid sequence. b, distribution of events according to mutational type with mutations split into genic (solid) and intergenic (cross-hatched stacked on top of genic). Mbp-megabase pair; temp.-temperature.
To assess the contribution of common isolate mutations to isolate phenotypic variation, we created a linear genome-wide model based on genotypic predictors for each phenotype (Fig. 4, Supplementary Fig. 8). Overall, the models had an adjusted-R2 of 0.77 for biofilm formation, 0.46 for growth in low vs. high gas transfer environments, and 0.38 for growth rate based on 14 common mutations (>2 lines, Supplementary Table 8). Mutations varied in their contribution to each particular phenotypic model but accounted for a significant portion of the observed phenotypic variation.
Figure 4. Genotypic associations with phenotypic variation.

Multiple linear regression coefficients shown for mutations as predictors for each measured phenotype (biofilm formation (n=6 technical replicates) and growth in low vs. high gas transfer, (22 HTLs and 20 CTLs with technical replicates described in methods). Names of mutations or genes affected noted in Supplementary Table 7 and ordered by biofilm formation coefficients. Asterisk represent * : p<0.05, ** : p<0.01, *** : p<0.001 from ANOVA of linear model (Exact p-values available in Supplementary Table 8). TrkA-K+ Transporter A; CTP-Cytidine Triphosphate; HTH-Helix-Turn-Helix; Transcript.-Transcriptional; Reg.- Regulator; AraC-Arabinose C; ABC- ATP-Binding Cassette; EpsK-Exopolysaccharide K; Hfq-Host Factor of the RNA bacteriophage Qβ; LuxRI- acyl-homoserine-lactone synthase LuxI and transcriptional activator protein LuxR.
Mutations grouped broadly into broader ‘regulatory’ genes and ‘direct’ genes related to specific functional pathways. 59% of HTLs had mutations in either the quorum sensing regulators luxR + luxI or the small RNA-binding regulation protein hfq and accounted for 40% of variance in biofilm formation (Fig. 4). However, no line had concurrent mutations in hfq and luxRI suggesting negative epistasis. All lines with wrinkly morphology had a mutation in luxRI. Quorum sensing regulation is linked to biofilm formation in many bacteria and may regulate the initial transition from free-living to attached states12,17. The mutation pattern suggests that alteration of quorum-sensing controls and biofilm formation was a component of adaptation to high temperature and subtle declines in oxygen. Six HTLs had changes in or upstream of hfq (Supplementary Table 7). Hfq strongly influences gene expression via interactions with regulatory sRNAs and is involved in the bacteria stress response18. In V. cholerae and V. harveyii, Hfq degrades the luxR mRNA19. In other species, it also plays a role in biofilm formation20,21 supporting that the mutations in or near hfq influenced the observed physiology.
Many genes were associated with phenotypic changes in a more ‘direct’ fashion. Genes accounting for a significant amount of biofilm variation were directly involved in a secretion system or secreted biofilm components. This included several T1-secretion system related genes and an exopolysaccharide formation gene. Other mutations present in only a few HTLs appeared to be related to biofilms based on their annotation (Supplementary Table 7). A few mutations were associated with changes in growth rate and gas transfer phenotypes. These mutations are discussed in more depth in the Supplementary Information. Considering the diversity of mutations and their differential contributions to physiological phenotypes, there were multiple divergent genetic pathways for Roseovarius to adapt to high temperature.
We tested for the generality of adaptive response to high temperature by comparing the genetic mutations in Roseovarius sp. TM1035 HTLs with E. coli REL 12063 and found an absence of functional convergence. The strains shared some similarities in mutation type, whereby most mutations were single nucleotide point mutations (Fig. 3a,b and Supplementary Table 9). However, we saw a limited overlap in the specific genes affected by mutations (Supplementary Fig. 15, Supplementary Table 10). E. coli experienced modifications in core transcriptional regulatory genes, while Roseobacter demonstrated a genetic response supporting a changing lifestyle leading to increased biofilm formation. This phenotypic response is consistent with biofilm formation being an important component in the lifestyle of this strain and the Roseobacter clade as a whole22.
Pseudomonas develops biofilms at the air-liquid interface when grown under static culture conditions23. In this setting, oxygen is more severely limited and organisms outcompete others in the culture by increasing their access to oxygen24,25. In parallel with Pseudomonas experiments, we observed wrinkly colony morphology in several HTLs, which likely reflect adaptations to oxygen stress as wrinkles allow greater access to oxygen23. However, adaptations in Pseudomonas resulted in mutations in cellulose production (wss operon or wapH)24,25 which were not seen in Roseobacter, demonstrating that there are different avenues for genetic adaptation to increase biofilm formation. Thus, it is clear that different lineages can take unique evolutionary pathways for adaptation to high temperature and oxygen limitation and we cannot generalize an adaptive genotypic response across diverse heterotrophic bacteria.
Here, a member of the abundant marine Roseobacter showed a clear capacity for rapid adaptation to elevated temperature through a significant lifestyle change. These short-term adaptive changes may be different from the long-term establishment of phylogenetically distinct ecotypes adapted to specific environmental conditions26. However, this study does demonstrate how an abundant lineage can rapidly adapt to future conditions that fall outside the boundaries of current ocean temperatures (Supplementary Fig. 1) provided there are sufficient selective pressures. The examined Roseovarius strain was isolated from the Chesapeake Bay. In this environment, the average temperature is lower than our control temperature, but during the summer, monthly average temperatures can exceed 27°C with daily spikes above 30°C27. Moreover, this originally algal-associated strain likely experienced suboxic environments periodically in Chesapeake Bay, which can be further amplified by growth within particles28. Thus, this strain of Roseobacter may occasionally experience conditions of very high temperatures and oxygen stress.
Our work suggests that thermally-driven declining gas solubility can lead to increased competition for oxygen and lifestyle changes. However, it is unclear if truly pelagic bacteria will show a similar evolutionary response. We observed clear differences in the mutational response in this strain of Roseobacter and the distantly related E. coli suggesting that other lineages may show unique evolutionary responses depending on their lifestyle and genetic background. As a result, subtle interactions between temperature and oxygen availability can have important impacts on marine microbial diversity and functioning. As oxygen levels are predicted to decrease in the future ocean29, such derived effects of temperature changes could have important effects on future microbial ecology and biogeochemical roles.
Methods
Experimental evolution
Roseovarius sp. TM1035 was isolated from a Chesapeake Bay culture of a dinoflagellate Pfiesteria piscicida CCMP183030,31 and optimally grows at 25°C at a rate of 0.15 OD600 h−1 (Supplementary Fig. 3). A single colony of ancestral Roseovarius sp. TM1035 was grown up in 100 mL of YTSS Media (4 g/L yeast extract, 2.5 g/L tryptone, and 10 g/L sea salts) at its optimal temperature of 25°C. Then, 200 μL of culture were transferred to 44 clonal replicates, (22 control populations held at a constant low temperature of 25°C and 22 experimental populations held at a high temperature of 33°C), which were serially propagated (every 30 or 48 hours respectively to reduce stationary phase dynamics) for 500 generations in 10 mL YTSS media under rigorous shaking. Sample sizes were chosen to be larger than other experimental evolution studies32. At the initiation of the experiment, the ancestor was also preserved from the same starting culture for later comparison. Line numbers refer to position in shakers with P12, P24, P36, and P48 representing media blanks to rule out cross-contamination occurring during the experiment. Two low temperature populations (P21 and P22) were removed from the experiment due to contamination. Plate checks and a 16S rRNA PCR assay check were used to check for contamination (Supplementary Fig. 16). For the 16S rRNA PCR assay, colonies of interest were diluted in nuclease free water, boiled for one minute, and PCR amplified using 16S rRNA primers targeting Roseovarius sp. TM1035. Primers were 16S rRNA Forward 5′-ACT AGG GTT TTG GCC CGA TG-3′ and 16S rRNA Reverse 5′-CTT TCC CCC AAA GGG CGT AT −3′. After 500 generations, populations were frozen and then streaked on an agar plate. A single colony was picked at random, streaked again on agar and a single colony picked at random for genome sequencing. These isolate lines were cultured for two days in 10 mL YTSS media at 25°C or 33°C depending on their experimental temperature, and 5 mL was used for DNA extraction, while the remainder was concentrated and frozen for fitness and physiological assays.
Fitness assay
To begin all post-experimental evolution assays, isolate lines were taken from frozen stock and incubated for two days at 25°C, transferred via 50-fold dilution into 25°C for two days, and then transferred again to start each experiment. Although the HTLs had evolved at 33°C in YTSS, it is common practice in thermal stress studies to allow isolate lines to recover from freezing under less stressful conditions32,33.
To capture fitness changes, a restriction enzyme assay was developed to estimate an allele frequency. We randomly picked an LTL (L10) with an independent SNP as control. We then found a restriction enzyme targeting the ancestral sequence (but not L10) and primers surrounding this genomic region were selected. HTLs, the ancestor, and L10 were grown up as before, mixed in equal pairwise proportions as identified by flow cytometry cell counts, n=3 technical replicates per culture (Supplementary Fig. 17, NovoExpress, NovoCyte, ACEA Biosciences, San Diego, CA), sampled at t0=0 h, then grown for approximately t1=36 h in either 25°C or 33°C. After 36 h DNA was extracted from samples using Wizard Genomic DNA Purification Kit (Promega, Madison, WI) and stored at −20°C. PCR was performed in a volume of 20 μL with 5.5 μL autoclaved Milli-Q water, 10 μL Failsafe Premix F (Epicentre, Madison, WI), 0.125 U/μL 5PRIME HotMaster Taq DNA polymerase (Quantabio, Beverly, MA), 4 uM forward primer 5’-CGTGCAAGGTTCCTCGTTTG-3’ (IDT, Coralville, IA), 4uM reverse primer 5’-TTTGCCAAAGGCCATCAAGC-3’ (IDT, Coralville, IA), and 0.1 ng/μL of extracted DNA. The C1000 Touch Thermo Cycler (Bio-Rad, Hercules, CA) reaction conditions were 2 minutes at 94°C, proceeded by 30 cycles (94°C for 30 seconds, 60°C for 40 seconds, 72°C for 1 minute) and a final extension at 72°C for 10 minutes before holding at 4°C.
The restriction enzyme digest was performed following PCR completion using the Olil enzyme that targets CACNNNNGTG (ThermoFisher Sci. Catalog #ER1631, Waltham, MA). A mutation in L10 produced a SNP resulting in cut fragments of lengths 542 bp, 315 bp, and 32 bp. All other isolate lines (HTLs: L25–L47 and Ancestor) had fragment sizes of 132 bp, 410 bp, 315 bp, and 32 bp. The restriction enzyme mixture contained 10 μL PCR reaction mixture, 18 μL of nuclease-free water, 2 μL of 10X Buffer R, and 1 μL Olil enzyme. After mixing and spinning down the mixture, the Olil enzyme digest was incubated in a water bath at 37°C for 14 hours and inactivated by incubation at 65°C for 20 minutes. The initial PCR mixture, enzyme digest, and 1 kB plus DNA Ladder (Thermo Fisher Sci. Catalog #SM1331, Waltham, MA) were run on a 2% agarose gel. After all the digest and PCR products from L25 were run, the bands were too faint for analysis resulting in no digest results for L25. For all other isolate lines, 15 μL of digested material + 3 μL 6X loading dye was used for agarose gels.
The band fragments were analyzed using Quantity One analysis software (Bio-Rad, Hercules, CA). After framing the lanes and subtracting background noise, bands were identified as follows. Band fragment 542 bp indicated L10, 410 bp for L25–L47 and ancestor, and 315 bp for all isolate lines. Primer dimers were excluded in the analysis. Relative quantity was defined as the percent of signal intensity of the matched bands. Changes in relative band quantity after 36 h growth were calculated relative to the initial 50:50 relative band intensity. Because the bands for the ancestor 50:50 mixture were too faint for analysis, changes in band quantity at 36 h could not be calculated for the ancestor or L37. The bands for L29 were faint at 36h in 33°C the selection rate constant could not be calculated. L10 dominated against L43 in 25°C, thus the selection rate constant could not be calculated as it requires the presence of L43 in both environments. See Supplementary Figs. 4 and 5 for additional proportions and selection rate constants not captured in Fig. 1.
In addition, isolate lines that form wrinkly colonies distinct from the smooth ancestral morphology were competed against the ancestor or L10. Competitions were plated on YTSS agar plates at t0=0 and t1=48 h for ancestor experiment and t1=36 h for L10 experiment from the 25°C and 33°C cultures (Supplementary Fig. 4). Selection rate contant, r, and relative fitness, w, of HTL relative to L10 or the Ancestor were calculated, as done previously following equations outlined in Lenski and co-workers34, either from colony morphology on plates or allele frequencies35 from the restriction enzyme assay (Supplementary Fig. 5). The difference in selection rate constants at 33°C and 25°C were calculated and a two-sided, one-sample t-test against a difference of 0 was performed (Supplementary Table 1). We compared this allele frequency method to conventional methods of characterizing fitness using wrinkly colonies as a marker (Supplementary Fig. 5e,h, correlation coefficient r=0.71 for selection rate constant (r) and correlation coefficient r=0.89 for relative fitness (w) with p-values from cor.test in R). In this independent fitness assay, isolates with wrinkly colonies (n=7 lines) improved fitness at high temperature relative to L10 or the ancestor (Supplementary Table 1, Two-way ANOVA, p=8.7e-05) consistent with the restriction enzyme assay for more of the high temperature lines.
Physiological assays
Biofilm formation was quantified in 96-well microplates using a modified crystal violet method36. This assay likely underestimates biofilm formation because the biofilm must remain attached to the plate after the wash to be quantified. 100 μL of 50-fold diluted cultures were pipetted into 6 technical replicates for isolate lines (HTLs and CTLs), 40 for the ancestor. Plates were kept shaking (120 rpm) at either 25°C for 48 hours. After incubation, plates were gently rinsed with milli-Q water six times and 125 μL of 0.1% crystal violet stain was added and incubated at room temperature for 15 minutes. Plates were rinsed six times and left to dry. After drying, 125 μL of 30% acetic acid was added to solubilize the remaining stain and quantified on a spectrophotometer at 550 nm (Gen5, Synergy Multi-mode Reader, BioTek, Winooski, VT).
To remove the confounding variable of temperature, cultures were diluted 50-fold into either 10 mL or 20 mL of media and incubated shaking at 33°C in 50 mL flasks for the oxygen limitation assay. In a 50 mL, shaking flask, 10 mL of media should be more aerated with a surface to volume ratio of 1.77 cm2/mL than 20 mL of media with a surface to volume ratio of 0.71 cm2/mL37. Optical density (OD) was measured at 600 nm on a spectrophotometer. Technical replicates were variable between lines and were accounted for in linear model (Supplementary Table 4). Numbers of technical replicates for each line are as follows: L1:6, L2:5, L3:4, L4:5, L5:5, L6:3, L7:4, L8:6, L9:6, L10:5, L11:5, L13:5, L14:4, L15:4, L16:5, L17:5, L18:6, L19:6, L20:7, L23:7, L25:6, L26:4, L27:5, L28:4, L29:5, L30:4, L31:3, L32:5, L33:4, L34:4, L35:5, L37:4, L38:5, L39:5, L40:4, L41:4, L42:5, L43:5, L44:4, L45:4, L46:5, L47:4, LA:13. Growth rates were determined from a subset of the 20 mL flasks (last 3 full experiments (n=3 for CTLs and HTLs and n=7 for the ancestor) and calculated from the OD measurements at approximately 9 hours and 22 hours at 33°C.
A competition assay was performed at 21% and 1% atmospheric oxygen between LTL 10 and HTLs with the wrinkly colony morphology (L25, L28, L30, L35, L38, L44, and L46). Lines were grown individually from frozen single colony populations for 72 hours at 25°C in 10 ml of YTSS media and then cell concentrations were measured by flow cytometer as described before. A 50/50 mixture of L10 with each of the other HTLs was created and 50/50 mixtures were plated. To obtain the appropriate atmospheres (21% and 1% O2), 100% nitrogen gas was flushed into each 40 mL vial for two minutes, sealed, and either 8.4 or 0.4 mL of N2 gas was removed as an equal amount of 100% oxygen gas was added through the septum to obtain 21% and 1% O2 atmospheres, respectively. Then, 9.8 ml of YTSS media and 200 μL of the 50/50 cell mixture were added to each vial through the rubber stopper in triplicate. The vials were allowed to depressurize with a second syringe needle when the YTSS media and 50/50 cell mixture were added. The mixed cultures were placed in a shaking incubator at 25°C for 48 h after which each was plated onto YTSS media to determine quantities of wrinkly and smooth colonies.
Stoichiometric assays quantified particulate organic carbon (POC), nitrogen (PON) and phosphorus (POP). The ancestor, low, and high temperature adapted lines were grown at 33°C with two technical replicates each and 1.5 mL culture was filtered onto a 0.7 μm glass fiber filter during late exponential phase to maximize biofilm accumulation. For POC and PON, filters were packed into a 30 mm tin capsule (CE Elantech, Lakewood, NJ) and analyzed on a FlashEA 1112 nitrogen and carbon analyzer (Thermo Scientific, Waltham, MA) following Sharp38. To quantify POP, filters were analyzed using a modified ash-hydrolysis method39. This was repeated three times, technical replicates were averaged first before the mean of three biological replicates was taken. Outliers in all analyses above or below 5 SD range were removed iteratively (2 from gas transfer assay).
Dissolved oxygen volume comparison
To demonstrate the assumption in the physiological experiment testing for differences in growth due to changes in oxygen transfer rather than other gasses we measured dissolved oxygen in in different volumes of water. For each run, a beaker was filled with either 500 or 1000 mL of Milli-Q water and brought up to a set temperature (24°C or 32°C). The dissolved oxygen (DO) concentration was decreased to less than 0.10mg/L by bubbling nitrogen gas into the beaker. Next the beaker was placed in a shaking incubator set to 118rpm and 24°C or 32°C. The DO concentration and temperature of the water was measured every 90 seconds using a YSI Professional Plus instrument until DO saturation was reached. Triplicate measurements were taken. Observations were fitted to the following equation to determine the saturating DO (Csat) and the oxygen transfer coefficient (KLaT) in Matlab. The coefficient a is the ratio of area to volume (A/V).
| (equation 1.1) |
The oxygen transfer rate was determined over time using the following equation:
| (equation 1.2) |
Dissolved oxygen culture comparison
The ancestor strain was grown for 2 days at 25°C. Cells from the frozen single cell colony were inoculated in 10 mL of YTSS media. This was done in four replicates. After 36 h, 200uL of the ancestor replicate was added to 13.8 mL of YTSS media. Fourteen mL were used to cover the dissolved oxygen probe in a larger test tube than the original experiment due to instrument size. In total, four replicates were grown at 25°C and four replicates at 33°C for two days. Dissolved oxygen was measured using a YSI Professional Plus Series instrument. The initial DO, temperature, and pH were read in a media blank at room temperature. Afterwards the DO was measured at several time points over the next 47 hours. A final DO and pH reading was taken by pooling the cultures at 25°C and at 33°C. The cultures were pooled to obtain enough liquid volume to cover the probes and pH increased from 6.83 at room temperature before the experiment to 7.03 at 25°C and 7.6 at 33°C at the end, n=1.
Genome sequencing of isolate lines
DNA was extracted using Mini Genomic DNA Kit (Plant), (IBI Scientific, Peosta, IA) and purified with Genomic DNA Clean & Concentrator kit (Zymo, Irvine, CA). DNA concentration was quantified with Qubit dsDNA high sensitivity assay kit (Life Technologies) and subsequently diluted to a concentration of 0.2 ng/μl. Using 1 ng of genomic DNA from each population’s isolate line, libraries were created and manually pooled using Illumina NexteraXT library preparation kits with NexteraXT barcodes (Illumina, San Diego, CA). The resulting library was checked and quantified on a BioAnalyzer. The pooled libraries were sequenced on two separate runs of the Illumina HiSeq 2500 sequencer producing either paired-end (2 × 100 bp) or single-end (1 × 100 bp) reads with half of the HTLs and LTLs on each run (Supplementary Table 11). The sequence reads were reassembled against the draft genome of Roseovarius sp. TM103530 using CLC Genomics Workbench (Version 9.0.1, www.qiagenbioinformatics.com) and CLC Genomics Finishing Module (Version 1.6) with 3 libraries to a coverage of 1180X. The assembly was assessed using REAPR40 and possible issues due to repeats were compiled but dismissed when checked against the mate-pair library generated during the original sequencing of Roseovarius sp. TM1035 (Supplementary Table 12). After reassembly, this strain appeared to have a plasmid with a length of 156,827 bp and a chromosomal sequence that was 4,046,715 bp long.
The genome was reannotated using the online RAST server41. Molecular changes in each isolate line were called against the assembled ancestral sequence as a reference using breseq in consensus mode42. Many inaccurate polymorphism predictions arise from strand bias during library preparation and sequencing and we used a cutoff of (α=0.01) with breseq’s two-sided Fisher’s exact test to identify spurious polymorphisms with this bias. breseq has a harder time assessing rearrangements involving repeat-regions and duplications42. Thus rearrangements predicted, but not confirmed by breseq, were manually checked in CLC Genomics Workbench 9. As well, a 2-fold increase in read coverage over the ancestor coupled with a breseq junction mapping the endpoints of this increase indicated a duplication event.
The mutations found in Roseovarius sp. TM1035 were compared to the mutations found in E. coli evolved to high temperature3. The REL1206 genome was annotated using the same RAST pipeline as Roseovarius sp. TM1035. Genes were included in the genic subset if the molecular change overlapped with a RAST called gene (including multigenic deletions or duplications). Intergenic mutations or mutations extending into an intergenic region included the two neighbouring genes surrounding a mutation. Genes were clustered by homology using OrthoMCL V1.4 with default settings43.
Genotype-phenotype model
A genome-wide least squares linear regression model was used to associate mutations with changes in growth rate, biofilm formation, and growth in low vs. high gas transfer environments across all isolate lines, including the ancestor, based on shared mutations. Mutations found in several isolate lines provided the best information for associations; accordingly we only included in our linear regression model mutations that were found in three or more lines. Some mutations were correlated with each other; consequently we removed the mutation that contributed less to the models. Mutations in hfq were correlated with T1SS secreted agglutinin RTX, mutations in epimerase/dehydratase were correlated with CTP synthase and the T1SS repeat protein, and mutations in the large deletion 1 were correlated with the C4-dicarboxylate proteins DctBD (Supplementary Table 13). An ANOVA of the model fit was performed and significant coefficients were noted (Fig. 4, Supplementary Table 8). All statistical analyses were performed in R (Version 3.3)44.
Metagenomic sequencing
Populations of high temperature lines at generation 500, along with the ancestor were started in YTSS media as before. Populations were sampled at approximately 36 h. DNA was extracted, and libraries prepared using the same procedure as the clonal lines. Samples were sequenced on Illumina Hi-Seq 4000, paired end 2×150bp. Sequences were analyzed using Breseq on polymorphic settings which calculates mutation frequencies. Population mutations that were also identified in the ancestor line frequency>0.15 were removed. Mutations were manually checked for consistency when changes could occur at different genomic positions (i.e. indel in a repeat region). Identified population mutations were compared to those found in the clonal lines at both the nucleotide level and at the genic level, i.e if the clonal line and the population from which it was derived had the same mutation this was considered shared at the nucleotide level.
Future Ocean Temperatures
The CCSM4 global climate model from the Coupled Model Intercomparison Project, CMIP5 was used to illustrate the global current and future surface temperature. We used the current temperature as predicted by the model for August 2006 and the future as August 2100. Both are calculated using the RCP8.5 scenario, which represents a business-as-usual where emissions continue to increase throughout the 21st century45. The data was downloaded from World Climate Research Programme website for CMIP5 model outputs (https://esgf-node.llnl.gov/search/cmip5/).
Statistical methods
To compare physiological phenotypes (biofilm, differing gas transfer environments, growth rate) by group we applied a nested analysis of variance of experimental group (ancestral, low, and high temperature) with nested ‘line’ on growth rate measured at 33°C, biofilm formation measured at 25°C and ratio of growth in differing gas transfer environments measured at 33°C use lme446 which uses Satterthwaite approximation for degrees of freedom (Supplementary Table 4). We used Brown-Forsyth test to test for unequal variances. We tested variance of experimental group (ancestral, low, and high temperature lines) with Kruskal-Wallis nonparametric test and p-values from pairwise comparisons using Wilcoxon rank sum test to compare groups against one-another, p-value was adjusted with a Bonferroni correction. To assess fitness in low versus high oxygen environments, we competed wrinkly colony lines against low temperature line 10 and used a three-way factorial analysis of variance to test differences between thermal environments, technical replicates, and biological lines.
To assess if high temperature lines had higher fitness than control lines or the ancestor, we used a two-way factorial analysis of variance of high temperature line fitness at either 25°C or 33°C against both the ancestor and the control line 10 and measured by both selection rate constant (r) or relative fitness (w). Post-hoc test performed using Tukey multiple comparisons of means with 95% confidence interval. To assess if our restriction enzyme assay accurately reflects standard measures of fitness, we correlated colony morphology selection rate constants with restriction enzyme selection rates using Spearman correlation and cor.test which calculates p-values using algorithm AS 8947. To compare selection rate differences, we applied a one-sample t-test to assess whether there was a significant difference between selection rates of high temperature lines against control line 10 when grown at 33°C versus 25°C by calculating the difference and comparing to a null hypothesis that the difference is 0 (Supplementary Table 1).
Data availability
The data supporting the results of this study are available within the paper and its Supplementary Information and Supplementary Data Files. The assembled genome and sequences from clonal lines used in this study have been deposited in NCBI BioProject database under accession PRJNA386804, SAMN07134944: SAMN07134988 for the isolate sequences associated with Figures 3 and 4, and Supplementary Figure 18, SAMN09238774: SAMN09238795 for the population sequences associated with Supplementary Figures 12, 13, and 14, and SAMN07138891 for the genome assembly renamed RAK1035 to distinguish from RTM1035 and associated with Figures 3 and 4 and Supplementary Figures 12, 13, 14, 15, and 18.
Supplementary Material
Acknowledgements
We thank Jennifer Martiny and Brandon Gaut for many helpful comments, Celine Mouginot, Teghveer Kooner, and Krista Linzner for laboratory assistance, and Robert Belas for permission to use this strain. We also acknowledge the World Climate Research Programme’s Working Group on Coupled Modelling and we thank the climate modeling groups listed in the Methods for creating and making available their CMIP5 model output. For CMIP, the U.S. Department of Energy’s Program for Climate Model Diagnosis and Intercomparison leads research in partnership with the Global Organization for Earth System Science Portals. AGK was supported by the National Science Foundation-Graduate Research Fellowship Program (DGE-1321846) and the National Institute of Biomedical Imaging and Bioengineering, National Research Service Award EB009418 from the University of California, Irvine, Center for Complex Biological Systems. CAG was supported by NASA Headquarters under the NASA Earth and Space Science Fellowship (15-EARTH15F-0335). ACM was supported by the National Science Foundation (OCE-1559002 and OCE-1046297).
Footnotes
Supplementary information is available for this paper.
Reprints and permissions information is available at www.nature.com/reprints.
Correspondence and requests for materials should be addressed to ACM.
Competing interests
The authors declare no competing financial interests.
References
- 1.Parry M, Canziani O, Palutikof J, van der Linden P & Hanson C Climate Change 2007: Impacts, Adaptation and Vulnerability. IPCC Clim. Chang. 2007 Impacts, Adapt. Vulnerability 976 (2007). [Google Scholar]
- 2.Hutchins DA & Fu F Microorganisms and ocean global change. Nat. Microbiol 2, 1–11 (2017). [DOI] [PubMed] [Google Scholar]
- 3.Tenaillon O et al. The molecular diversity of adaptive convergence. Science 335, 457–461 (2012). [DOI] [PubMed] [Google Scholar]
- 4.Franks SJ & Hoffmann A a. Genetics of climate change adaptation. Annu. Rev. Genet 46, 185–208 (2012). [DOI] [PubMed] [Google Scholar]
- 5.Bergmann N et al. Population-specificity of heat stress gene induction in northern and southern eelgrass Zostera marina populations under simulated global warming. Mol. Ecol 19, 2870–2883 (2010). [DOI] [PubMed] [Google Scholar]
- 6.Thomas MK, Kremer CT, Klausmeier CA & Litchman E A global pattern of thermal adaptation in marine phytoplankton. Science 338, 1085–1088 (2012). [DOI] [PubMed] [Google Scholar]
- 7.Collins S Many possible worlds: Expanding the ecological scenarios in experimental evolution. Evol. Biol 38, 3–14 (2010). [Google Scholar]
- 8.Hug SM & Gaut BS The phenotypic signature of adaptation to thermal stress in Escherichia coli. BMC Evol. Biol 1–12 (2015). [DOI] [PMC free article] [PubMed] [Google Scholar]
- 9.Nielsen ES & Jørgensen EG The Adaptation of Plankton Algae. Physiol. Plant 21, 401–413 (1968). [Google Scholar]
- 10.Toseland A et al. The impact of temperature on marine phytoplankton resource allocation and metabolism. Nat. Clim. Chang 3, 979–984 (2013). [Google Scholar]
- 11.Linzner KA, Kent AG & Martiny AC Evolutionary pathway determines the stoichiometric response of Escherichia coli adapted to high temperature. Front. Ecol. Evol 5, 1–8 (2018). [Google Scholar]
- 12.Wagner-Döbler I & Biebl H Environmental biology of the marine Roseobacter lineage. Annu. Rev. Microbiol 60, 255–80 (2006). [DOI] [PubMed] [Google Scholar]
- 13.Moran MA et al. Genome sequence of Silicibacter pomeroyi reveals adaptations to the marine environment. Nature 432, 910–3 (2004). [DOI] [PubMed] [Google Scholar]
- 14.Giebel HA, Brinkhoff T, Zwisler W, Selje N & Simon M Distribution of Roseobacter RCA and SAR11 lineages and distinct bacterial communities from the subtropics to the Southern Ocean. Environ. Microbiol 11, 2164–2178 (2009). [DOI] [PubMed] [Google Scholar]
- 15.Buchan A & Moran MA Overview of the Marine Roseobacter Lineage †. 71, 5665–5677 (2005). [DOI] [PMC free article] [PubMed] [Google Scholar]
- 16.Benson BB & Krause D The concentration and isotopic fractionation of oxygen dissolved in freshwater and seawater in equilibrium with the atmosphere. Limnol. Oceanogr 29, 620–632 (1984). [Google Scholar]
- 17.Zan J et al. A complex LuxR-LuxI type quorum sensing network in a roseobacterial marine sponge symbiont activates flagellar motility and inhibits biofilm formation. Mol. Microbiol 85, 916–933 (2012). [DOI] [PMC free article] [PubMed] [Google Scholar]
- 18.Moller T et al. Hfq: A Bacterial Sm-like protein that mediates RNA-RNA interaction. Mol. Cell 9, 23–30 (2002). [DOI] [PubMed] [Google Scholar]
- 19.Lenz DH et al. The small RNA chaperone Hfq and multiple small RNAs control quorum sensing in Vibrio harveyi and Vibrio cholerae. Cell 118, 69–82 (2004). [DOI] [PubMed] [Google Scholar]
- 20.Zeng Q, Mcnally RR & Sundin GW Global small RNA chaperone Hfq and regulatory small RNAs are important virulence regulators in Erwinia amylovora. J. Bacteriol 195, 1706–1717 (2013). [DOI] [PMC free article] [PubMed] [Google Scholar]
- 21.Rempe KA, Hinz AK & Vadyvaloo V Hfq regulates biofilm gut blockage that facilitates flea-borne transmission of Yersinia pestis. J. Bacteriol 194, 2036–2040 (2012). [DOI] [PMC free article] [PubMed] [Google Scholar]
- 22.Geng H & Belas R Molecular mechanisms underlying roseobacter-phytoplankton symbioses. Curr. Opin. Biotechnol 21, 332–338 (2010). [DOI] [PubMed] [Google Scholar]
- 23.Rainey PB & Travisano M Adaptive radiation in a heterogeneous environment. Nature 394, 69–72 (1998). [DOI] [PubMed] [Google Scholar]
- 24.Spiers AJ, Kahn SG, Bohannon J, Travisano M & Rainey PB Adaptive divergence in experimental populations of Pseudomonas fluorescens. I. Genetic and phenotypic bases of wrinkly spreader fitness. Genetics 161, 33–46 (2002). [DOI] [PMC free article] [PubMed] [Google Scholar]
- 25.Hansen SK, Rainey PB, Haagensen JAJ & Molin S Evolution of species interactions in a biofilm community. Nature 445, 533–536 (2007). [DOI] [PubMed] [Google Scholar]
- 26.Moore L, Rocap G & Chisholm S Physiology and molecular phylogeny of coexisting Prochlorococcus ecotypes. Nature 576, 220–223 (1998). [DOI] [PubMed] [Google Scholar]
- 27.Shiah FK & Ducklow HW Temperature regulation of heterotrophic bacterioplankton production, and specific growth rate in Chesapeake Bay. Limnol. Oceanogr 39 (6), 1243–1258 (1994). [Google Scholar]
- 28.Bianchi D, Weber TS, Kiko R & Deutsch C Global niche of marine anaerobic metabolisms expanded by particle microenvironments. Nat. Geosci 11, 263–268 (2018). [Google Scholar]
- 29.Keeling RE, Körtzinger A & Gruber N Ocean deoxygenation in a warming world. Ann. Rev. Mar. Sci 2, 199–229 (2010). [DOI] [PubMed] [Google Scholar]
- 30.Miller TR & Belas R Dimethylsulfoniopropionate metabolism by Pfiesteria-Associated Roseobacter spp.†. Appl. Environ. Microbiol 70, 3383–3391 (2004). [DOI] [PMC free article] [PubMed] [Google Scholar]
- 31.Alavi M, Miller T, Erlandson K, Schneider R & Belas R Bacterial community associated with Pfesteria-like dinoflagellate cultures. Environ. Microbiol 3, 380–396 (2001). [DOI] [PubMed] [Google Scholar]
- 32.Lenski R & Bennett A Evolutionary response of Escherichia coli to thermal stress. Am. Nat (1993). [DOI] [PubMed] [Google Scholar]
- 33.Rodriguez-Verdugo A, Carrillo-Cisneros D, Gonzalez-Gonzalez A, Gaut BS & Bennett AF Different tradeoffs result from alternate genetic adaptations to a common environment. Proc. Natl. Acad. Sci 111, 12121–12126 (2014). [DOI] [PMC free article] [PubMed] [Google Scholar]
- 34.Lenski RE, Rose MR, Simpson SC & Tadler SC Long-term experimental evolution in Escherichia coli. I. Adaptation and divergence during 2,000 generations. The American Naturalist 138, 1315–1341 (1991). [Google Scholar]
- 35.Applebee MK, Herrgård MJ & Palsson BØ Impact of individual mutations on increased fitness in adaptively evolved strains of Escherichia coli. J. Bacteriol 190, 5087–5094 (2008). [DOI] [PMC free article] [PubMed] [Google Scholar]
- 36.O’Toole G a. Microtiter dish biofilm formation assay. J. Vis. Exp 3–5 (2011). [DOI] [PMC free article] [PubMed] [Google Scholar]
- 37.Somerville GA & Proctor RA Cultivation conditions and the diffusion of oxygen into culture media: The rationale for the flask-to-medium ratio in microbiology. BMC Microbiol. 13, 1 (2013). [DOI] [PMC free article] [PubMed] [Google Scholar]
- 38.Sharp JH Improved analysis for “particulate” organic carbon and nitrogen from seawater. Limnol. Ocean 19, 984–989 (1974). [Google Scholar]
- 39.Lomas MW et al. Sargasso Sea phosphorus biogeochemistry: an important role for dissolved organic phosphorus (DOP). Biogeosciences 7, 695–710 (2010). [Google Scholar]
- 40.Hunt M et al. REAPR: a universal tool for genome assembly evaluation. Genome Biol. 14, R47 (2013). [DOI] [PMC free article] [PubMed] [Google Scholar]
- 41.Aziz RK et al. The RAST Server: rapid annotations using subsystems technology. BMC Genomics 9, (2008). [DOI] [PMC free article] [PubMed] [Google Scholar]
- 42.Deatherage DE & Barrick JE Identification of mutations in laboratory-evolved microbes from next-generation sequencing data using breseq. Methods Mol. Biol 1151, 165–188 (2014). [DOI] [PMC free article] [PubMed] [Google Scholar]
- 43.Li L, Stoeckert CJJ & Roos DS OrthoMCL: Identification of ortholog groups for eukaryotic genomes. Genome Res. 13, 2178–2189 (2003). [DOI] [PMC free article] [PubMed] [Google Scholar]
- 44.R Development Core Team. R: A language and environment for statistical computing. R Foundation for Statistical Computing, Vienna, Austria. URL http://www.R-project.org/. R Foundation for Statistical Computing, Vienna, Austria: (2016). [Google Scholar]
- 45.Riahi K et al. RCP 8.5-A scenario of comparatively high greenhouse gas emissions. Clim. Change 109, 33–57 (2011). [Google Scholar]
- 46.Bates D, Mächler M, Bolker B & Walker S Fitting linear mixed-effects models using lme4. J. Stat. Softw 67, (2014). [Google Scholar]
- 47.Best DJ & Roberts DE Algorithm AS 89: The upper tail probabilities of Spearman’s rho. Appl. Stat 24, 377–379 (1975). [Google Scholar]
Associated Data
This section collects any data citations, data availability statements, or supplementary materials included in this article.
Supplementary Materials
Data Availability Statement
The data supporting the results of this study are available within the paper and its Supplementary Information and Supplementary Data Files. The assembled genome and sequences from clonal lines used in this study have been deposited in NCBI BioProject database under accession PRJNA386804, SAMN07134944: SAMN07134988 for the isolate sequences associated with Figures 3 and 4, and Supplementary Figure 18, SAMN09238774: SAMN09238795 for the population sequences associated with Supplementary Figures 12, 13, and 14, and SAMN07138891 for the genome assembly renamed RAK1035 to distinguish from RTM1035 and associated with Figures 3 and 4 and Supplementary Figures 12, 13, 14, 15, and 18.