

Abstract
Little is known about the genetic basis of behavioral choice, such as temperature preference, especially in natural populations. Thermal preference can play a key role in habitat selection, for example in aquatic species. Examining this behavior on a genetic level requires access to individuals or populations of the same species that display distinct temperature preferences. Caves provide a uniquely advantageous setting to tackle this problem, as animals colonizing caves encounter an environment that generally has a different, and far more stable, annual temperature than what is encountered on the outside. Here, we focus on cave and surface populations of Astyanax mexicanus, the Mexican tetra, and examine temperature preference and strength of temperature preference (reflected in the percent of time spent at the optimal temperature). We used a tank with a stable temperature gradient and automated tracking software to follow individual fish from each population. We found that distinct populations of A. mexicanus display differences in both temperature preference and strength of preference. Hybrid crosses established that these are multigenic traits that segregate independently from one another. Temperature preference in many aquatic animals is known to shift towards warmer temperatures following infection with parasites (akin to a fever response in humans). While surface fish infected by the ectoparasite Gyrodactylus turnbulli (a gill fluke) displayed a strong fever response, cavefish showed a significantly attenuated fever response. This work establishes A. mexicanus as a genetically tractable system in which differences in temperature preference can be studied in naturally evolved populations.
Keywords: Temperature preference, Behavioral fever, Cavefish, Habitat Selection, Astyanax mexicanus
Introduction
Animals display a wide variety of behavioral preferences, from the foods they prefer (Guarna and Borowsky, 1993) to the temperature at which they feel most comfortable (see below). However, the genetic underpinnings of such individual preferences have remained largely elusive, particularly in vertebrates. In a natural setting, behavior preferences can play a crucial role in an animal's fitness. For example, predilection for a particular environmental temperature is a behavioral preference of particular importance to ectothermal organisms; this has been well documented in aquatic animals, such as fish. Moreover, field studies making use of trawling and vertical gill nets (Ferguson, 1958; Coutant, 1977) or electric temperature telemetry (Coutant and Carroll, 1980) have shown that the location of fish swimming in natural, vertically stratified temperature gradients varies in a predictable manner with water temperature. Thus, temperature is a critical cue that fish may use to orient themselves, optimizing the opportunity to find favored food resources, minimizing predator-prey exposure, and partitioning the environment between species and often between life stages of the same species to minimize competition (Reynolds, 1977, Coutant, 1987). There have also been a number of studies demonstrating that the preferred temperature chosen by a species of fish will generally match the optimal temperature for that species to function physiologically, for example, optimizing growth rate (Brett, 1971; Coutant, 1975; Beitinger and Fitzpatrick, 1979; Magnuson et al., 1979; Beitinger and Mangnuson, 1979; Jobing, 1981; McCauley and Casselman, 1981). Presumably, once a particular temperature preference evolves in a species or population, there is a strong selective pressure to tune physiological parameters to that preference. Conversely, once physiology has been optimized to a particular temperature, one might expect that it would be maladaptive for fish to spend the majority of their time outside that temperature zone.
Temperature preference of fish has been assessed in lab settings, using tanks with stable thermal gradients (McCauley, 1977). Using variants of this set up, a broad range of fish have been assessed for temperature preference, from eels (Haro, 1991) to zebrafish (Key et al., 2015). In these studies, a distinction is generally made between acute preferences, temperatures chosen within 2 hours of being placed into the gradient, versus “final temperature preference”, the temperature chosen after the fish has re-acclimatized within the temperature gradient (Fry, 1947, Coutant, 1977). These two metrics differ because acute temperature preference can be affected by the temperature at which the fish are housed prior to being placed in the gradient. Interestingly, the final temperature preference of fish as measured in the laboratory is, in many cases, several degrees warmer than that observed for the same species in a natural setting (Reynolds 1977, Ferguson 1958); suggesting that the laboratory setting, controlled to measure response in temperature as the only variable, does not account for non-thermal stimuli that may act to modulate temperature preference behavior, such as light intensity, oxygen levels, competition, or social behavior.
Another factor that is known to have a major impact on temperature preference is whether a fish is fighting a pathogen. It is well known that some vertebrates will raise their body temperatures in response to an infection (Bicego et al., 2007). During such a fever response, warm-blooded animals will internally raise their body temperature to assist their immune response to fight bacteria, viruses, or parasites. Cold-blooded animals, such as fish, cannot do this, but they can raise their body temperatures by moving to warmer areas (Reynolds et al., 1976). Such a behavioral fever response to infection has been previously described in many fish species, including the bluegill and goldfish (Reynolds et al., 1978), Mozambique tilapia (Tsai et al., 2012), Nile tilapia (Cerqueira et al., 2016), rainbow trout (Grans et al., 2012), and zebrafish (Boltana et al., 2013). Fish exhibit behavioral fever responses to a range of pathogens, including parasites. For example, a fever response was observed in guppies when the fish were infected with the parasite Gyrodactylus turnbulli (a gill fluke) (Mohammed et al., 2016). This behavioral fever response leads to a higher survival rate (Covert and Reynolds, 1977; Elliot et al., 2002; Golovanov, 2006; Kruger, 1986).
Temperature preference exists because, in general, animals reside in complex environments where habitats are stratified and individuals can make thermal choices. But, what about settings where this is not the case? For instance, animals living in caves face an environment that is not only devoid of light and nutrient poor, but one that often has a relatively uniform and stable temperature as well (Protas and Jeffery, 2012). One such organism is the Mexican Tetra, Astyanax mexicanus, which lives in rivers and caves in central Mexico. There are populations of A. mexicanus in multiple different caves and in multiple different rivers in the region. The current cave populations evolved from two different stocks of river fish that, according to some estimates, invaded caves at least one million years ago (Gross, 2012). These fish are an excellent model organism for studying the adaption to an extreme environment. The fish are small, so they are easily maintained in a lab, they are easy to breed and produce large numbers of offspring, and the directionality of evolution is known (river to cave). Having access to multiple cave populations allows questions of convergent evolution to be explored. Perhaps most importantly, the ancestral river fish, referred to as the “surface” variant, and all the different cave populations can be interbred and produce fertile offspring (Wilkins, 1988). Here, we determine the temperature preferences of one of the river populations and of three of the cave populations (Tinaja, Molino, and Pachón) of A. mexicanus and carry out crosses between the populations to get an initial indication of the genetic architecture underlying this innate behavioral trait.
Methods
Care and Housing of the Fish
Fish (cave and surface populations of Astyanax mexicanus) were maintained under standard aquaculture conditions, IACUC approval #IS00001612. At the time temperature preference was assayed, fish were 16-24 months old and their standard length (length from tip of the snout to base of the caudal fin) ranged from 1.374 to 2.486 inches.
Temperature Gradient Chamber
A tank was constructed based on a design previously created to study temperature preferences in eels (Haro, 1991). The tank is 187.96 cm (L) by 74.93 cm (W) by 22.23 cm (H) (outer dimensions) and has ten different areas, each with thermometers placed at the inflow and outflow of each area to take the temperature. Having distinct areas is only for the purpose of temperature measurement and to assign locations to the fish; the inside of the tank is continuous (Supplementary Figure 1). The tank is supplied with warm water from a reservoir on one side, generated by four heaters (two Inkbird ITC-306T 750 watt digital temperature controllers (Amazon.com, Inc., USA) and two JBJ T3-1000 True-Temp 1,000 watt heaters (Amazon.com, Inc., USA)). On the other side, there is a reservoir with cold water generated by two 4.75 horsepower coolers (Aqualogic CY drop-in titanium helical coil chillers, Aqualogic, Inc., San Diego, one controlled with an Aqualogic TR115SN single-stage digital temperature controller, Aqualogic, Inc., San Diego, CA, the other with a Kegco KC TC-321 digital thermostat control unit, Amazon.com, Inc., USA) and a 0.5 horsepower cooler (Deep Blue Kryos Chiller, controlled by an internal thermostat Amazon.com, Inc., USA). There are 20 pumps lining the base of the tank that connect each area with the neighboring area and connect the heated and cooled reservoir to the main tank. This creates a stable gradient of around 37°C at the warm end (Area 1) and 13°C at the other end (Area 10). The average temperature of each area of the gradient is given in Supplemental Table 1.
Temperature Preference Assay
All of the fish used for this study were hatched and raised in the same temperature water (22°C-23°C) and were placed in the middle of the tank at the start of the trial. Each fish was tested individually, so schooling or other such behaviors did not affect the results. We observed that, after 30 minutes, the fish begin swimming in a circle in the areas with the temperatures they prefer. Thus, half an hour after the test starts, a camera positioned 1.5 m above the tank automatically begins recording. To ensure that all fish experience an identical environment, regardless of the fish's capacity for vision, and that visual cues do not affect the fish's preference, the room was kept dark and the fish were illuminated by infrared lights, positioned underneath the tank. In some experiments, the fish were tracked using EthoVision XT software, Version 11.5.1022 (Noldus Information Technology, Inc., Leesburg, VA), automatically calculating the time the fish spend in each area. In other experiments, temperature measurements were taken manually, from video images of the movement of the fish within the tank, but without the tracking software. This allowed an accurate assessment of an average temperature preference, but not of the percent of time spent at each temperature. In these experiments, after an hour of acclimation to the gradient, it was observed by eye which areas the fish were circling, using video taken using a camera so as not to disturb the fish with movement in the room. It was empirically determined that the temperature preference of individual fish could be definitively established after one minute of continuous observation, hence each temperature preference manually recorded was based on visual analysis over a 60 second trial. The area numbers where the fish were swimming and, in addition, the temperatures of all the areas were recorded at the time of each trial. Temperatures in each area were consistent (within one degree Celsius) between trials.
In total, we assessed the temperature preference of 12 surface fish, 17 Tinaja cavefish, 23 Pachón cavefish, 10 Molino cavefish, 5 Tinaja-surface F1 individuals, 5 Pachón -Tinaja F1 individuals, 99 Tinaja-surface F2 individuals, and 50 Pachón -Tinaja F2 individuals (see Figure Legends for details of fish used in each experiment). In addition we examined the temperature preference of 10 surface fish infected with the ectoparasite Gyrodactylus turnbulli, as well as 5 Tinaja cavefish infected with the same parasite.
For Statistical purposes, the data were analyzed based on percent time spent in each of the 10 “areas” that divided the tank. From this data, two parameters were determined. The mean location of the fish during the trial, reflecting the “temperature preference” of the fish, and the standard deviation of the time the fish spent in each area, providing a measure of the strength of temperature preference of that fish; the higher the standard deviation, the greater the inclination of the fish to be at its preferred temperature. To understand this, consider a fish that has no preference at all. It will spend 10% of its time in each of the ten areas. Percent time spent in each area is recorded as 10, 10, 10, 10, 10, 10, 10, 10, 10, 10, and the standard deviation of this data will be 0.0. At the other extreme, a fish that has an extremely strong preference and spend all its time in the area at that temperature will be recorded in a single area 100% of the time and 0% on the other 9 areas. In that case, the data will be recorded as 100, 0, 0, 0, 0, 0, 0, 0, 0, 0, and the standard deviation will be 31.62. The higher the standard deviation, the greater the strength of preference.
Water Temperature Measurements in the Caves and Rivers
Continuous measurement of the temperature in the caves was taken by HoboWare temperature probes (Onset Data Loggers, Bourne, MA) that were placed in multiple locations in the caves and recovered roughly a year after they were placed in the cave. Individual temperature measurements were recorded in rivers adjacent to the caves on three different occasions, in different locations (sun and shade), and at different depths (surface and three feet below the surface), see Supplementary Table 2 for details. These measurements were taken using handheld measurement system (YSI Professional Plus, YSI Inc., Yellow Springs, OH).
Parasite Analysis
The identity of the ectoparasite (Gyrodactylus turnbulli) was determined through an autopsy pathology study conducted on representative cavefish and surface fish by a commercial veterinary consultancy, the FishVet Group. Parasite load was monitored by performing a skin scrape and a gill clip on each fish being tested; the presence of parasites being assessed manually under the microscope. We observed that the parasite load in the system, in general, correlated well with the average load on individual fish. Thus, subsequent to clearing the parasite infection from our system, the main indicator used for the presence of parasites involved checking the detritus in each system, on a monthly basis.
Results and Discussion
By virtue of being subterranean, caves are insulated by many meters of rock (limestone in the case of the caves that house populations of A. mexicanus) and isolated from fluctuating climate changes. This would be predicted to result in much more stable water temperatures than are observed on the surface. To determine the extent to which this is true, we placed temperature recording devices in two caves in the Sierra de El Abra range of east-central Mexico and retrieved them more than a year later (Supplemental Figure 2). Two probes were placed in different locations within the Subterraneo cave. These gave essentially the identical results, showing less than 1°C fluctuation during the year when measurements were taken, ranging from a low of 23.2°C in March 2016 to a high of 24°C in November 2016. A similar result was seen in Jineo cave where temperatures were essentially constant at 22°C with the exception of four periods, each less than a week duration, when the cave water temperature transiently went up or down by 0.5°C-1°C, before rapidly equilibrating to the steady-state temperature. We additionally sampled four other caves manually (Supplementary Table 2). In the Pachón Cave, we recorded temperatures on three different dates, at two different depths, and in three distinct pools at successively deeper levels. All gave readings of 24.4°C +/- .3° C. The Molino and Japones caves were each tested on a single occasion, each at multiple locations, and displayed temperatures of 24.2°C and 23.9°C respectively. The Tinaja cave was tested on a single occasion and gave a reading of 23.0°C.
We also manually tested the temperature in the adjacent rivers (Supplementary Table 2). While far from a thorough environmental analysis, the readings were sufficient to conclude that the surface fish experience far more variable temperatures and also higher temperatures than those experienced by their conspecifics in the caves. For example, the readings in the Pachón Cave varied by only 0.6 °C, with a highest temperature of 24.7 °C, while those in the river Micos ranged by 2.8 °C, with a lowest reading of 26.9 °C (unpaired two-way students t-test, p=0.0002, t=7.2062).
The fact that cavefish and surface fish inhabit significantly different temperature environments raises the possibility that they may have evolved distinct temperature preference responses. To test this, we set up a tank in which we were able to produce a stable standing gradient in water temperature from 13°C to 37°C (well above and below the temperature extremes these fish would regularly encounter in the wild). For quantification purposes, the tank was also divided into 10 equally spaced virtual areas. As a control, we tested fish in the tank in the absence of a gradient using EthoVision tracking software (Supplemental Figure 3). In this experiment, the pumps were activated and the water was circulating, but the heaters and coolers were off, making every area the same temperature (20°C). The fish stayed in each of areas 2 - 9 for approximately the same amount, indicating that the fish have no inherent preference for any particular area. In addition, the fish from all populations spent more time in the end areas, but this is expected because the fish often swim around the edges of the tank, and the end areas present an additional side for the fish to follow.
To determine how long Astyanax fish need to acclimatize to the experimental tank, and how consistent the behavior of the fish is within the tank, we tested the response of individual fish to the temperature gradient. Prior studies suggest that fish initially placed into such a gradient respond based on the temperature to which they were previously acclimatized and only display their “final preferendum” after two hours or more in the new environment (Fry, 1997; Coutant, 1977). However, we found that, in the case of A. mexicanus, individuals attain a stable temperature preference after 30 minutes (e.g. Supplemental Figure 4). Moreover, the preferred temperature displayed by fish in this assay was significantly higher than the temperature at which the fish in the laboratory were raised from hatching, suggesting that they were not responding according to a prior acclimatized temperature. The preference curves that we generated from Astyanax mexicanus are similar to curves from previously tested fish species, with a peak optimal temperature and upper and lower temperature bounds, beyond which the fish seldom stray (Coutant, 1987). Perhaps most importantly, the temperature preference behavior of individual fish was virtually identical from hour to hour.
Based on these results, we established a paradigm where individual fish were placed into the gradient, allowed to acclimatize for half an hour, and then their movement was recorded and analyzed for the following hour. Temperature preference was assessed manually on a computer display or using automated tracking software (see methods). The two methods gave similar results (e.g. surface fish, Supplemental Figure 5). While there was some variation in temperature preference between individuals within each population (see below), there were significant differences between the populations (Figure 1). The surface fish and fish from the Tinaja and Molino caves had a similar average temperature preference (28.3°C) (Figure 1). However, the fish from the Pachón caves displayed a significantly cooler temperature preference (25.0°C, p=0.0019) (Figure 1). Moreover, the strength of the temperature preference was significantly greater for the surface fish than for any of their cave dwelling relatives. For example, the surface fish spent an average of 40.91% of their time in the area with their optimal temperature, while the Tinaja fish spent significantly less time, 24.70%, at their optimal temperature. The Molino fish were similar to the Tinaja fish in this regard, spending 22.80% of their time at their preferred temperature, while the Pachón fish were intermediate, spending 31.84% of the time at their optimal temperature. Intensity of temperature preference can also be quantified by calculating the standard deviation of the percent of time spent in each area (a high standard deviation reflecting a stronger temperature preference; see Methods for details). Again, the surface fish showed the strongest temperature preference, with the highest standard deviation (13.83), followed by the Pachón (11.61), Tinaja (9.29), and Molino cavefish (8.59) (Surface-Molino p=0.011).
Figure 1.
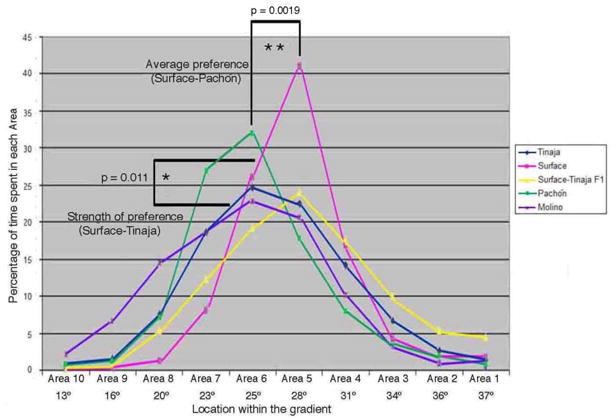
Differences in temperature preference between populations of Astyanax mexicanus. Fish were allowed to acclimatize to the gradient tank for 30 minutes and then their behavior was monitored for the following hour. Graphs of percent time spent in each area over the course of an hour, each graph representing the average distribution of fish from a specific population, including surface fish (n=4), Molino cavefish (n=10), Pachón cavefish (n=10), Tinaja cave fish (n=8), and surface-Tinaja F1 hybrids (n=5). Only representative fish tracked by automated software are included in these plots. For statistics on larger numbers of fish, including those assayed manually, see Figures 2 and 3. P value based on unpaired two-way students t-test. Average temperature preference comparing Pachon and Surface, t = 3.94 with a p value of 0.0019, Range of preference (standard deviation) comparing Tinaja and Surface: t = 3.11 with a p value of 0.0111. Fish populations are indicated by the different colored lines; Blue = Tinaja, Pink = surface, Yellow = Surface-Tinaja F1, Green = Pachón, and Purple = Molino.
To determine how the traits are inherited, we examined the temperature preference of hybrid surface-Tinaja F1 fish. Their average temperature preference was, as expected, the same as both the parental populations, as Tinaja and surface fish are similar in this regard. However, the strength of temperature preference for the F1 fish was similar to that of the Tinaja population (24.03% of their time at their optimal temperature, 8.14 standard deviation), suggesting that the diminished strength of temperature preference phenotype in Tinaja fish is dominant (Figure 1). Next, we examined 99 F2 fish from the surface-Tinaja cross. The F2 fish had the same average temperature preference as their P0 grandparents, but interestingly, we found that there was a wide range of temperature preferences among the surface-Tinaja F2 hybrids, with F2 fish that preferred far warmer or colder temperatures than their P0 grandparents (Figure 2A). This would not have been expected if the differences in temperature preference were attributed to a single locus. If the observed differences in temperature preference were controlled by a single gene, it would be most likely that the range of temperature preferences displayed by F2 fish would fall within the P0 range. Thus, the results support the model that temperature preference is multigenic. There was also a wide distribution among different F2 individuals in their strength of temperature preference (reflected in the standard deviation of the time spent at each temperature), showing that strength of temperature preference is also non-Mendelian (Figure 2B). We did not observe a correlation between temperature and strength of preference (standard deviation) (Figure 2C), indicating that these are independently segregating traits.
Figure 2.
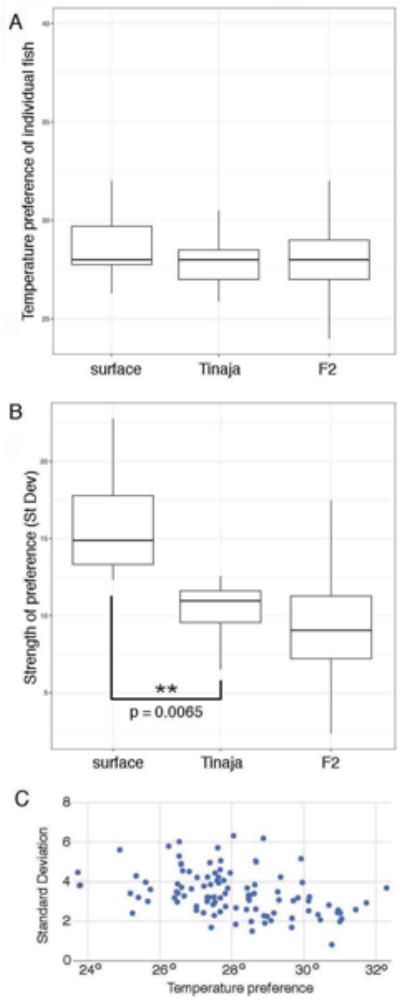
Temperature preference and strength of temperature preference are independent multigenic traits. (A) Variation in temperature preference between fish from the surface (n=12) and Tinaja cave (n=17) populations, and among Surface-Tinaja F2 individuals (n=99). The parental populations have the same average individual temperature preference, also shared by the F2 fish although there is a broader range of variation in the F2s. (B) Variation in strength of temperature preference, reflected in the standard deviation of the time spent in each area (higher standard deviation reflecting greater strength of preference) between fish from the surface and Tinaja cave populations, and among Surface-Tinaja F2 individuals. Surface fish have a stronger temperature preference than the Tinaja cavefish. The F2s show a range of strength of preference that is broader than either parental population. F-statistic for the ANOVA = 9.261 with a P-value of 0.000193. The comparison between Surface and Tinaja strength of preference (St Dev) is P value based on a TukeyHSD post-hoc for ANOVA test. Initial ANOVA P-value = 0.000193, F-statistic = 9.261 with a p-value of 0.0065. (C) Lack of correlation between temperature preference and strength of temperature preference among the surface-Tinaja F2 individuals. For box plots, median, 25th, and 75th percentiles are represented by horizontal bars and vertical bars represent 1.5 interquartile ranges.
Pachón and Tinaja cavefish have significantly different temperature preferences (25.0°C for Pachón and 28.3°C for Tinaja) (Figure 3), even though their respective caves have similar temperatures (24.5°C for Pachón, 23.0°C for Tinaja) (Supplemental Table 2). Pachón/Tinaja F1 hybrids have an average temperature preference of 27.7°C (Figure 3), intermediate between the two parental populations and not significantly different from either, suggesting that the temperature preferences may be codominant. We then examined 50 Pachón/Tinaja F2 hybrids and found that, similar to what we observed in surface/Tinaja hybrids, there is a broader range of temperature preferences among individual fish than seen in either parental population, supporting the hypothesis that temperature preference in is a multigenic trait (Figure 3).
Figure 3.
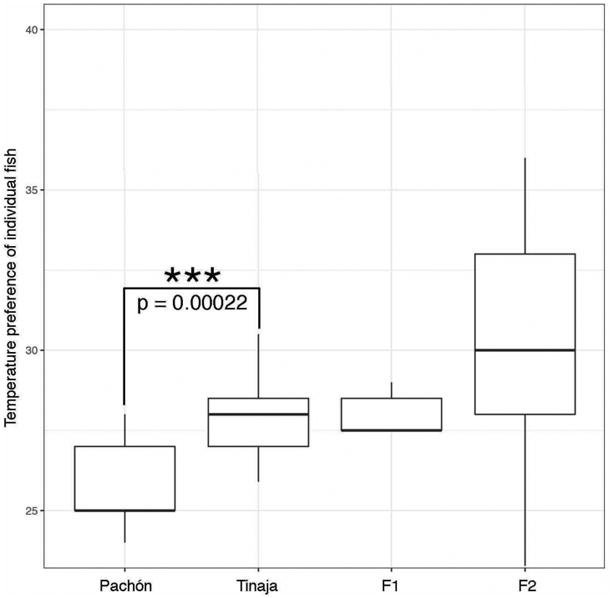
Pachón and Tinaja cavefish have distinct temperature preferences. Individual variation in temperature preference between fish from the Pachón cave (n=23), Tinaja cave (n=17), Pachón-Tinaja F1 hybrids (n=5), and Pachón-Tinaja F2 individuals (n=50). Fish from the Pachón population prefer cooler temperatures than fish from the Tinaja population. The average F2 fish prefer warmer temperatures, like their Tinaja grandparents, however the range of temperature preferences for the F2 fish is greater than observed for either parental population. P value based on TukeyHSD post-hoc for ANOVA p-value = 0.00022, t = -4.1579 based on Welch Two Sample t-test (two-tailed). For box plots, median, 25th, and 75th percentiles are represented by horizontal bars and vertical bars represent 1.5 interquartile ranges.
A. mexicanus surface fish display a distinct temperature preference, presumably to optimize their behavior and physiology in a complex ecological environment. The temperature they favor is within the range of the warmest temperatures we recorded in the rivers (river readings ranging from 25.0-29.3 °C), suggesting these fish may swim up the temperature gradient in their natural environment.
Potentially as long ago as one million years ago, discrete populations of A. mexicanus were trapped in caves, a unique environment that, among other things, is of uniform and constant temperature, not giving these fish opportunity to make behavioral temperature choices. After approximately a million years of relaxed selection for temperature preference, some of the cave populations (e.g. Tinaja) show a decrease in the strength of their temperature preference, while, in one cave (Pachón), the preference itself has shifted to a cooler temperature, consistent with the cooler cave environment. The fact that temperature preference has not been lost in any of the cave populations, in spite of an absence of an obvious need for such a preference in a constant and uniform temperature environment, suggests that an optimal temperature comfort range may be a fundamental trait.
Temperature preference also manifests itself in the context of behavioral fever responses to microbiological and parasitic infections. We tested temperature preference in fish that were infected with the gill fluke Gyrodactylus turnbulli, a pathogen previously shown to cause a behavioral fever in other fish (Mohammed et al., 2016). We examined the temperature preference of surface fish and Tinaja cavefish that carried equivalent loads of the parasite (up to 4-5 flukes per skin scrape or gill clip), and found that both populations exhibited a parasite fever response (Figure 4). Interestingly, however, the response was significantly diminished in the Tinaja fish. While the Tinaja and surface fish ultimately spent approximately the same amount of time in the warmer half of the gradient, at temperatures well above their normal temperature preference, the surface fish spent >30% of their time in the warmest possible area at the extreme end of the tank, while the Tinaja cavefish only spent approximately 20% of their time at the extreme end and more of their time circling between 31°C and 37°C (Figure 4). Infected Molino and Pachón fish appeared to be similar to the Tinaja fish, with an apparent diminished behavioral fever response. However, they were not assessed in detail. The attenuation of the behavioral fever response in, at least, the Tinaja cave population is consistent with the fact that, for over a million years, fish in the caves would have had no warmer place to go when infected, even if they had the instinct to do so. In addition, the strength of the fever response may have been diminished over time because the fish in the caves are exposed to less parasitic infections. While ectoparasites such as G. turnbulli, have not been specifically assessed, a recent analysis of endoparasites in A. mexicanus from the Pachón, Tinaja, and multiple other caves showed a greatly diminished parasitic load compared to conspecifics in the adjoining Tambaca river (Santa Cruz Vazquez, 2013). For example, fish sampled from the Tinaja cave had 0-11 parasites, with an average of 4, while the river fish ranged from 0-161, with an average of 34. Alternatively, the diminished fever response we observed could be a secondary consequence of the general decrease in strength of temperature preference in the Tinaja population.
Figure 4.
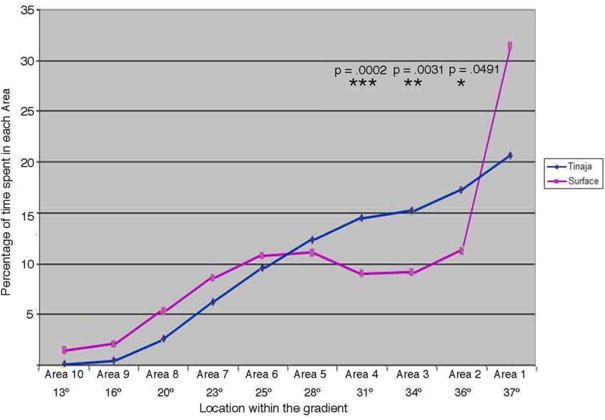
Cavefish show an attenuated behavioral fever response when infected with the ectoparasite G. turnbulli. Average time spent in each area by infected surface (n=10) and Tinaja (n=5), fish carrying approximately the same parasitic load. Time spent at each temperature was determined using Ethovision tracking software. P values based on unpaired two-way students t-test for the percent time in each area comparing infected surface fish and infected Tinaja cavefish: in Area 2, p = 0.0491, t = 2.170; in Area 3, p = 0.0031, t = 3.623; in Area 4, p = 0.0002, t = 5.148. Fish populations are indicated by the different colored lines; Blue = Tinaja, Pink = surface.
We found that various cave populations of A. mexicanus prefer lower temperatures, have diminished preference for specific temperatures, and a weaker behavioral fever response. Other multigenic behavioral traits have been mapped genetically in A. mexicanus, including loss of schooling behavior (Kowalko et al., 2013a) and changes in feeding posture (Kowalko et al., 2013b). A similar approach to these previous studies, utilizing qualitative trait locus (QTL) analyses, can, in principle, be employed to study the traits described here. Such future experiments will give further insight into the genetic substrate of the fascinating phenomenon of innate temperature preference.
Supplementary Material
Figure S1. Temperature gradient tank. A) top view. B, C) side views. The continuous, uninterrupted swimming chamber in the middle is flanked by interconnected areas where the temperature is monitored and water is pumped in and out. Area numbers are as marked. Direction of water flow is indicated by red arrows. Location of heaters and coolers are as indicated.
Figure S2. The caves inhabited by A. mexicanus are characterized by relatively constant temperature. Continuously recording temperature probes were placed into caves and were retrieved a year later. Start and end dates of temperature recordings in the caves are indicated by red arrows. Prior and after those dates, the erratic tracing reflects the recording track of the temperature of the probe during transport to and from the location of the caves.
Figure S3. Fish show no preference for any particular location within the temperature gradient tank under constant temperature. Surface fish (n=3), Tinaja cavefish (n=5) and Pachón cavefish (n=7) were tested in water that was 20°C throughout the tank. The only preference noted was a general tendency to swim along the sides of the chamber. Time spent in each area was determined using automated tracking software. Fish populations are indicated by the different colored lines; Blue = Pachón, Red = Tinaja, and Yellow = surface.
Figure S4. Fish show consistent temperature preference after acclimatizing to the experimental tank for 30 minutes. Example of a single Molino cavefish, showing time spent in each area over the course of four consecutive hours. Time spent in each area was determined using automated tracking software. Blue line = first hour of observation, Red line = second hour of observation, Yellow line = third hour of observation, Light Blue line = fourth hour of observation.
Figure S5. Comparison of temperature preference displayed by surface fish (12 total), as determined manually (n=8) and by automated tracking software (n=4). P value based on unpaired two-way students t-test. For box plots, median, 25th, and 75th percentiles are represented by horizontal bars and vertical bars represent 1.5 interquartile ranges.
Table S1. Average temperature of each area during the temperature preference trials. Temperatures are all +/- 0.5 degrees.
Table S2. Temperature readings taken in various caves and rivers in the Sierra de El Abra range in Mexico.
Highlights.
Cavefish and surface fish populations display different innate temperature preferences as well as different strengths of temperature preference
Temperature preference and strength of preference are independently segregating traits
Relative to surface fish, Cavefish have a diminished behavioral fever response to parasitic infections
Acknowledgments
We are particularly grateful to Alex Haro and the U.S. Geological Survey S.O. Conte Anadromous Fish Research Laboratory for designing and building the assay tank. We thank Megan Peavey and Kefira Allen Tabin for making sure the tank was always running and for helping the project recover after numerous equipment failures. We are grateful to Dr. Paty Garcia and Dr. Luis Espinasa and his students for assisting in placing and retrieving temperature probes and for taking temperature measurements in the caves and river. We appreciated the advice provided by Dr. Hopi Hoekstra. This work was supported by a grant from the NIH, HD 089934, to C.J.T.
Footnotes
Publisher's Disclaimer: This is a PDF file of an unedited manuscript that has been accepted for publication. As a service to our customers we are providing this early version of the manuscript. The manuscript will undergo copyediting, typesetting, and review of the resulting proof before it is published in its final citable form. Please note that during the production process errors may be discovered which could affect the content, and all legal disclaimers that apply to the journal pertain.
References
- Beitinger TL, Magnuson JJ. Growth Rates and temperature selection of bluegill, Lepomis macrochirus. Trans Amer Fish Soc. 1979;108:378–382. [Google Scholar]
- Beitinger TL, Fitzpatrick LC. Physiological and ecological correlates of preferred temperature. Amer Zool. 1979;19:319–329. [Google Scholar]
- Bicego KC, Barros RCH, Branco LGS. Physiology of temperature regulation: comparative aspects. Comp Biochem Physiol, Part A, Mol Integr Physiol. 2007;147:616–639. doi: 10.1016/j.cbpa.2006.06.032. [DOI] [PubMed] [Google Scholar]
- Boltaña S, Rey S, Roher N, Vargas R, Huerta M, Huntingford FA, Goetz FW, Moore J, Garcia-Valtanen P, Estepa A, Mackenzie S. Behavioural fever is a synergic signal amplifying the innate immune response. Proc R Soc B Biol Sci. 2013;280:20131381. doi: 10.1098/rspb.2013.1381. [DOI] [PMC free article] [PubMed] [Google Scholar]
- Brett JR. Energetic responses of salmon to temperature. A study of some thermal relations in the physiology and freshwater ecology of sockeye salmon (Oncorhynchus nerka_ Amer Zool. 1971;11:99–113. [Google Scholar]
- Coutant CC. Environmental Effects of Cooling systems at Nuclear Power plants. International Atomic Energy agency; Vienna: 1975. Temperature selection by fish- a factor in power plant impact assessments; pp. 575–597. [Google Scholar]
- Coutant CC, Carroll DS. Temperatures occupied by ten ultrasonic- tagged striped bass in freshwater lakes. Trans Amer Fish Soc. 1980;109:195–202. [Google Scholar]
- Coutant CC. Compilation of temperature preference data. J Fish Res Board Can. 1977;34:739–745. [Google Scholar]
- Coutant CC. Thermal preference: when does an asset become a liability? Environ Biol Fish. 1987;18:161–172. [Google Scholar]
- Covert JB, Reynolds WW. Survival value of fever in fish. Nature. 1977;267:43–45. doi: 10.1038/267043a0. [DOI] [PubMed] [Google Scholar]
- Elliot SL, Blanford S, Thomas MB. Host- Pathogen interactions in a varying environment: temperature, behavioural fever and fitness. Proc Biol Sci/ R Soc. 2002;269:1599–1607. doi: 10.1098/rspb.2002.2067. [DOI] [PMC free article] [PubMed] [Google Scholar]
- Ferguson RG. The preferred temperature of fish and their mid-summer distribution in temperate lakes and streams. J Fish Res Board Can. 1958;15:607–624. [Google Scholar]
- Fry FEJ. Effects of the environment on animal activity. Publ Ont Fish Res Lab. 1947;68:1–62. [Google Scholar]
- Golovanov VK. The ecological and evolutionary aspects of thermoregulation behavior on fish. J Ichthyol. 2006;46:S180–S187. [Google Scholar]
- Gräns A, Rosengren M, Niklasson L, Axelsson M. Behavioural fever boosts the inflammatory response in rainbow trout Oncorhynchus mykiss. Journal of Fish Biology. 2012;81:1111–1117. doi: 10.1111/j.1095-8649.2012.03333.x. [DOI] [PubMed] [Google Scholar]
- Guarna MM, Borowsky RL. Genetically controlled food preference: Biochemical mechanisms. Proc Natl Acad Sci USA. 1993;90:5257–5261. doi: 10.1073/pnas.90.11.5257. [DOI] [PMC free article] [PubMed] [Google Scholar]
- Haro Alexander J. Thermal preference behavior of Atlantic eels (genus Ariguilla) in relation to their spawning migration. Environmental Biology of fishes. 1991;31:171–184. [Google Scholar]
- Jobling M. Temperature tolerance and the final preferendum—rapid methods for the assessment of optimum growth temperatures. Journal of Fish Biology. 1981;19:439–455. [Google Scholar]
- Kluger MJ. Is fever beneficial? Acta Physiol Scand. 1986;59:89–95. [PMC free article] [PubMed] [Google Scholar]
- Kowalko JE, Rohner N, Linden TA, Rompani SB, Warren WC, Borowsky R, Tabin CJ, Jeffery WR, Yoshizawa M. Convergence in feeding posture occurs though different genetic loci in independently evolved cave populations in Astyanax mexicanus. Proc Natl Acad Sci USA. 2013 Oct 15;110(42):16933–8. doi: 10.1073/pnas.1317192110. [DOI] [PMC free article] [PubMed] [Google Scholar]
- Kowalko JE, Rohner N, Rompani SB, Peterson BK, Linden TA, Yoshizawa M, Kay EH, Weber J, Hoekstra HE, Jeffery WR, Borowsky R, Tabin CJ. Loss of schooling behavior in cavefish through sight-dependent and sight independent mechanisms. Curr Biol. 2013 Oct 7;23(19):1874–83. doi: 10.1016/j.cub.2013.07.056. [DOI] [PMC free article] [PubMed] [Google Scholar]
- Magnuson J, Crowder L, Medvick Patricia A. Temperature as an Ecological Resource. American Zoologist. 1979;19(1):331–343. [Google Scholar]
- Cerqueira Marco, Rey Sonia, Silva Tome, Featherstone Zoe, Crumlish Margaret, MacKenzie Simon. Thermal preference predicts animal personality in Nile tilapia Oreochromis niloticus. J Anim Ecol. 2016 Sep;85(5):1389–1400. doi: 10.1111/1365-2656.12555. [DOI] [PubMed] [Google Scholar]
- McCauley RW, Casselman JW. Proc World Symp On Aquaculture in Heated Effluents and Recirculation systems, European Inland fisheries Advisory Comm. Berlin: 1981. The final preferendum as an index of the temperature for optimum growth in fish; pp. 81–93. [Google Scholar]
- McCauley RW. Laboratory Methods for determining temperature preference. J Fish Res Board Can. 1977;34:749–752. [Google Scholar]
- Mohammed RS, Reynolds M, James J, Williams C, Mohammed A, Ramsubhag A, van Oosterhout C, Cable J. Getting into hot water: sick guppies frequent warmer thermal conditions. Oecologia. 2016 doi: 10.1007/s00442-016-3598-1. [DOI] [PMC free article] [PubMed] [Google Scholar]
- Protas M, Jeffery WR. Evolution and development in cave animals: from fish to crustaceans. Wiley Interdiscip Rev Dev Biol. 2012;1(6):823–45. doi: 10.1002/wdev.61. [DOI] [PMC free article] [PubMed] [Google Scholar]
- Renyolds WW, Casterlin ME, Covert JB. Febrile responses of bluegill (Lepomis machrochirus) to bacterial pryogens. J Therm Biol. 1978;3:129–130. [Google Scholar]
- Rey S, Digka N, Mackenzie S. 2015. Animal personality Relates to thermal preference in Wild- type Zebra fish. Danio rerio Zebrafish. 2015 Jun;12(3):243–9. doi: 10.1089/zeb.2014.1076. [DOI] [PubMed] [Google Scholar]
- Reynolds WW. Temperature as a proximate factor in orientation behavior. J Fish Res Board Cand. 1977;34:734–739. [Google Scholar]
- Reynolds WW, Casterlin ME, Covert JB. Behavioural fever in teleost fishes. Nature. 1976;259:41–42. doi: 10.1038/259041a0. [DOI] [PubMed] [Google Scholar]
- Cruz Santa, Vazquez AO. Analisis de las comunidades de peces y parasitos en la Cuenca del panuco. Universidad Autonoma de Queretaro; Queretaro: 2013. [Google Scholar]
- Tsai CL, Hoh KH. Short note. Photographies. 2012;5:247–247. [Google Scholar]
- Wilkens H. Evolution and Genetics of Epigean and Cave Astyanax fasciatus (Characidae, Pisces) In: Hecht MK, Wallace B, editors. Evolutionary Biology Evolutionary Biology. Vol. 23 1988. [Google Scholar]
Associated Data
This section collects any data citations, data availability statements, or supplementary materials included in this article.
Supplementary Materials
Figure S1. Temperature gradient tank. A) top view. B, C) side views. The continuous, uninterrupted swimming chamber in the middle is flanked by interconnected areas where the temperature is monitored and water is pumped in and out. Area numbers are as marked. Direction of water flow is indicated by red arrows. Location of heaters and coolers are as indicated.
Figure S2. The caves inhabited by A. mexicanus are characterized by relatively constant temperature. Continuously recording temperature probes were placed into caves and were retrieved a year later. Start and end dates of temperature recordings in the caves are indicated by red arrows. Prior and after those dates, the erratic tracing reflects the recording track of the temperature of the probe during transport to and from the location of the caves.
Figure S3. Fish show no preference for any particular location within the temperature gradient tank under constant temperature. Surface fish (n=3), Tinaja cavefish (n=5) and Pachón cavefish (n=7) were tested in water that was 20°C throughout the tank. The only preference noted was a general tendency to swim along the sides of the chamber. Time spent in each area was determined using automated tracking software. Fish populations are indicated by the different colored lines; Blue = Pachón, Red = Tinaja, and Yellow = surface.
Figure S4. Fish show consistent temperature preference after acclimatizing to the experimental tank for 30 minutes. Example of a single Molino cavefish, showing time spent in each area over the course of four consecutive hours. Time spent in each area was determined using automated tracking software. Blue line = first hour of observation, Red line = second hour of observation, Yellow line = third hour of observation, Light Blue line = fourth hour of observation.
Figure S5. Comparison of temperature preference displayed by surface fish (12 total), as determined manually (n=8) and by automated tracking software (n=4). P value based on unpaired two-way students t-test. For box plots, median, 25th, and 75th percentiles are represented by horizontal bars and vertical bars represent 1.5 interquartile ranges.
Table S1. Average temperature of each area during the temperature preference trials. Temperatures are all +/- 0.5 degrees.
Table S2. Temperature readings taken in various caves and rivers in the Sierra de El Abra range in Mexico.