

Abstract
Major neuropsychiatric disorders such as psychosis are increasingly acknowledged to be disorders of brain connectivity. Yet, tools to map, model, predict, and change connectivity are difficult to develop, largely due to the complex, dynamic, and multivariate nature of interactions between brain regions. Network neuroscience provides a theoretical framework and mathematical toolset to address these difficulties. Building on areas of mathematics such as graph theory, network neuroscience in its simplest form summarizes neuroimaging data by treating brain regions as nodes in a graph, and by treating interactions or connections between nodes as edges in the graph. Network metrics can then be used to quantitatively describe the architecture of the graph, which in turn reflects the network’s function. Here we review evidence supporting the utility of network neuroscience in understanding psychiatric disorders, with a particular focus on normative brain network development and abnormalities associated with psychosis. We also emphasize relevant methodological challenges such as motion artifact correction, which are particularly important to consider when applying network tools to developmental neuroimaging data. We close with a discussion of several emerging frontiers of network neuroscience in psychiatry, including generative network modeling and network control theory. We aim to offer an accessible introduction to this emerging field, and motivate further work that uses network neuroscience to better understand the normative development of brain networks, and alterations in that development that accompany or foreshadow psychiatric disease.
Keywords: network, MRI, development, adolescence, psychosis, connectivity
INTRODUCTION
The human brain is a complex organ whose function still defies explanation. Among the myriad genetic, molecular, cellular and anatomical drivers of this complexity, a key component that has recently received increasing attention is the elaborate and heterogeneous pattern of connectivity between large-scale brain regions (1, 2). Complementing our understanding of regional function from lesion and brain-mapping studies, this pattern of connectivity between regions is thought to provide critical information about how information is processed, transmitted, and transformed in the service of cognition (3, 4). Our understanding of brain connectivity has been facilitated by recent advances in mathematics, physics, computer science, statistics, and engineering, which have culminated in the formalization of an interdisciplinary field of inquiry referred to as network science (5). Intuitively, a network is a simplified representation of a system in terms of its components and a pattern of connections between them. Network science offers a mathematical language in which to quantitatively characterize such interconnected architecture, model the impact of network structure on observed function, and predict the nature, growth, and dynamics of such systems. As applied to the brain, the emerging discipline of network neuroscience encompasses the invention, application, and extension of network-based tools to address pressing questions related to the structure, function, and development of the brain (6).
The purview of network neuroscience extends to molecular and cellular biology, spans across species, and bridges data science and clinical translation. Yet, despite this broad applicability, one of its most well-developed contributions has stemmed from studies of large-scale brain networks measured using noninvasive human neuroimaging techniques (7). Here, one studies the connectivity between large-scale brain areas, with volumes on the order of several centimeters cubed. Such areas can be connected by white matter tracts (structural connectivity) (8) or by statistical similarities in activity time series (functional connectivity) (9).
In addition to offering insights into general principles of brain network architecture across the population (10), this approach also allows a quantification of individual differences, including brain development. Developmental associations with brain network structure and function provide a unique opportunity to understand both normal brain development and also how abnormal brain development is associated with major neuropsychiatric syndromes such as psychosis. This potential is underscored by the increasing recognition that disorders such as psychosis are fundamentally disorders of connectivity (11–13), with changes in network properties evident in youth who either have the disease, or are at elevated clinical or genetic risk. Critically, network markers may provide intermediate phenotypes for psychiatric disease, provide features for early diagnosis, and inform interventions to “bend the curve” of brain development during the plastic period of childhood and adolescence (14).
In this review, we offer a broad overview of the utility of network neuroscience in understanding normal network development and developmental network abnormalities associated with psychosis. We begin with a primer on network neuroscience methods, and then move onto a brief discussion of applications of network neuroscience techniques to questions posed by the study of normative development, before addressing the extension of these applications to abnormal development and its relevance for psychosis. Additionally, we provide a thorough discussion of the most pressing methodological challenges in applying network tools to neuroimaging data, including the pervasive impact of motion artifact on estimated connections. We will close with a description of emerging frontiers in applying new network methods to developmental psychiatry.
PRIMER ON NETWORK NEUROSCIENCE
Here we provide a brief primer on network neuroscience, beginning with its theoretical foundations and computational toolkit, before moving on to its relevance for developmental psychiatry (Figure 1). The two canonical roots of network science are graph theory, a field of mathematics that offers a formal way in which to represent interconnected systems (15), and statistical mechanics, a field of physics that offers methods to infer how collective dynamics can emerge from ensembles of many interacting parts (16). In its simplest instantiation, network science represents a system in terms of a graph, where quintessential elements of the system are represented as nodes, and where relations or interactions between elements are represented as edges (5). When edges take on weights of either 0 or 1, the graph is said to be a binary graph; when edges take on non-binary weights, the graph is said to be a weighted graph. Graphs are called signed graphs if their edges can be either positive or negative, and they are called directed graphs if the edge from node i to node j need not have the same weight as the edge from node j to node i. Although not yet commonplace in network neuroscience, other network representations are being developed in the mathematics community that have shown initial promise in probing brain function (17, 18). Examples include temporal graphs containing time-varying edges, multilayer graphs containing distinct layers that can each code for a different edge type, annotated graphs containing quantitative features assigned to nodes, and simplicial complexes accounting for non-dyadic interactions.
Figure 1: A brief network primer.
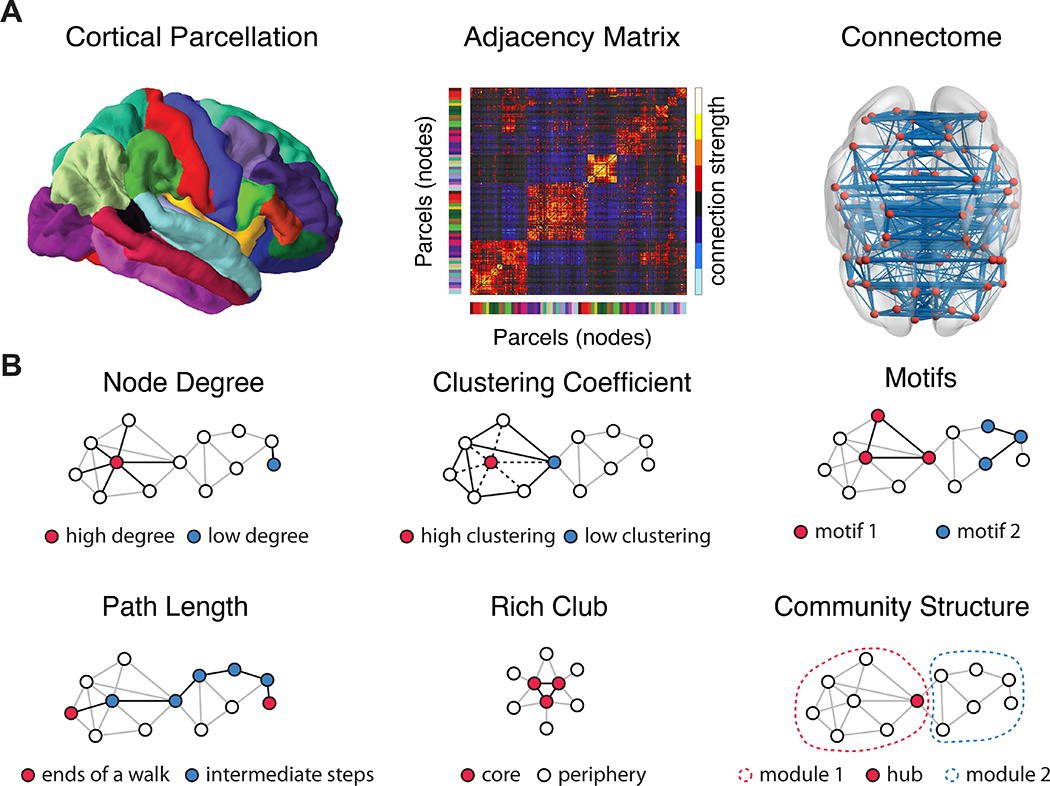
a, The process of building a brain network begins with a parcellation of imaging voxels into regions of interest. Next, connections between those regions (estimated via functional connectivity, white matter tractography, or cross-subject covariance in morphometric variables) are summarized in an adjacency matrix, which in turn can be represented by a network or graph. b, A simple schematic of a few common graph metrics used to characterize human brain networks. First, node degree is given by the number of edges a node has. The clustering coefficient of a node in a binary graph can be defined as the number of triangles containing that node, divided by the number of connected triples containing that node. Motifs are subgraphs with a fixed pattern of connectivity: a triangle is an example of a motif, and a connected triple is another example of a motif. The shortest path length between two nodes is given by the smallest number of edges that must be traversed to get from one to the other. Core-periphery structure in a network is present when high degree nodes are also densely connected with one another (sometimes called a “rich club”), and when a periphery of low degree nodes preferentially connects to the core. Community structure in a network is present when the graph can be decomposed into modules, where nodes in one module are densely connected to one another but sparsely connected to nodes in other modules. Panel (b) is inspired by (137).
In brain networks, nodes are usually chosen to be large-scale areas defined by cytoarchitecture, anatomical boundaries, functional responses, or a combination of multiple features (19). Parcellations of the brain into network nodes typically segregate cortical and subcortical areas into between 100 and 1000 regions of interest. It is also possible to construct more fine-grained graphs in which individual voxels constitute network nodes, although analysis of such networks can be computationally demanding. Irrespective of the spatial resolution at which nodes are defined, edges connecting nodes are commonly chosen to reflect estimates of structural connectivity (e.g., white matter tracts) (8), functional connectivity (statistical similarities in time series such as a correlation or coherence) (9), or morphometric similarity (across-subject correlation in, for example, cortical thickness, gray matter volume, or surface area) (20–22). Such graphs representing inter-regional connectivity are the standard in the field, although recent efforts have also demonstrated the utility of other representations. For example, so-called time-by-time graphs represent inter-time similarities in brain state (23), defined as a pattern of activation across all regions, and can be useful in assessing brain state variability both at rest and during the performance of cognitively demanding tasks (24).
As the reader likely appreciates at this point, there are many types of brain networks that one can construct from neuroimaging data. Despite this variability, several architectural features are consistently observed across structural and functional brain networks, and across various spatial scales at which nodes can be delineated. Perhaps the earliest feature to have been observed - and the most broadly-validated - is that of small-worldness, in which the nodes to which a region is connected also tend to connect to one another (leading to high clustering) and in which a few long-distance connections exist (leading to a short average path-length, or the mean number of connections that must be traversed to get between a given pair of nodes) (25–28). Small-world architecture is often accompanied by a heavy-tailed degree distribution, where most nodes have few connections (low degree) and a few nodes have many connections (high degree); when the degree distribution is well-fit by a power-law, the network is sometimes referred to as scale-free. Importantly, small-worldness is thought to support a balance between the local processing of information and the global transmission of information. Such a balance between segregation and integration is also supported by the architectural principles of modularity and core-periphery structure (29, 30). Intuitively, a module is defined as a set of brain regions that are more densely (and strongly) interconnected with other regions in the same module than expected in a random network null model. The segregation enabled by modularity is complemented by the integration enabled by core-periphery structure, where a set of densely interconnected hubs (often called a “rich-club”) extend pervasive connections to the remaining areas of the brain (31). Notably, this topological richness is maintained in a physically embedded system that also displays relatively minimal anatomical connection lengths, suggesting pervasive evolutionary, developmental, energetic, and/or metabolic constraints on wiring (10, 32).
STUDIES OF NORMAL BRAIN DEVELOPMENT
An adequate description of normative brain network development is a prerequisite for any account of how abnormal development of brain networks might be associated with psychopathology. While an increasing array of network statistics have now been examined in studies of brain development, there is particularly convergent data supporting the evolution of two specific properties of brain networks: core-periphery structure and network modularity. Here, we review the extant literature on how these topological features evolve in youth.
While multiple methods to quantify core-periphery structure are available (33), in network neuroscience the most common has been the “rich club” approach (34). A rich club is a set of densely interconnected hubs that also connect to the remaining (peripheral) nodes in the network. These hubs tend to extend disproportionally high-cost, long-distance connections, which are critical for efficient information flow across the network. Prior work has shown evidence for rich club topology in the human brain using both structural and functional networks estimated from non-invasive imaging (31, 35, 36). Notably, this topology is present very early in life, and can be identified in human infants (37). Rich club organization is not unique to human brain networks, and is also observed in the neural networks of species as diverse as C. elegans (38), cats (39), and macaques (40). Rich club regions have been shown to have elevated coupling of expression of genes involved in oxidative metabolism, emphasizing their importance for the brain’s energy consumption (41). Critically, rich club architecture is not static, but evolves with age in youth. Indeed, no fewer than seven independent studies have shown that the core-periphery architecture measured by the rich club consolidates and strengthens over childhood, adolescence, and young adulthood in humans (40, 42–47).
In addition to such development of core-periphery structure, there is ample evidence that network modularity is a critical property of brain networks that is refined during youth (48). Like many other types of networks, brain networks have been shown to have a clear modular structure, being made up of groups of nodes that are strongly connected to each other and more weakly connected to other modules (49). Several network measures have been typically used, including modularity quality, which describes how modular the overall network is (48). Similarly, the participation coefficient quantifies the degree to which a specific node (or set of nodes) has connections to multiple communities (50). The spatial distribution of brain network modules derived from human imaging data shows remarkable consistency across methods (51–53), and aligns with data from animal models (54), lesion studies (55), and task-based fMRI studies.
During childhood and adolescence, modules become more distinct: connectivity within modules increases while connectivity between modules declines (Figure 2a). In a classic series of studies, Fair et al. initially described how the cognitive control system evolved into adult structure through segregation of fronto-parietal and cingulo-opercular elements (56); a follow-up study documented that a similar process occurs in the default mode network (57). Convergent results have subsequently been provided by independent efforts (58, 59). Notably, studies that initially appear to provide discrepant results can be easily reconciled by noting differences in network edge definition (60): when anti-correlated timeseries in the default mode are considered functionally connected via use of a positively-signed edge measure such as coherence, increased between-module connectivity can be detected due to an enhancement of that anti-correlation. (In networks constructed from a signed edge measure such as a Pearson correlation coefficient, the effect of increased anti-correlation in time series is to enhance segregation between networks.) Complementing this data on functional networks, a large recent study by Baum et al. (61) using diffusion imaging similarly demonstrated increasing modularity within structural brain networks (Figure 2b).
Figure 2. Modular segregation during adolescent development.
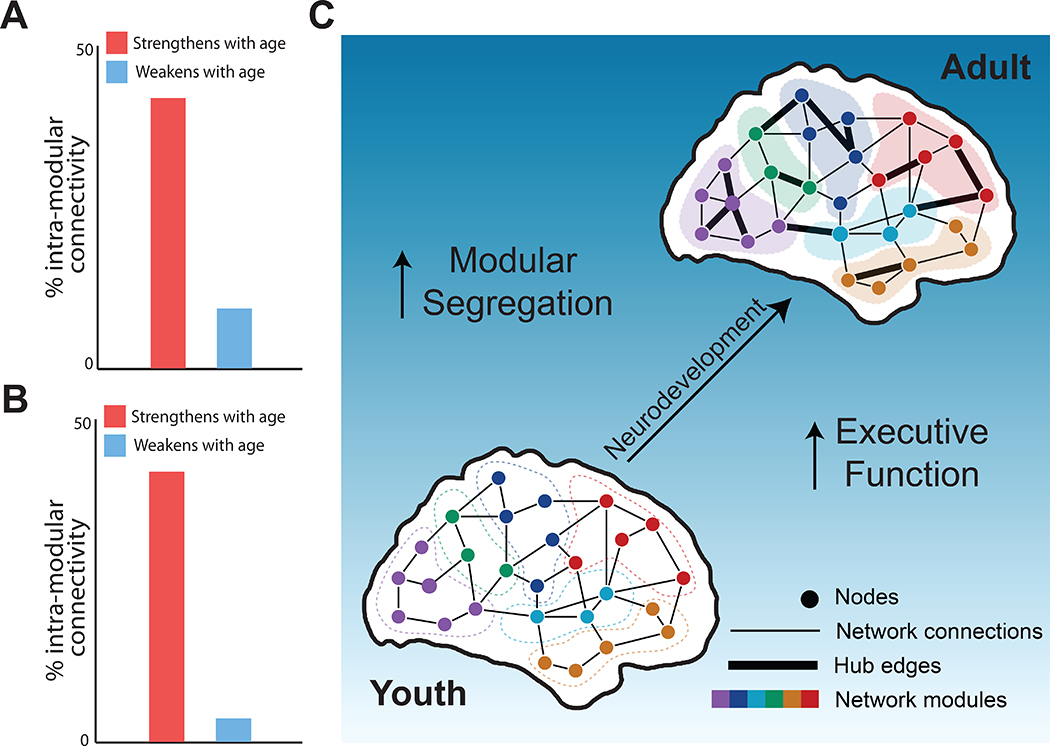
Consistent effects of neurodevelopment are apparent in both functional (panel a) and structural networks (panel b). Notably, connections that strengthen with age are much more likely to be within a network module, whereas connections that weaken with age predominantly span across modules. These edge level changes result in increased modular segregation of the network. Panel a adapted with permission from Satterthwaite et al., 2014; panels b and c adapted with permission from (61).
Overall, these findings suggest a refinement of the modular structure of brain networks during adolescence through strengthening of within-network connectivity during adolescence and weakening of between-network connectivity. This process is frequently called modular segregation. It should be emphasized that evidence of increased modular segregation during youth is not at odds with the evidence for enhanced connectivity within rich clubs surveyed above. Despite a global decline in between-network connectivity, modular sub-networks do not become isolated. Indeed, recent evidence suggests that the opposite is true: brain networks simultaneously display greater modular segregation and enhanced global integration during adolescent development (61). Development of such unique topology occurs via targeted strengthening of hub edges that link modules, even while most between-module edges weaken. This profile of development is potentially consistent with the strengthening of a rich club module, which is apparent in certain hierarchical models (62).
The modular yet integrated topology that is refined during development may allow for both functional specialization within modules, as well as coordination across modules. Such a configuration may potentially reduce interference among systems and facilitate cognition. Indeed, prior work suggests that greater modular segregation during adolescence is related to improvements in executive performance (61) (Figure 2c). Furthermore, as described in the next section, emerging evidence suggests that the disruption of such normative developmental processes may be associated with vulnerability to neuropsychiatric illness.
DEVELOPMENTAL NETWORK ABNORMALITIES ASSOCIATED WITH PSYCHOSIS
Severe neuropsychiatric disorders such as schizophrenia are increasingly conceptualized as developmental disorders of brain connectivity (63). This paradigm shift has been driven by the lack of evidence for a single focal “lesion” in psychosis, in concert with mounting evidence for disruption of large-scale brain networks (64). Many aspects of brain networks that evolve during development are also disrupted in psychosis, prompting focus on the developmental antecedents of network-level abnormalities in schizophrenia (65, 66). As described below, there is accumulating evidence that the network abnormalities that are present in adults with frank psychosis are also present in youth at clinical risk (Figure 3).
Figure 3. Psychosis is associated with alterations of network topology.
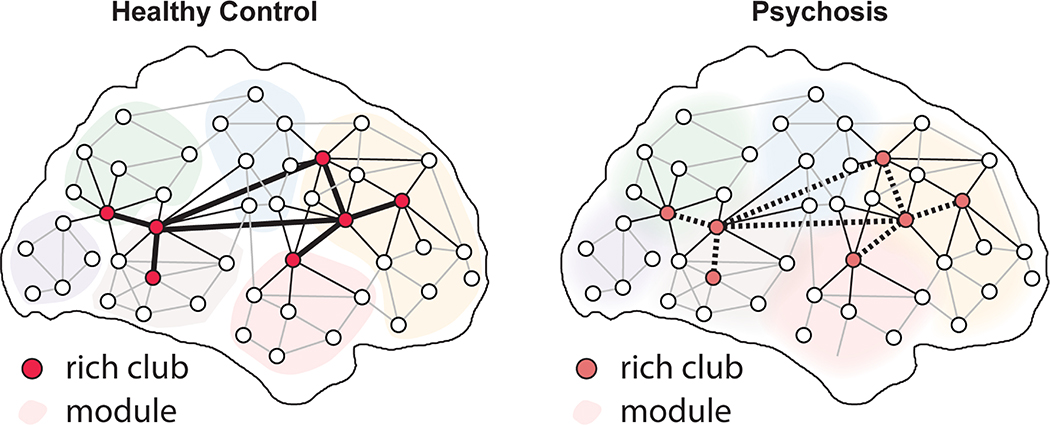
Convergent evidence across studies suggests abnormalities of normal developmental processes, including reduced connectivity within the network core and diminished segregation of network modules.
Studies of adults with schizophrenia have consistently documented disruptions of many aspects of both structural and functional brain networks (67, 68). However, available evidence indicates that the impact of psychosis may be particularly prominent in a network’s core, frequently defined via the “rich club” metric. For example, van den Huevel et al. found evidence for reduced rich club connectivity in both a discovery and replication dataset, in particular impacting hubs in the frontal cortex (69). Similar results were reported in two subsequent independent studies (70, 71). In light of evidence for strengthening of the rich club in normal development (see above), the results of these studies are consistent with a developmental abnormality of connectivity within the network core. The downstream functional impact of such abnormalities is suggested by a recent meta-analysis of task fMRI studies in schizophrenia, which found that activation abnormalities were enriched within rich club nodes (72). Intriguingly, alterations of connectivity within the network core have also been documented in youth at high risk for conversion to psychosis (73), as well as first-degree family members of those affected by psychosis (71, 74, 75). Thus, collectively these changes within the network core may constitute a stable endophenotype for psychosis risk that is independent of disease state. Based on such evidence, investigators are increasingly attempting to map specific genetic risk loci (76) or schizophrenia polygenic risk scores (77) to abnormalities observed in the network core in psychosis.
Along with such abnormalities within the network core, multiple studies have documented a broader disruption of network modularity in association with psychosis. Two studies by Alexander-Bloch et al. reported reduced modular segregation and alterations of community structure in patients with childhood-onset-schizophrenia (78, 79). Similar results are provided by an important cross-diagnostic study by Baker et al., which provided evidence for reduced segregation between the fronto-parietal control system and the default mode network in a large sample of adults with psychotic disorders (schizophrenia and bipolar disorder) (80). However, it should be noted that several of the most consistent findings associated with psychosis — including increased connectivity within the default mode network (81), and abnormalities within fronto-striatial and fronto-thalamic networks (82–85) — are distinct from both abnormalities within the network core and disruption of network modularity. Together, these results emphasize the complex, multi-focal patterns of dysconnectivity that occur in psychosis.
Finally, while the results reviewed here are broadly consistent with an abnormality of the normal process of modular segregation in development, it should be noted that it remains unclear whether the observed alterations of network topology are specific, or result instead from a more nonspecific network randomization process (86) (see Vasa et al. (87) for best practices in detecting randomization processes). Furthermore, it remains unclear whether reported network deficits are specific to psychosis. For example, abnormalities of the network core are a common feature of multiple disorders, although the specific regional distribution may vary across disorders (88). Moving forward, studies that use data-driven strategies to delineate network “biotypes” of psychosis may allow profiles of symptoms to be linked to specific patterns of dysfunction both within and across heterogeneous neuropsychiatric disorders.
METHODOLOGICAL CHALLENGES: DATA QUALITY
Methodological challenges of studying the normal and abnormal development of brain networks can be substantial (89, 90). While methodological issues including acquisition protocol and atlas choice are important (91), data quality is frequently the largest obstacle to studying the development of brain networks, and has recently attracted substantial attention from the field (92–94). Data quality is most commonly driven by in-scanner motion, which is frequently correlated with major variables of interest, including age and group (95). Thus, motion has the potential to systematically confound inference (96, 97).
Motion may be particularly problematic for studies of functional networks: in 2012, three independent groups demonstrated that motion artifacts have a marked impact on measures of functional connectivity (96, 98, 99). The predominant effect of motion is a large drop in intensity across all network nodes (93, 100, 101), which tends to increase the observed functional connectivity across the network (101). However, when functional timeseries preprocessing includes global signal regression (GSR), these widespread changes are largely removed (102). However, the residual impact of motion following GSR tends to have a substantial distance dependence, with motion being associated with an increase in connectivity between spatially adjacent nodes, and diminished connectivity between distant nodes (96, 99).
Such distance-dependent effects can confound developmental inference, with dramatically inflated appearances of weakened of short-range connections and strengthened of long-range connections (97, 103). Such results have led to an acceleration of methodological studies that seek to limit the impact of motion artifact (104–106). Two recent benchmarking studies provide a framework for comparing de-noising approaches (102, 107). Specifically, both GSR and temporal censoring (scrubbing, spike regression, de-spiking) remain a highly effective mechanism for controlling motion artifact (Figure 4). Critically, effective de-noising approaches have also been shown to enhance the ability to detect modular sub-networks in graphs constructed from timeseries impacted by motion (101, 102). However, it should be noted that de-noising techniques can consume many temporal degrees of freedom, and aggressive de-noising procedures may not be practical with timeseries of limited duration (for a recent review, see (92)). While prior guidelines suggest that four to six minutes of usable data is required for network estimation (108), more recent evidence suggests that longer acquisitions improve reliability (109), and are a prerequisite for specific advanced analytic procedures (e.g., functional parcellations; see (110)).
Figure 4. Effective de-noising limits associations between functional connectivity and inscanner motion.
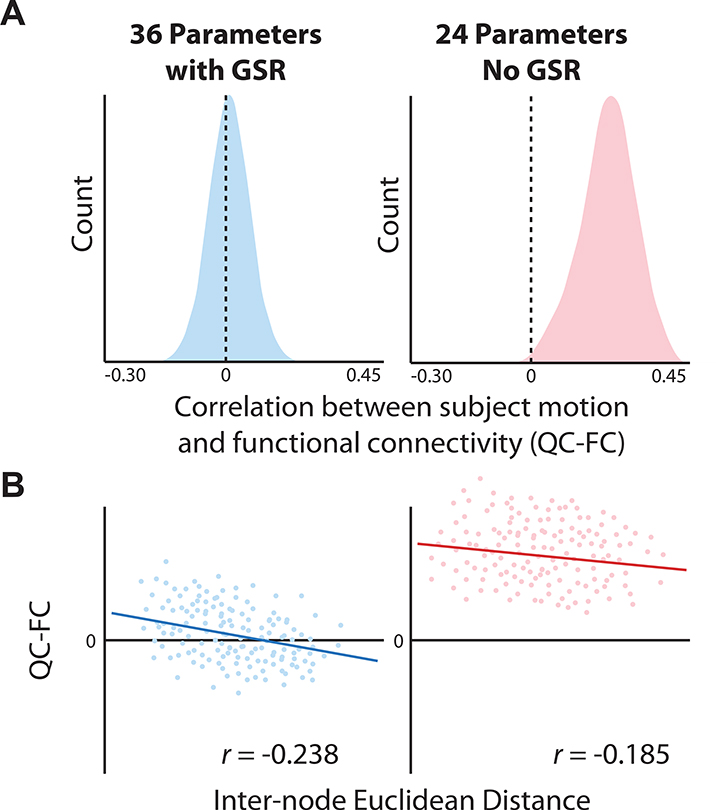
a, When GSR is included in confound regression the distribution of correlations between motion and functional connectivity (“QC-FC”) are markedly reduced, and centered around zero. b, However, inclusion of GSR does result in a mild increase of distance dependence, which is quantified as the slope of the relationship between QC-FC correlations and the inter-node Euclidian distance. The confound regression model without GSR included 24 parameters, including 6 realignment parameters (3 rotations, 3 translations), as well as their temporal derivative, square, and square of their temporal derivatives. The confound regression model with GSR included 36 parameters, which included not just the 6 realignment parameters, but also the mean global signal, the mean white matter signal, and the mean CSF signal. These 9 base parameters were expanded as described above via their temporal derivative, square, and square of the temporal derivative. All data are drawn from a sample of 393 youth aged 8–22 and imaged as part of the Philadelphia Neurodevelopmental Cohort. All analyses include age and sex as covariates. Adapted with permission from (102).
There is substantially less research regarding the impact of motion on structural networks estimated through diffusion imaging (111). One important study demonstrated that motion systematically reduces the fractional anisotropy of major white matter tracts (112). Furthermore, recent results suggest that motion artifact can have a variable impact on structural connectivity that is largely determined by connection consistency (113). Similar to the distance-dependent effects of motion on functional connectivity, in-scanner motion results in diminished connectivity in long-range, highly consistent structural connections in tandem with elevated connectivity in inconsistent (primarily short-range) network connections. Techniques that seek to control for motion in diffusion imaging have undergone rapid evolution, and existing data suggests that recently introduced motion-correction techniques can substantially reduce the impact of motion (114). Specifically, FSL’s eddy procedure now has the capability to build a generative model in order to make non-parametric predictions about the expected signal in each slice of diffusion encoded volumes, and replaces signal outliers attributed to head motion using this prediction (115).
Whether studying functional or structural networks, together these studies emphasize that investigators should evaluate and transparently report associations between motion and both subject-level variables (age, group status, etc.) and network measures of interest (e.g., modularity, rich-club statistics). When significant associations are present, controlling for inscanner motion during hypothesis testing is often warranted (93). Finally, it should be noted that acquiring data with less motion is far preferable to extensive post-processing. This can be facilitated by use of videos during acquisition (116) and new online monitoring solutions (117).
EMERGING FRONTIERS
As most young fields, network neuroscience has begun by describing the organization of brain networks in health and disease: collating observations, categorizing phenotypes, and cataloguing network measures. Yet, descriptions do not amount to explanations, and categories do not amount to mechanisms (118). Gaining insight into such mechanisms and offering such explanations requires the development of theories that can be explicitly tested with perturbative experiments. An important initial step towards theory is the development of generative network models, where biologically-grounded wiring rules are computationally implemented to produce synthetic network architectures with the same properties as those observed in empirical data (119, 120). Generative network models (Figure 5) can be used to posit and test the principles (wiring rules) by which large-scale human brain networks are organized, and offer possible mechanisms for network development (121–125). Examples of such wiring rules include distance penalties based on the cost of maintaining long-range connections (120) and preferences for links between regions sharing similar inputs (25). Furthermore, generative network models can be used to predict network architectures from mechanisms, and future network architectures from growth rules. Such capacities have already proven useful for understanding dysconnectivity syndromes in psychiatry. For example childhood onset schizophrenia has been shown to be consistent with networks produced by a less economical clustering rule (25). Generative modeling approaches could also prove particularly powerful in forecasting the future networks of specific individuals, potentially identifying those with psychosis risk.
Figure 5. Emerging Frontiers: Generative network modeling.
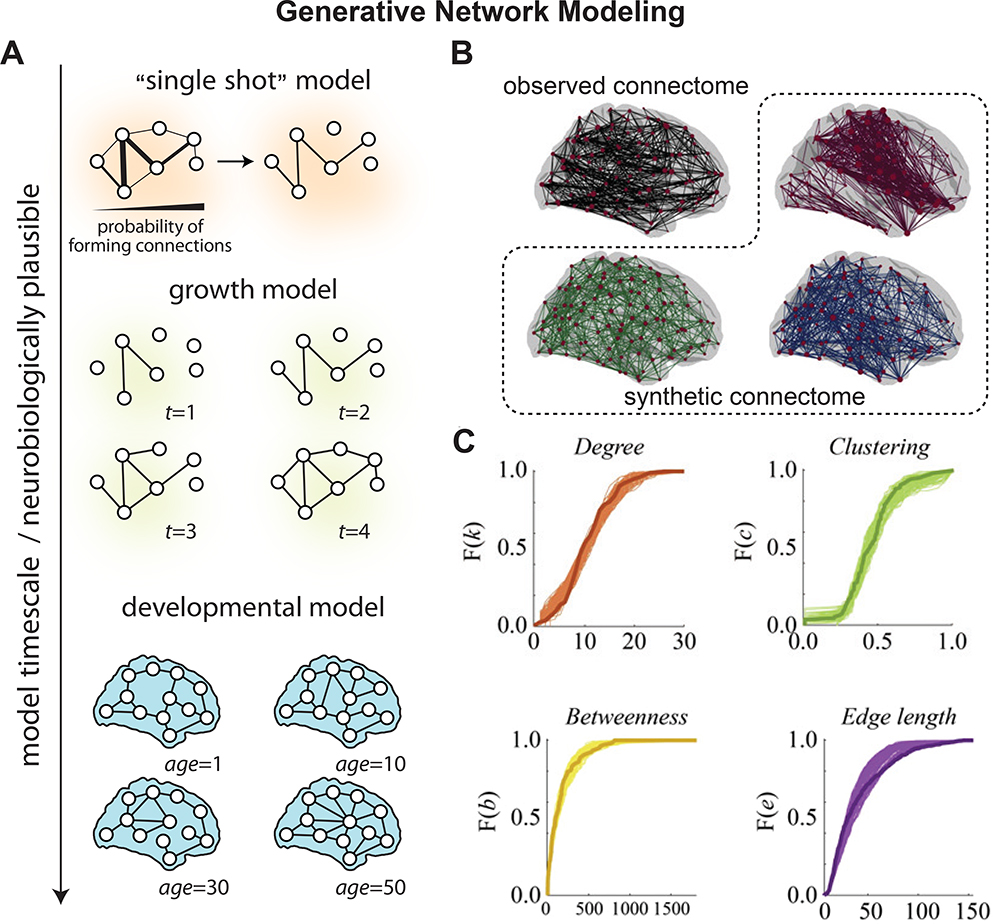
a, The space of generative models. Generative models can be differentiated from one another along several dimensions, one of which is the timescale over which they operate. A model’s timescale is related to its neurobiological plausibility. Models whose timescale is nearer to that of development can incorporate more realistic and interpretable features and, in turn, have the chance of uncovering realistic growth mechanisms. At the opposite end of the spectrum are “single shot” models, where connection probabilities are initialized early on and all connections and weights are generated in a single algorithmic step. Situated between these two extremes are growth models that exhibit intrinsic timescales over which connections and/or nodes are added to the network, but where the timescale has no clear biological interpretation. b, Summary of a geometric model for human white matter networks estimated from diffusion imaging. Observed (black) and synthetic (colors) networks generated at different points in a pre-defined parameter space of interest. Each of the model-generated synthetic networks was created using an edge addition algorithm, in which connections were added probabilistically and one at a time according to a set of parameterized wiring rules. c, Cumulative distributions of degree (orange), clustering coefficient (green), betweenness centrality (yellow), and edge length (purple) for the observed connectome (darker line) and best-fitting synthetic networks (lighter lines) for a representative participant. Panel (a) is adapted with permission from (119). Panels (b) and (c) are adapted with permission from (120).
However, the capacity to identify those individuals at risk for psychosis begs the question of how we can intervene, either to correct existing alterations in connectivity, or to stem the future emergence of abnormal connectivity. While a definitive answer to this question remains uknown, one novel approach that has considerable theoretical potential is network control theory (NCT; Figure 6) (126). Unlike graph theory, which provides descriptive statistics of a network, NCT offers a dynamical systems model to explain how alterations in the activation of a single node in a network can lead to spatially distributed and system-wide effects whose exact pattern depends on the structure of the anatomical white matter network interconnecting all nodes (127). Originally developed in the field of systems engineering, NCT describes how key nodes, or control points, can exert disproportionate influence over system function (128). Control points are identified with metrics that assess the ability of specific nodes to alter a system’s state, based on the underlying network topology. The application of NCT has revolutionized the understanding and design of complex networks in contexts as diverse as financial markets, fire-control systems, and aircraft and automobile design (129).
Figure 6. Emerging Frontiers: Network control theory.
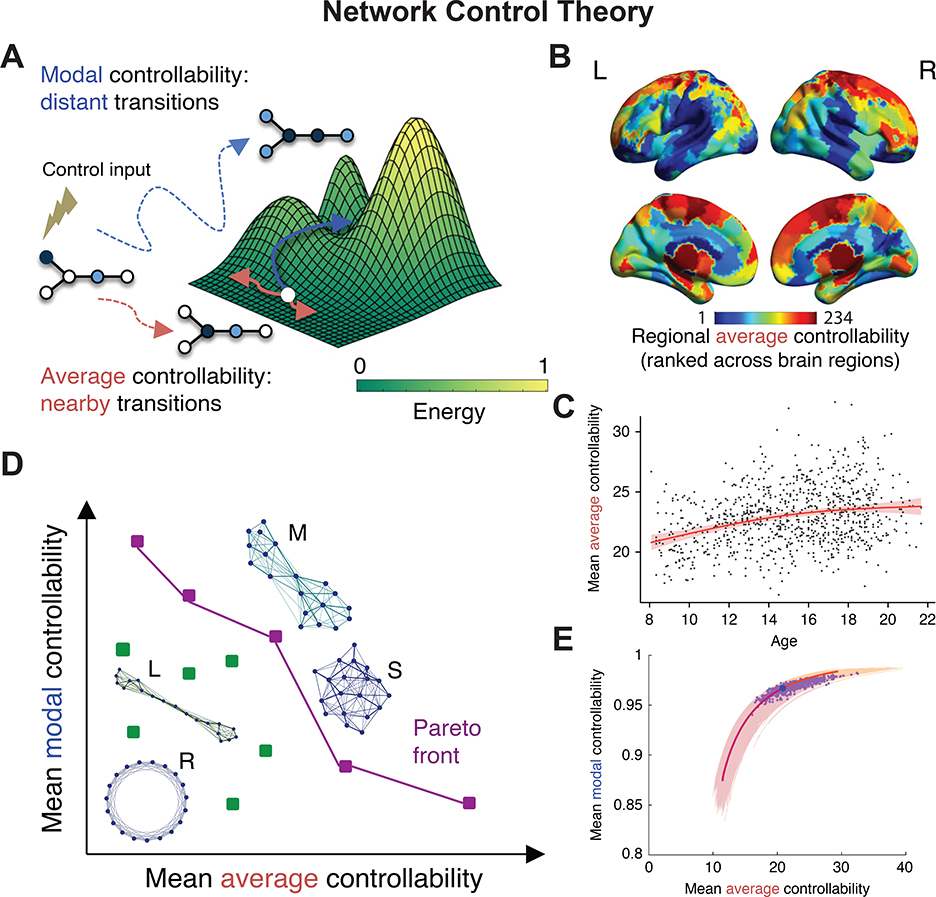
a, Network control theory provides statistics that can be calculated from a dynamical systems model of activity propagation along a fixed structural (or anatomical) network. Here we illustrate the notion of average controllability, which provides structural support for moving the brain to easy-to-reach states nearby on the theoretically constructed energy landscape, and the notion of modal controllability, which provides structural support for moving the brain to difficult-to-reach states, far away on the theoretically constructed energy landscape. b, Applying these notions to structural networks estimated from diffusion tractography applied to diffusion spectrum imaging data acquired in 882 youth between the ages of 8 yr and 22 yr, Tang et al. observed a heterogeneous spatial distribution of average controllability values across 234 cortical and subcortical regions defined by the Lausanne atlas (133). c, In the same data set, Tang et al. observed that average controllability increases appreciably with age, as did modal controllability, while synchronizability decreased with age (not shown). d, To determine whether these statistics were sufficient to explain the observed developmental arc of white matter maturation, Tang and colleagues performed a game theoretic rewiring procedure in which edges were rewired to advance the Pareto front (either increasing controllability and decreasing synchronizability or keeping these statistics constant). Letters beside the networks indicate their topology: ring lattice (R), regular lattice (L), modular (M), and small-world (S). e, The authors observed that the simulated evolutionary trajectories track the human brain data points well, suggesting that one mechanism of human brain development is the reconfiguration of white matter connectivity to increase the human’s ability to flexibly move between diverse brain states. Panels (a-e) adapted with permission from (133).
Critically, the capabilities of NCT match the rationale for administering brain stimulation (130), an FDA-approved treatment for major depression and a candidate treatment for other psychiatric disorders including cognitive dysfunction in psychosis. Prior work applying NCT to neuroimaging data has offered initial evidence that control points can be identified, and that their anatomical location differs depending on the type of brain state transition that is desired (131). These intuitions are built upon an energy landscape constructed directly from the pattern of white matter architecture and a model of network dynamics that defines the patterns of regional activity that are expected to occur nearby in time. Regions theoretically predicted to effectively move the brain into states nearby on the energy landscape tend to be located in the default mode, while regions theoretically predicted to effectively move the brain to distant states tend to be located in fronto-parietal areas implicated in executive function (132). Striking individual differences in the magnitude of regional controllability are observed, particularly in youth, and that variability is correlated with overall cognitive function as assessed with a broad neurocognitive battery (133). It is interesting to speculate that focal pathology in regional controllers early in development could lead to the later dysfunction in cognitive control observed in schizophrenia, and - if such a speculation were supported by empirical observation - it would be interesting to consider designing early stage interventions to reduce the probability of conversion to psychosis from an at-risk state.
Despite the theory’s important contributions to cognitive and developmental neuroscience, to date NCT has not been used to explain the impact of neuromodulation on brain networks. Particularly in the context of focal perturbation, efforts to test such a theory are critical, as validation could provide a generalizable mechanism of clinical interventions that would prove essential for choosing the target of stimulation, titrating stimulation dose, and personalizing stimulation to the subject’s intrinsic brain network architecture. Notably, NCT can also be used to predict the effects of multi-point control, where the activity of multiple control points is altered to affect a change in brain state, and therefore also has potential as an approach for understanding and optimizing pharmacological interventions (118).
More generally, a key approach to understanding the brain is to perturb it (134). Brain stimulation, pharmacological manipulations, and cognitive-behavioral therapy all constitute such perturbative approaches, and therefore will be critical for a comprehensive understanding of the mechanisms of psychopathology. Preliminary studies have used pharmacological manipulations to test a hypothesis regarding a neurotransmitter-level mechanism of psychosis, demonstrating that an NMDA-receptor antagonist alters dynamic reconfiguration of functional brain networks during n-back performance, an intermediate phenotype for schizophrenia, consistent with a posited role of disrupted excitatory-inhibitory balance in the disease (135). Others have demonstrated that individual differences in network architecture can be used to predict who will respond to brain stimulation as a treatment of anhedonia (136). We envision that in the future it will be important to combine such experimental approaches with assessments of individual differences in genotype, cognition, and psychopathology in order to provide a more comprehensive, cross-scale view of psychiatric conditions and the subject-specific brain networks that accompany them, and to inform next-generation personalized interventions that maximize clinical impact.
CONCLUSION
In this article, we have reviewed emerging evidence supporting the utility of network neuroscience in understanding psychiatric disease, particularly in relation to the differences between normal and abnormal brain network development. We envision that the elegant mathematical approaches of network science will serve to greatly support the goals of computational psychiatry, providing not only biomarkers and predictive phenotypes, but also fundamental insight into the systems-level processes of psychopathology. As this young field continues to grow, we anticipate that it will accelerate advances in our understanding of psychiatric disease and its developmental origins.
ACKNOWLEDGMENTS
We broadly thank our collaborators, students, and mentors, who have shaped our views on the subjects of this review. We specifically thank Richard F. Betzel for assistance in the creation of Figure 1a. DSB would like to acknowledge support from the John D. and Catherine T. MacArthur Foundation, the Paul G. Allen Foundation, the Army Research Laboratory through contract number W911NF-10–2-0022, the Army Research Office through contract number W911NF-16–1-0474, the National Institute of Health (R01-DC009209–11, R01HD086888–01, R01MH107235, R01MH107703, R01MH109520, R01NS099348 and R21MH106799), the Office of Naval Research, and the National Science Foundation (BCS-1441502, CAREER PHY-1554488, BCS-1631550, and CNS-1626008). TDS was supported by R01MH107703, R01MH112847, and R21MH106799. The content is solely the responsibility of the authors and does not necessarily represent the official views of any of the funding agencies.
Footnotes
Publisher's Disclaimer: This is a PDF file of an unedited manuscript that has been accepted for publication. As a service to our customers we are providing this early version of the manuscript. The manuscript will undergo copyediting, typesetting, and review of the resulting proof before it is published in its final citable form. Please note that during the production process errors may be discovered which could affect the content, and all legal disclaimers that apply to the journal pertain.
FINANCIAL DISCLOSURES
The authors report no biomedical financial interests or potential conflicts of interest.
REFERENCES
- 1.Singer W (2010): Temporal Coherence: A Versatile Code for the Definition of Relations. Senses A Compr Ref. 2: 1–9. [Google Scholar]
- 2.Fries P (2005): A mechanism for cognitive dynamics: Neuronal communication through neuronal coherence. Trends Cogn Sci. 9: 474–480. [DOI] [PubMed] [Google Scholar]
- 3.Bressler SL (1995): Large-scale cortical networks and cognition. Brain Res Rev. 20: 288–304. [DOI] [PubMed] [Google Scholar]
- 4.McIntosh AR (2000): Towards a network theory of cognition. Neural Networks. 13: 861–870. [DOI] [PubMed] [Google Scholar]
- 5.Newman MEJ (2010): Networks: an introduction. Oxford University Press. [Google Scholar]
- 6.Bassett DS, Sporns O (2017): Network neuroscience. Nat Neurosci. 20: 353–364. [DOI] [PMC free article] [PubMed] [Google Scholar]
- 7.Bullmore E, Sporns O (2009): Complex brain networks: Graph theoretical analysis of structural and functional systems. Nat Rev Neurosci. 10: 186–198. [DOI] [PubMed] [Google Scholar]
- 8.Hagmann P, Cammoun L, Gigandet X, Meuli R, Honey CJ, Van Wedeen J, Sporns O (2008): Mapping the structural core of human cerebral cortex. PLoS Biol. 6: 1479–1493. [DOI] [PMC free article] [PubMed] [Google Scholar]
- 9.Achard S (2006): A Resilient, Low-Frequency, Small-World Human Brain Functional Network with Highly Connected Association Cortical Hubs. J Neurosci. 26: 63–72. [DOI] [PMC free article] [PubMed] [Google Scholar]
- 10.Bullmore E, Sporns O (2012): The economy of brain network organization. Nat Rev Neurosci. 13: 336. [DOI] [PubMed] [Google Scholar]
- 11.Cao M, Huang H, Peng Y, Dong Q, He Y (2016): Toward Developmental Connectomics of the Human Brain. Front Neuroanat. 10: 25. [DOI] [PMC free article] [PubMed] [Google Scholar]
- 12.Paus T (2005): Mapping brain maturation and cognitive development during adolescence. Trends Cogn Sci. 9: 60–68. [DOI] [PubMed] [Google Scholar]
- 13.Satterthwaite TD, Baker JT (2015): How can studies of resting-state functional connectivity help us understand psychosis as a disorder of brain development? Curr Opin Neurobiol. 30: 85–91. [DOI] [PMC free article] [PubMed] [Google Scholar]
- 14.Casey BJ, Oliveri ME, Insel T (2014): A neurodevelopmental perspective on the research domain criteria (RDoC) framework. Biol Psychiatry. 76: 350–353. [DOI] [PubMed] [Google Scholar]
- 15.Bollobás B (1985): Random graphs. Academic Press. [Google Scholar]
- 16.Albert R, Barabási A-L (2002): Statistical mechanics of complex networks. Rev Mod Phys. 74: 47–97. [Google Scholar]
- 17.Khambhati AN, Sizemore AE, Betzel RF, Bassett DS (2017): Modeling and interpreting mesoscale network dynamics. Neuroimage. . doi: 10.1016/J.NEUROIMAGE.2017.06.029. [DOI] [PMC free article] [PubMed] [Google Scholar]
- 18.Giusti C, Ghrist R, Bassett DS (2016): Two’s company, three (or more) is a simplex. J Comput Neurosci. 41: 1–14. [DOI] [PMC free article] [PubMed] [Google Scholar]
- 19.Glasser MF, Coalson TS, Robinson EC, Hacker CD, Harwell J, Yacoub E, et al. (2016): A multi-modal parcellation of human cerebral cortex. Nature. 1–11. [DOI] [PMC free article] [PubMed] [Google Scholar]
- 20.He Y, Chen ZJ, Evans AC (2007): Small-world anatomical networks in the human brain revealed by cortical thickness from MRI. Cereb Cortex. 17: 2407–2419. [DOI] [PubMed] [Google Scholar]
- 21.Chen ZJ, He Y, Rosa-Neto P, Germann J, Evans AC (2008): Revealing modular architecture of human brain structural networks by using cortical thickness from MRI. Cereb Cortex. 18: 2374–2381. [DOI] [PMC free article] [PubMed] [Google Scholar]
- 22.Alexander-Bloch AF, Giedd JN, Bullmore E (2013): Imaging structural co-variance between human brain regions. Nat Rev Neurosci. 14: 322–336. [DOI] [PMC free article] [PubMed] [Google Scholar]
- 23.Yu Q, Erhardt EB, Sui J, Du Y, He H, Hjelm D, et al. (2015): Assessing dynamic brain graphs of time-varying connectivity in fMRI data: Application to healthy controls and patients with schizophrenia. Neuroimage. 107: 345–355. [DOI] [PMC free article] [PubMed] [Google Scholar]
- 24.Medaglia JD, Satterthwaite TD, Kelkar A, Ciric R, Moore TM, Ruparel K, et al. (2017): Brain state expression and transitions are related to complex executive cognition in normative neurodevelopment. Neuroimage. 166: 293–306. [DOI] [PMC free article] [PubMed] [Google Scholar]
- 25.Vertes PE, Alexander-Bloch AF, Gogtay N, Giedd JN, Rapoport JL, Bullmore ET (2012): Simple models of human brain functional networks. Proc Natl Acad Sci. 109: 5868–5873. [DOI] [PMC free article] [PubMed] [Google Scholar]
- 26.Bassett DS, Bullmore E (2006): Small-world brain networks. Neuroscientist. 12: 512–523. [DOI] [PubMed] [Google Scholar]
- 27.van den Heuvel MP, Stam CJ, Boersma M, Hulshoff Pol HE (2008): Small-world and scale-free organization of voxel-based resting-state functional connectivity in the human brain. Neuroimage. 43: 528–539. [DOI] [PubMed] [Google Scholar]
- 28.Bassett DS, Bullmore ET (2017): Small-World Brain Networks Revisited. Neurosci. 23: 499–516. [DOI] [PMC free article] [PubMed] [Google Scholar]
- 29.Meunier D, Lambiotte R, Fornito A, Ersche KD, Bullmore ET (2009): Hierarchical modularity in human brain functional networks. Front Hum Neurosci. 3: 1–12. [DOI] [PMC free article] [PubMed] [Google Scholar]
- 30.Karrer B, Newman MEJ (2011): Stochastic blockmodels and community structure in networks. Phys Rev E - Stat Nonlinear, Soft Matter Phys. 83: 1–11. [DOI] [PubMed] [Google Scholar]
- 31.van den Heuvel MP, Sporns O (2011): Rich-Club Organization of the Human Connectome. J Neurosci. 31: 15775–15786. [DOI] [PMC free article] [PubMed] [Google Scholar]
- 32.van den Heuvel MP, Bullmore ET, Sporns O (2016): Comparative Connectomics. Trends Cogn Sci. 20: 345–361. [DOI] [PubMed] [Google Scholar]
- 33.Borgatti SP, Everett MG (2000): Models of core/periphery structures. Soc Networks. 21: 375–395. [Google Scholar]
- 34.Colizza V, Flammini A, Serrano MA, Vespignani A (2006): Detecting rich-club ordering in complex networks. Nat Phys. 2: 110–115. [Google Scholar]
- 35.van den Heuvel MP, Sporns O (2013): An Anatomical Substrate for Integration among Functional Networks in Human Cortex. J Neurosci. 33: 14489–14500. [DOI] [PMC free article] [PubMed] [Google Scholar]
- 36.van den Heuvel MP, Kahn RS, Goni J, Sporns O, van den Heuvel MP (2012): High-cost, high-capacity backbone for global brain communication. Proc Natl Acad Sci U S A. 109: 11372–77. [DOI] [PMC free article] [PubMed] [Google Scholar]
- 37.Ball G, Aljabar P, Zebari S, Tusor N, Arichi T, Merchant N, et al. (2014): Rich-club organization of the newborn human brain. Proc Natl Acad Sci. 111: 7456–7461. [DOI] [PMC free article] [PubMed] [Google Scholar]
- 38.Towlson EK, Vertes PE, Ahnert SE, Schafer WR, Bullmore ET (2013): The Rich Club of the C. elegans Neuronal Connectome. J Neurosci. 33: 6380–6387. [DOI] [PMC free article] [PubMed] [Google Scholar]
- 39.de Reus MA, van den Heuvel MP (2013): Rich Club Organization and Intermodule Communication in the Cat Connectome. J Neurosci. 33: 12929–12939. [DOI] [PMC free article] [PubMed] [Google Scholar]
- 40.Harriger L, van den Heuvel MP, Sporns O (2012): Rich Club Organization of Macaque Cerebral Cortex and Its Role in Network Communication. PLoS One. 7. doi: 10.1371/journal.pone.0046497. [DOI] [PMC free article] [PubMed] [Google Scholar]
- 41.Fulcher BD, Fornito A (2016): A transcriptional signature of hub connectivity in the mouse connectome. Proc Natl Acad Sci. 113: 1435–1440. [DOI] [PMC free article] [PubMed] [Google Scholar]
- 42.Hwang K, Hallquist MN, Luna B (2013): The development of hub architecture in the human functional brain network. Cereb Cortex. 23: 2380–2393. [DOI] [PMC free article] [PubMed] [Google Scholar]
- 43.Zhao T, Cao M, Niu H, Zuo XN, Evans A, He Y, et al. (2015): Age-related changes in the topological organization of the white matter structural connectome across the human lifespan. Hum Brain Mapp. 36: 3777–3792. [DOI] [PMC free article] [PubMed] [Google Scholar]
- 44.Wierenga LM, van den Heuvel MP, Oranje B, Giedd JN, Durston S, Peper JS, et al. (2017): A multisample study of longitudinal changes in brain network architecture in 4–13-year-old children. Hum Brain Mapp. 170: 157–170. [DOI] [PMC free article] [PubMed] [Google Scholar]
- 45.Grayson DS, Ray S, Carpenter S, Iyer S, Dias TGC, Stevens C, et al. (2014): Structural and functional rich club organization of the brain in children and adults. PLoS One. 9: 1–13. [DOI] [PMC free article] [PubMed] [Google Scholar]
- 46.Dennis EL, Jahanshad N, Toga AW, McMahon KL, de Zubicaray GI, Hickle I, et al. (2013): Development of the “rich-club” in brain connectivity networks from 438 adolescents and adults aged 12 to 30. Proc IEEE Int Symp Biomed Imaging. 624–627. [DOI] [PMC free article] [PubMed] [Google Scholar]
- 47.Watanabe T, Rees G (2015): Age-associated changes in rich-club organisation in autistic and neurotypical human brains. Sci Rep. 5: 1–13. [DOI] [PMC free article] [PubMed] [Google Scholar]
- 48.Newman mEJ (2006): Modularity and community structure in networks. Proc Natl Acad Sci. 103: 8577–8582. [DOI] [PMC free article] [PubMed] [Google Scholar]
- 49.Sporns O, Betzel RF (2016): Modular Brain Networks. Annu Rev Psychol. 67: 613–640. [DOI] [PMC free article] [PubMed] [Google Scholar]
- 50.Guimera R, Nunes Amaral LA (2005): Functional cartography of complex metabolic networks. Nature. 433: 895–900. [DOI] [PMC free article] [PubMed] [Google Scholar]
- 51.Damoiseaux JS, Rombouts SARB, Barkhof F, Scheltens P, Stam CJ, Smith SM, Beckmann CF (2006): Consistent resting-state networks across healthy subjects. Proc Natl Acad Sci. 103: 13848–13853. [DOI] [PMC free article] [PubMed] [Google Scholar]
- 52.Power JD, Cohen AL, Nelson SM, Wig GS, Barnes KA, Church JA, et al. (2011): Functional network organization of the human brain. Neuron. 72: 665–78. [DOI] [PMC free article] [PubMed] [Google Scholar]
- 53.Yeo BTT, Krienen FM, Sepulcre J, Sabuncu MR, Lashkari D, Hollinshead M, et al. (2011): The organization of the human cerebral cortex estimated by intrinsic functional connectivity. J Neurophysiol. 106: 1125–1165. [DOI] [PMC free article] [PubMed] [Google Scholar]
- 54.Vincent JL, Patel GH, Fox MD, Snyder AZ, Baker JT, Van Essen DC, et al. (2007): Intrinsic functional architecture in the anaesthetized monkey brain. Nature. 447: 83–86. [DOI] [PubMed] [Google Scholar]
- 55.Boes AD, Prasad S, Liu H, Liu Q, Pascual-Leone A, Caviness VS, Fox MD (2015): Network localization of neurological symptoms from focal brain lesions. Brain. 138: 3061–3075. [DOI] [PMC free article] [PubMed] [Google Scholar]
- 56.Fair DA, Dosenbach NUF, Church J a, Cohen AL, Brahmbhatt S, Miezin FM, et al. (2007): Development of distinct control networks through segregation and integration. Proc Natl Acad Sci U S A. 104: 13507–13512. [DOI] [PMC free article] [PubMed] [Google Scholar]
- 57.Fair DA, Cohen AL, Dosenbach NUF, Church JA, Miezin FM, Barch DM, et al. (2008): The maturing architecture of the brain’s default network. Proc Natl Acad Sci. 105: 4028–4032. [DOI] [PMC free article] [PubMed] [Google Scholar]
- 58.Supekar K, Musen M, Menon V (2009): Development of large-scale functional brain networks in children. PLoS Biol. 7. doi: 10.1371/journal.pbio.1000157. [DOI] [PMC free article] [PubMed] [Google Scholar]
- 59.Dosenbach NUF, Nardos B, Cohen AL, Fair DA, Power JD, Church J a, et al. (2010): Prediction of Individual Brain. Science (80-). 329: 1358–1361. [DOI] [PMC free article] [PubMed] [Google Scholar]
- 60.Gu S, Satterthwaite TD, Medaglia JD, Yang M, Gur RERCRE, Gur RERCRE, Bassett DS (2015): Emergence of system roles in normative neurodevelopment. Proc Natl Acad Sci. 112: 201502829. [DOI] [PMC free article] [PubMed] [Google Scholar]
- 61.Baum GL, Ciric R, Roalf DR, Betzel RF, Moore TM, Shinohara RT, et al. (2017): Modular Segregation of Structural Brain Networks Supports the Development of Executive Function in Youth. Curr Biol. 27: 1561–1572.e8. [DOI] [PMC free article] [PubMed] [Google Scholar]
- 62.Zamora-López G, Zhou C, Kurths J (2010): Cortical hubs form a module for multisensory integration on top of the hierarchy of cortical networks. Front Neuroinform. 4: 1. [DOI] [PMC free article] [PubMed] [Google Scholar]
- 63.Rapoport JL, Giedd JN, Gogtay N (2012): Neurodevelopmental model of schizophrenia: update 2012. Mol Psychiatry. 17: 1228–1238. [DOI] [PMC free article] [PubMed] [Google Scholar]
- 64.Fornito A, Zalesky A, Pantelis C, Bullmore ET (2012): Schizophrenia, neuroimaging and connectomics. Neuroimage. 62: 2296–2314. [DOI] [PubMed] [Google Scholar]
- 65.Cuthbert BN, Insel TR (2010): Toward new approaches to psychotic disorders: The NIMH research domain criteria project. Schizophr Bull. 36: 1061–1062. [DOI] [PMC free article] [PubMed] [Google Scholar]
- 66.Insel TR (2010): Rethinking schizophrenia. Nature. 468: 187–193. [DOI] [PubMed] [Google Scholar]
- 67.Bassett DS, Bullmore E, Verchinski BA, Mattay VS, Weinberger DR, Meyer-Lindenberg A (2008): Hierarchical Organization of Human Cortical Networks in Health and Schizophrenia. J Neurosci. 28: 9239–9248. [DOI] [PMC free article] [PubMed] [Google Scholar]
- 68.Lynall M-E, Bassett DS, Kerwin R, McKenna PJ, Kitzbichler M, Muller U, Bullmore E (2010): Functional connectivity and brain networks in schizophrenia. J Neurosci. 30: 9477–87. [DOI] [PMC free article] [PubMed] [Google Scholar]
- 69.Van Den Heuvel MP, Sporns O, Collin G, Scheewe T, Mandl RCW, Cahn W, et al. (2013): Abnormal rich club organization and functional brain dynamics in schizophrenia. JAMA Psychiatry. 70: 783–792. [DOI] [PubMed] [Google Scholar]
- 70.Yu Q, Sui J, Liu J, Plis SM, Kiehl KA, Pearlson G, Calhoun VD (2013): Disrupted correlation between low frequency power and connectivity strength of resting state brain networks in schizophrenia. Schizophr Res. 143: 165–171. [DOI] [PMC free article] [PubMed] [Google Scholar]
- 71.Zhao X, Tian L, Yan J, Yue W, Yan H, Zhang D (2017): Abnormal Rich-Club Organization Associated with Compromised Cognitive Function in Patients with Schizophrenia and Their Unaffected Parents. Neurosci Bull. 33: 445–454. [DOI] [PMC free article] [PubMed] [Google Scholar]
- 72.Crossley NA, Mechelli A, Ginestet C, Rubinov M, Bullmore ET, Mcguire P (2016): Altered hub functioning and compensatory activations in the connectome: A meta-Analysis of functional neuroimaging studies in schizophrenia. Schizophr Bull. 42: 434–442. [DOI] [PMC free article] [PubMed] [Google Scholar]
- 73.Schmidt A, Crossley NA, Harrisberger F, Smieskova R, Lenz C, Riecher-Rössler A, et al. (2017): Structural network disorganization in subjects at clinical high risk for psychosis. Schizophr Bull. 43: 583–591. [DOI] [PMC free article] [PubMed] [Google Scholar]
- 74.Collin G, Kahn RS, De Reus MA, Cahn W, Van Den Heuvel MP (2014): Impaired rich club connectivity in unaffected siblings of schizophrenia patients. Schizophr Bull. 40: 438–448. [DOI] [PMC free article] [PubMed] [Google Scholar]
- 75.Collin G, Scholtens LH, Kahn RS, Hillegers MhJ, van den Heuvel mP (2017): Affected Anatomical Rich Club and Structural-Functional Coupling in Young Offspring of Schizophrenia and Bipolar Disorder Patients. Biol Psychiatry. 82: 746–755. [DOI] [PubMed] [Google Scholar]
- 76.Romme IAC, de Reus MA, Ophoff RA, Kahn RS, van den Heuvel MP (2017): Connectome Disconnectivity and Cortical Gene Expression in Patients With Schizophrenia. Biol Psychiatry. 81: 495–502. [DOI] [PubMed] [Google Scholar]
- 77.French L, Gray C, Leonard G, Perron M, Pike GB, Richer L, et al. (2015): Early Cannabis Use, Polygenic Risk Score for Schizophrenia and Brain Maturation in Adolescence. JAMA Psychiatry. 72: 1002. [DOI] [PMC free article] [PubMed] [Google Scholar]
- 78.Alexander-Bloch AF, Lambiotte R, Roberts B, Giedd J, Gogtay N, Bullmore E (2012): The discovery of population differences in network community structure: New methods and applications to brain functional networks in schizophrenia. Neuroimage. 59: 3889–3900. [DOI] [PMC free article] [PubMed] [Google Scholar]
- 79.Alexander-Bloch AF, Gogtay N, Meunier D, Birn R, Clasen L, Lalonde F, et al. (2010): Disrupted modularity and local connectivity of brain functional networks in childhood-onset schizophrenia. Front Syst Neurosci. 4: 147. [DOI] [PMC free article] [PubMed] [Google Scholar]
- 80.Baker JT, Holmes AJ, Masters G a, Yeo BTT, Krienen F, Buckner RL, Öngür D (2014): Disruption of cortical association networks in schizophrenia and psychotic bipolar disorder. JAMA psychiatry. 71: 109–18. [DOI] [PMC free article] [PubMed] [Google Scholar]
- 81.Whitfield-Gabrieli S, Thermenos HW, Milanovic S, Tsuang MT, Faraone SV, McCarley RW, et al. (2009): Hyperactivity and hyperconnectivity of the default network in schizophrenia and in first-degree relatives of persons with schizophrenia. Proc Natl Acad Sci U S A. 106: 1279–84. [DOI] [PMC free article] [PubMed] [Google Scholar]
- 82.Anticevic A, Cole MW, Repovs G, Murray JD, Brumbaugh MS, Winkler AM, et al. (2014): Characterizing thalamo-cortical disturbances in Schizophrenia and bipolar illness. Cereb Cortex. 24: 3116–3130. [DOI] [PMC free article] [PubMed] [Google Scholar]
- 83.Woodward ND, Cascio CJ (2015): Resting-state functional connectivity in psychiatric disorders. JAMA Psychiatry. 72: 743–744. [DOI] [PMC free article] [PubMed] [Google Scholar]
- 84.Marenco S, Stein JL, Savostyanova AA, Sambataro F, Tan HY, Goldman AL, et al. (2012): Investigation of anatomical thalamo-cortical connectivity and fMRI activation in schizophrenia. Neuropsychopharmacology. 37: 499–507. [DOI] [PMC free article] [PubMed] [Google Scholar]
- 85.Fornito A, Harrison BJ, Goodby E, Dean A, Ooi C, Nathan PJ, et al. (2013): Functional dysconnectivity of corticostriatal circuitry as a risk phenotype for psychosis. JAMA Psychiatry. 70: 1143–1151. [DOI] [PubMed] [Google Scholar]
- 86.Rubinov M, Knock SA, Stam CJ, Micheloyannis S, Harris AWF, Williams LM, Breakspear M (2009): Small-world properties of nonlinear brain activity in schizophrenia. Hum Brain Mapp. 30: 403–416. [DOI] [PMC free article] [PubMed] [Google Scholar]
- 87.Váša F, Bullmore ET, Patel AX (2018): Probabilistic thresholding of functional connectomes: Application to schizophrenia. Neuroimage. 172: 326–340. [DOI] [PubMed] [Google Scholar]
- 88.Crossley NA, Mechelli A, Scott J, Carletti F, Fox PT, Mcguire P, Bullmore ET (2014): The hubs of the human connectome are generally implicated in the anatomy of brain disorders. Brain. 137: 2382–2395. [DOI] [PMC free article] [PubMed] [Google Scholar]
- 89.Fassbender C, Mukherjee P, Schweitzer JB (2017): Minimizing noise in pediatric task-based functional MRI; Adolescents with developmental disabilities and typical development. Neuroimage. 149: 338–347. [DOI] [PMC free article] [PubMed] [Google Scholar]
- 90.Church JA, Petersen SE, Schlaggar BL (2010): The “Task B problem” and other considerations in developmental functional neuroimaging. Hum Brain Mapp. 31: 852–862. [DOI] [PMC free article] [PubMed] [Google Scholar]
- 91.Ghosh SS, Kakunoori S, Augustinack J, Nieto-Castanon A, Kovelman I, Gaab N, et al. (2010): Evaluating the validity of volume-based and surface-based brain image registration for developmental cognitive neuroscience studies in children 4 to 11years of age. Neuroimage. 53: 85–93. [DOI] [PMC free article] [PubMed] [Google Scholar]
- 92.Satterthwaite TD, Ciric R, Roalf DR, Davatzikos C, Bassett DS, Wolf DH (2017): Motion artifact in studies of functional connectivity: Characteristics and mitigation strategies. Hum Brain Mapp. 0. doi: 10.1002/hbm.23665. [DOI] [PMC free article] [PubMed] [Google Scholar]
- 93.Power JD, Mitra A, Laumann TO, Snyder AZ, Schlaggar BL, Petersen SE (2014): Methods to detect, characterize, and remove motion artifact in resting state fMRI. Neuroimage. 84: 320–341. [DOI] [PMC free article] [PubMed] [Google Scholar]
- 94.Power JD, Schlaggar BL, Petersen SE (2015): Recent progress and outstanding issues in motion correction in resting state fMRI. Neuroimage. 105: 536–551. [DOI] [PMC free article] [PubMed] [Google Scholar]
- 95.Siegel JS, Mitra A, Laumann TO, Seitzman BA, Raichle M, Corbetta M, Snyder AZ (2017): Data quality influences observed links between functional connectivity and behavior. Cereb Cortex. 27: 4492–4502. [DOI] [PMC free article] [PubMed] [Google Scholar]
- 96.Satterthwaite TD, Wolf DH, Loughead J, Ruparel K, Elliott MA, Hakonarson H, et al. (2012): Impact of in-scanner head motion on multiple measures of functional connectivity: Relevance for studies of neurodevelopment in youth. Neuroimage. 60: 623–632. [DOI] [PMC free article] [PubMed] [Google Scholar]
- 97.Satterthwaite TD, Wolf DH, Ruparel K, Erus G, Elliott MA, Eickhoff SB, et al. (2013): Heterogeneous impact of motion on fundamental patterns of developmental changes in functional connectivity during youth. Neuroimage. 83: 45–57. [DOI] [PMC free article] [PubMed] [Google Scholar]
- 98.van Dijk KRA, Sabuncu MR, Buckner RL (2012): The influence of head motion on intrinsic functional connectivity MRI. Neuroimage. 59: 431–438. [DOI] [PMC free article] [PubMed] [Google Scholar]
- 99.Power JD, Barnes KA, Snyder AZ, Schlaggar BL, Petersen SE (2012): Spurious but systematic correlations in functional connectivity MRI networks arise from subject motion. Neuroimage. 59: 2142–2154. [DOI] [PMC free article] [PubMed] [Google Scholar]
- 100.Power JD, Plitt M, Laumann TO, Martin A (2017): Sources and implications of whole-brain fMRI signals in humans. Neuroimage. 146: 609–625. [DOI] [PMC free article] [PubMed] [Google Scholar]
- 101.Satterthwaite TD, Elliott MA, Gerraty RT, Ruparel K, Loughead J, Calkins ME, et al. (2013): An improved framework for confound regression and filtering for control of motion artifact in the preprocessing of resting-state functional connectivity data. Neuroimage. 64: 240–256. [DOI] [PMC free article] [PubMed] [Google Scholar]
- 102.Ciric R, Wolf DH, Power JD, Roalf DR, Baum GL, Ruparel K, et al. (2017): Benchmarking of participant-level confound regression strategies for the control of motion artifact in studies of functional connectivity. Neuroimage. 154: 174–187. [DOI] [PMC free article] [PubMed] [Google Scholar]
- 103.Fair DA, Nigg JT, Iyer S, Bathula D, Mills KL, Dosenbach NUF, et al. (2013): Distinct neural signatures detected for ADHD subtypes after controlling for micro-movements in resting state functional connectivity MRI data. Front Syst Neurosci. 6: 1–31. [DOI] [PMC free article] [PubMed] [Google Scholar]
- 104.Pruim RHR, Mennes M, van Rooij D, Llera A, Buitelaar JK, Beckmann CF (2015): ICA-AROMA: A robust ICA-based strategy for removing motion artifacts from fMRI data. Neuroimage. 112: 267–277. [DOI] [PubMed] [Google Scholar]
- 105.Griffanti L, Salimi-Khorshidi G, Beckmann CF, Auerbach EJ, Douaud G, Sexton CE, et al. (2014): ICA-based artefact removal and accelerated fMRI acquisition for improved resting state network imaging. Neuroimage. 95: 232–247. [DOI] [PMC free article] [PubMed] [Google Scholar]
- 106.Patel AX, Kundu P, Rubinov M, Jones PS, Vértes PE, Ersche KD, et al. (2014): A wavelet method for modeling and despiking motion artifacts from resting-state fMRI time series. Neuroimage. 95: 287–304. [DOI] [PMC free article] [PubMed] [Google Scholar]
- 107.Parkes L, Fulcher BD, Yucel M, Fornito A (2017): An evaluation of the efficacy, reliability, and sensitivity of motion correction strategies for resting-state functional MRI. bioRxiv. 156380.. [DOI] [PubMed] [Google Scholar]
- 108.Van Dijk KRA, Hedden T, Venkataraman A, Evans KC, Lazar SW, Buckner RL (2010): Intrinsic Functional Connectivity As a Tool For Human Connectomics: Theory, Properties, and Optimization. J Neurophysiol. 103: 297–321. [DOI] [PMC free article] [PubMed] [Google Scholar]
- 109.Noble S, Spann MN, Tokoglu F, Shen X, Constable RT, Scheinost D (2017): Influences on the Test-Retest Reliability of Functional Connectivity MRI and its Relationship with Behavioral Utility. Cereb Cortex. 27: 5415–5429. [DOI] [PMC free article] [PubMed] [Google Scholar]
- 110.Laumann TO, Gordon EM, Adeyemo B, Snyder AZ, Joo SJ, Chen M-Y, et al. (2015): Functional System and Areal Organization of a Highly Sampled Individual Human Brain. Neuron. 87: 657–670. [DOI] [PMC free article] [PubMed] [Google Scholar]
- 111.Roalf DR, Quarmley M, Elliott MA, Satterthwaite TD, Vandekar SN, Ruparel K, et al. (2016): The impact of quality assurance assessment on diffusion tensor imaging outcomes in a large-scale population-based cohort. Neuroimage. 125: 903–919. [DOI] [PMC free article] [PubMed] [Google Scholar]
- 112.Yendiki A, Koldewyn K, Kakunoori S, Kanwisher N, Fischl B (2014): Spurious group differences due to head motion in a diffusion MRI study. Neuroimage. 88: 79–90. [DOI] [PMC free article] [PubMed] [Google Scholar]
- 113.Baum GL, Roalf DR, Cook PA, Ciric R, Rosen AFG, Xia C, et al. (2017): The Impact of InScanner Head Motion on Structural Connectivity Derived from Diffusion Tensor Imaging. . [DOI] [PMC free article] [PubMed] [Google Scholar]
- 114.Andersson JLR, Sotiropoulos SN (2016): An integrated approach to correction for off-resonance effects and subject movement in diffusion MR imaging. Neuroimage. 125: 1063–1078. [DOI] [PMC free article] [PubMed] [Google Scholar]
- 115.Andersson JLR, Graham MS, Zsoldos E, Sotiropoulos SN (2016): Incorporating outlier detection and replacement into a non-parametric framework for movement and distortion correction of diffusion MR images. Neuroimage. 141: 556–572. [DOI] [PubMed] [Google Scholar]
- 116.Vanderwal T, Kelly C, Eilbott J, Mayes LC, Castellanos FX (2015): Inscapes: A movie paradigm to improve compliance in functional magnetic resonance imaging. Neuroimage. 122: 222–232. [DOI] [PMC free article] [PubMed] [Google Scholar]
- 117.Dosenbach NUF, Koller JM, Earl EA, Miranda-Dominguez O, Klein RL, Van AN, et al. (2017): Real-time motion analytics during brain MRI improve data quality and reduce costs. Neuroimage. 161: 80–93. [DOI] [PMC free article] [PubMed] [Google Scholar]
- 118.Braun U, Schaefer A, Betzel R, Tost H, Meyer-Lindenberg A, Bassett DS (2017): From maps to multi-dimensional network mechanisms of mental disorders. Neuron. In Press. [DOI] [PMC free article] [PubMed] [Google Scholar]
- 119.Betzel RF, Bassett DS (2017): Generative Models for Network Neuroscience: Prospects and Promise. . doi: 10.1098/rsif.2017.0623. [DOI] [PMC free article] [PubMed] [Google Scholar]
- 120.Betzel RF, Avena-Koenigsberger A, Goni J, He Y, de Reus MA, Griffa A, et al. (2016): Generative models of the human connectome. Neuroimage. 124: 1054–1064. [DOI] [PMC free article] [PubMed] [Google Scholar]
- 121.Watts DJJ, Strogatz SHH (1998): Collective dynamics of “small-world” networks. Nature. 393:440–442. [DOI] [PubMed] [Google Scholar]
- 122.Sole RV, Pastor-Satorras R, Smith E, Kepler TB (2002): A model of large-scale proteome evolution.. doi: 10.1142/S021952590200047X. [DOI] [Google Scholar]
- 123.Vazquez A, Flammini A, Maritan A, Vespignani A (2001): Modeling of protein interaction networks. 38–44. [Google Scholar]
- 124.Middendorf M, Ziv E, Wiggins CH (2005): From The Cover: Inferring network mechanisms: The Drosophila melanogaster protein interaction network. Proc Natl Acad Sci. 102: 3192–3197. [DOI] [PMC free article] [PubMed] [Google Scholar]
- 125.Barabási A-L, Albert R (1999): Emergence of Scaling in Random Networks. Science (80-). 286: 509–513. [DOI] [PubMed] [Google Scholar]
- 126.Liu Y-Y, Slotine J-J, Barabasi A-L (2011): Controllability of complex networks. Nature. 473: 167–173. [DOI] [PubMed] [Google Scholar]
- 127.Kim JZ, Sooer JM, Kahn AE, Vettel JM, Pasqualetti F, Bassett DS (2017): Role of graph architecture in controlling dynamical networks with applications to neural systems. Nat Phys. . doi: 10.1038/NPHYS4268. [DOI] [PMC free article] [PubMed] [Google Scholar]
- 128.Pasqualetti F, Zampieri S, Bullo F (2014): Controllability Metrics, Limitations and Algorithms for Complex Networks. IEEE Trans Control Netw Syst. 1: 40–52. [Google Scholar]
- 129.Pasqualetti F, Dorfler F, Bullo F (2015): Control-Theoretic Methods for Cyberphysical Security: Geometric Principles for Optimal Cross-Layer Resilient Control Systems. IEEE Control Syst. 35: 110–127. [Google Scholar]
- 130.Muldoon SF, Pasqualetti F, Gu S, Cieslak M, Grafton ST, Vettel JM, Bassett DS (2016): Stimulation-Based Control of Dynamic Brain Networks. (C. C. Hilgetag, editor) PLOS Comput Biol. 12: e1005076. [DOI] [PMC free article] [PubMed] [Google Scholar]
- 131.Betzel RF, Gu S, Medaglia JD, Pasqualetti F, Bassett DS (2016): Optimally controlling the human connectome: the role of network topology. Sci Rep. 6: 30770. [DOI] [PMC free article] [PubMed] [Google Scholar]
- 132.Gu S, Pasqualetti F, Cieslak M, Telesford QK, Yu AB, Kahn AE, et al. (2015): Controllability of structural brain networks. Nat Commun. 6: 1–10. [DOI] [PMC free article] [PubMed] [Google Scholar]
- 133.Tang E, Giusti C, Baum GL, Gu S, Pollock E, Kahn AE, et al. (2017): Developmental increases in white matter network controllability support a growing diversity of brain dynamics. Nat Commun. 8: 1252. [DOI] [PMC free article] [PubMed] [Google Scholar]
- 134.Bassett DS, Khambhati AN (2017): A network engineering perspective on probing and perturbing cognition with neurofeedback. Ann N Y Acad Sci. 1396: 126–143. [DOI] [PMC free article] [PubMed] [Google Scholar]
- 135.Braun U, Schäfer A, Bassett DS, Rausch F, Schweiger JI, Bilek E, et al. (2016): Dynamic brain network reconfiguration as a potential schizophrenia genetic risk mechanism modulated by NMDA receptor function. Proc Natl Acad Sci. 113: 12568–12573. [DOI] [PMC free article] [PubMed] [Google Scholar]
- 136.Downar J, Geraci J, Salomons TV, Dunlop K, Wheeler S, McAndrews MP, et al. (2014): Anhedonia and Reward-Circuit Connectivity Distinguish Nonresponders from Responders to Dorsomedial Prefrontal Repetitive Transcranial Magnetic Stimulation in Major Depression. Biol Psychiatry. 76: 176–185. [DOI] [PubMed] [Google Scholar]
- 137.Sporns O (2011): The non-random brain: efficiency, economy, and complex dynamics. Front Comput Neurosci. 5: 5. [DOI] [PMC free article] [PubMed] [Google Scholar]