Abstract
Background
Dose rate variation is a critical factor affecting radionuclide therapy (RNT) efficacy. Relatively few studies to date have investigated the dose rate effect in RNT. Therefore, the aim of this study was to benchmark 90Y RNT (at different dose rates) against external beam radiotherapy (EBRT) in vitro and compare cell kill responses between the two irradiation processes.
Results
Three human colorectal carcinoma (CRC) cell lines (HT29, HCT116, SW48) were exposed to 90Y doses in the ranges 1–10.4 and 6.2–62.3 Gy with initial dose rates of 0.013–0.13 Gy/hr (low dose rate, LDR) and 0.077–0.77 Gy/hr (high dose rate, HDR), respectively. Results were compared to a 6-MV photon beam doses in the range from 1–9 Gy with constant dose rate of 277 Gy/hr. The cell survival parameters from the linear quadratic (LQ) model were determined. Additionally, Monte Carlo simulations were performed to calculate the average dose, dose rate and the number of hits in the cell nucleus.
For the HT29 cell line, which was the most radioresistant, the α/β ratio was found to be ≈ 31 for HDR–90Y and ≈ 3.5 for EBRT. LDR–90Y resulting in insignificant cell death compared to HDR–90Y and EBRT. Simulation results also showed for LDR–90Y, for doses ≲ 3 Gy, the average number of hits per cell nucleus is ≲ 2 indicating insufficiently delivered lethal dose. For 90Y doses 3 Gy the number of hits per nucleus decreases rapidly and falls below ≈ 2 after ≈ 5 days of incubation time. Therefore, our results demonstrate that LDR–90Y is radiobiologically less effective than EBRT. However, HDR–90Y at ≈ 56 Gy was found to be radiobiologically as effective as acute ≈ 8 Gy EBRT.
Conclusion
These results demonstrate that the efficacy of RNT is dependent on the initial dose rate at which radiation is delivered. Therefore, for a relatively long half-life radionuclide such as 90Y, a higher initial activity is required to achieve an outcome as effective as EBRT.
Keywords: Radionuclide therapy (RNT), External beam radiotherapy (EBRT), Yttrium-90
Background
Radionuclide therapy (RNT) is a fast-evolving and promising modality of treating cancer [1]. Targeted RNT, peptide receptor RNT and selective internal RNT are the most common nuclear medicine cancer therapy procedures for treating different types of cancer metastases [2–5]. With current radiopharmaceutical capabilities, different therapeutic radionuclides such as 223Ra, 213Bi, 67Cu,32P, 177Lu and 90Y can be delivered via microparticles, nanoparticles or small peptide molecules [6].
Current clinical therapeutic radionuclides can be classified based on the nature of their radiation properties such as linear energy transfer (LET, which is defined as the energy deposition per unit length travelled); 50–230 keV/ μm for alpha particle emitters, 0.2 keV/ μm for beta emitters and 4–26 keV/ μm for Auger electron emitters [7, 8]. Radionuclides such as 223Ra (α),177Lu (β) and 67Cu (β) which emit particles with a short range (relatively high LET) are used in Targeted RNT [3, 6]. Due to the short-range particles emitted by these radionuclides, they need to be either attached to the surface of the tumour cell or taken up by the cell to deliver a lethal dose [9]. Alternatively, long-range radionuclide emitters can be labelled with nano- or micro-particles for SIRT [6].
Another important property of therapeutic radionuclides is their physical half-life which determines the dose rate at which RNT is delivered along with its initial activity. For a given initial activity, a radionuclide with shorter half-life delivers dose at higher rate compared to longer half-life radionuclides. The effect of dose rate in RNT and external beam radiotherapy (EBRT) dose response can be classified into low and high dose rates (respectively LDR and HDR) [10, 11]. It is also well known that HDR radiation is biologically more effective than the same dose delivered with LDR [10]. In RNT, as the dose rate decreases exponentially, the kinetics of DNA double-strand break (DSB) induction, repair and misrepair may play a more important role in therapeutic outcome than in EBRT. Although several in vitro studies have reported on EBRT dose rate effects [12, 13], relatively few studies to date have investigated dose rate effects in RNT [14–18]. Consequently, the biological principles of RNT are less well developed.
The aim of this study was to establish a platform for experimental and theoretical 90Y RNT in vitro studies and investigate the differences in delivering EBRT and 90Y RNT (both HDR and LDR). Additionally, this study aimed to compare cell kill mechanisms between the two irradiation processes. To do this, we investigate 90Y RNT, which is a common treatment for primary and metastasised liver cancer that initiates from colorectal cancer.
Methods
Cell culture
As this study involved the measurement of radiation survival for a high number of samples, the MTS assay was used instead of the standard clonogenic assay. The human CRC cell lines HT29, HCT116 and SW480 were cultured in RPMI (Roswell Park Memorial Institute) medium supplemented with 10% fetal bovine serum (FBS) and incubated at 37 ∘C in a humidified atmosphere containing 5% CO2. The cells were assessed by MTS (3-(4,5-dimethylthiazol-2-yl)-5-(3-carboxymethoxyphenyl)-2-(4-sulfophenyl)-2H-tetrazolium) cell viability assay which is a colorimetric quantification of viable cells. The assay is based on the reaction of MTS tetrazolium compound by viable cells to generate a coloured formazan product that is soluble in cell culture media. Since the cell culture medium needs to be changed after 8 days, the maximum incubation time was 8 days. However, 90Y requires ≈ 15 days to deliver 98 % of the targeted dose. The initial specific activity of 90Y was calculated to deliver a target dose in 8 days. All experiments were repeated twice to assess consistency.
External beam radiotherapy (EBRT)
Each cell line was cultured in a 96-well plate and allowed 4 h incubation before irradiation. Additionally, a control cell plate for each cell line was prepared. All of the cell cultures were irradiated with a 6 MV flattening filter-free (FFF) linear accelerator (linac) photon beam with a single dose in the range of ≈ 1–9 Gy (Varian, CAUS). All the cell plates were irradiated at a dose rate of ≈ 277 Gy/hr, at 100 cm source–to–surface distance (SSD), with back-scatter and buildup solid water (see Fig. 1a). A 1-Gy dose gradient was applied across each plate so each cell culture in the well (i.e. each column) received a dose with 1 Gy increments. Also Gafchromic film was placed under the plates to measure the dose in each well (see Fig. 1b). All irradiated cell plates were immediately returned to the incubator for 8 days incubation. The EBRT experiment was repeated three times.
Fig. 1.
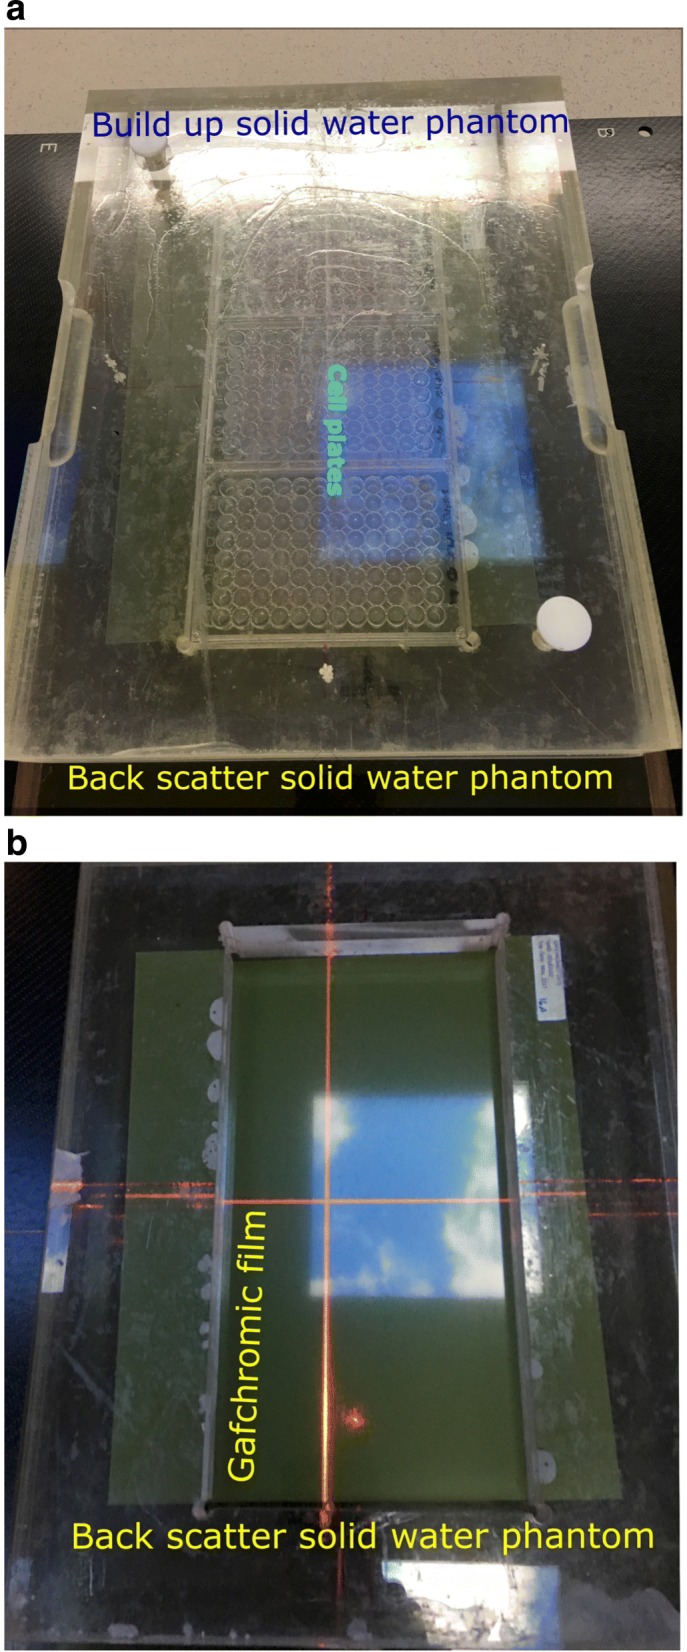
Experimental set-up for irradiating the cells with a 6 MV linac photon beam: a cell plates between two solid water phantoms and b position of the Gafchromic film
90Y Irradiation
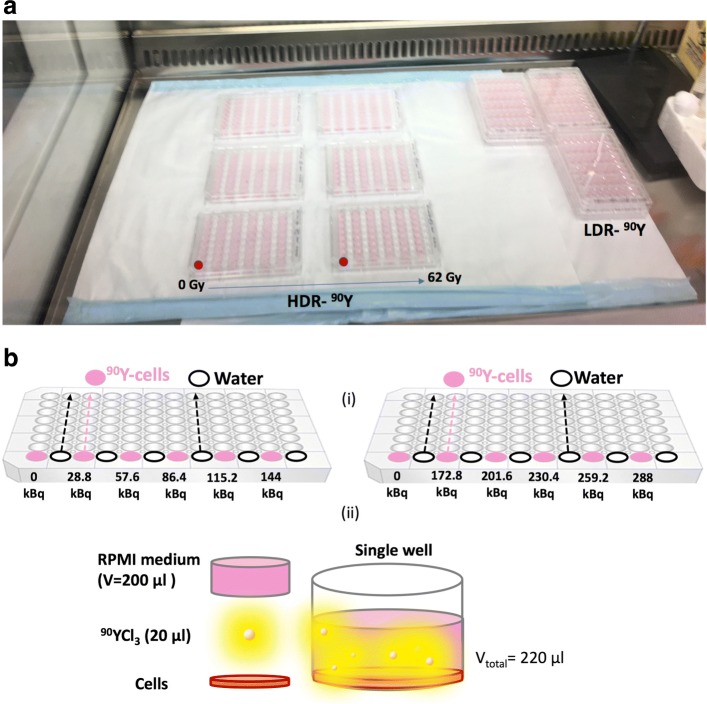
90Y is a beta emitting radionuclide with a physical half-life of ≈ 2.7 days. The mean and maximum energy of the emitted betas are 0.933 and 2.280 MeV, respectively, corresponding to an average and maximum range of 4 and 11.3 mm in water [19, 20]. As mentioned above, each cell line was cultured in a 96-well plate and allowed 4 h incubation before adding the 90YCl3 solution. Additionally, a control cell plate for each cell line was prepared. For each cell line, two identical sets of cell cultures were prepared for irradiation with a uniformly mixed solution of 90YCl3 in varying concentrations (in 10 dilutions): (1) 90YCl3 solutions with LDR specific activity of 0.24–2.4 MBq/ml (corresponding to total dose of ≈ 1–10 Gy); and (2) relatively HDR-specific activity of 1.44–14.4 MBq/ml (corresponding to total dose of ≈ 6–62 Gy). The pH of prepared solutions were also measured to be ≈ 7. A volume of 20 μl from each 90Y dilution was added to each well (see Fig. 2). Matlab was used to calculate the dose rate according to
| 1 |
Fig. 2.
Experimental set-up for 90Y. a Two sets of 90YCl3 (HDR, LDR) activity concentrations were added to the cell plates. Each cell line was plated into two plates with range of 0–62 Gy. The red markers show row of wells that contains the cell without activity. b Schematic diagram illustrating (i) the distribution of cells and 90Y source in two 96-well plates for HDR–90Y set (similar set-up was prepared for LDR–90Y set), (ii) demonstrating a single-well containing the 90YCl3 and cells in RPMI cell medium
where is the initial dose rate, λ is the decay constant, m is the target mass, T is the total irradiation time (8 days) and A(t) is activity as a function of time representing the number of beta particles (i.e. number of decays) emitted per second with energies randomly selected from the 90Y spectrum. The corresponding total doses were calculated according to
| 2 |
for varying 90Y concentrations using the full beta energy spectrum of 90Y. The physical 90Y absorbed doses were calculated to be ≈ 1–10 Gy for LDR and ≈ 6–62 Gy for HDR. Results were also validated by OLINDA [21] and GATE [19] calculations.
Monte Carlo simulation
A Monte Carlo model was developed in the GATE toolkit [19] to calculate the average dose to the cell for varying 90Y concentrations. GATE is a Monte Carlo-based platform developed by the international OpenGATE collaboration for radionuclide imaging and dosimetry applications [19]. All simulations were performed using GATE version 7.1 [19], which uses GEANT4 10.1.p01 [20]. The low-energy electromagnetic physics package [22] of GEANT4, which describes electron, photon, and light ion interactions over an energy range of 250–1 GeV, was used for all simulations.
The energy spectrum of emitted beta particles was obtained using GEANT4 [20, 23] and imported into GATE. The stochastic processes of beta emission and hit distribution, as well as associated energy and dose deposition, were simulated using Monte Carlo radiation transport within GEANT4. The total number of beta particles emitted in a single-well plate was determined using
| 3 |
where represents the total number of nuclear disintegrations (i.e. cumulative activity) and A0 is the initial activity.
Geometry set-up
A monolayer of 5000 non-overlapping spherical “cells” was randomly placed at the bottom of a 200 μl cylindrical well (Fig. 3a–c) to mimic the actual cell culture geometry (see Fig. 3e, f). The average diameter of the cell lines used in this study is approximately 15 μm [24]. Therefore, cells were modelled as spheres with diameter 15 μm and a nucleus with diameter 5 μm. The cells and the well were uniformly filled with water.
Fig. 3.
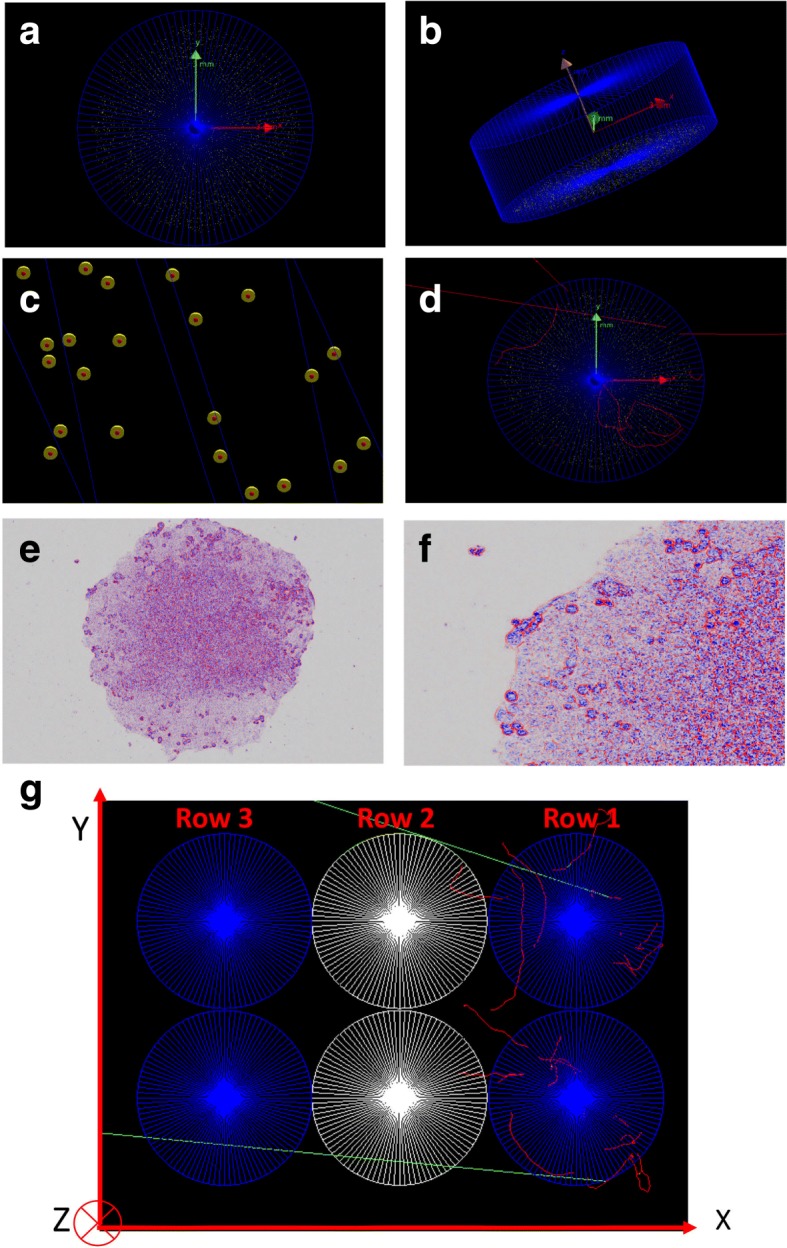
Geometry set-up in the GATE simulations: a, b 5000 non-overlapping spherical cells randomly distributed in a cylindrical well (axial and cross-sectional views); c yellow and red spheres representing the cytoplasm and nucleus respectively; d beta particle tracks (red) in the well; e microspcopy image of a cell culture configuration in a single well; f zoom-in of image in (e); g six adjacent wells in three rows: row 1: active rows with each well containing 288 kBq 90YCl3 in 200 μl cell culture medium, row 2: wells with 200 μl of water, and row 3: with two well only containing 200 μl cell culture medium. The red and green tracks represent emitted beta particles and scattered photons (from the atomic de-excitations), respectively
The 90Y source was uniformly distributed throughout the well and between the cells (random locations outside of the cell volumes). Then, 1010 beta particles with energies randomly selected from the energy spectrum of 90Y were emitted from the source volume in random directions (see Fig. 3d). Finally, results were scaled to the total number of beta particles which corresponds to the cumulative activity in the well for 8 days irradiation. Additionally, the modelled cell culture was irradiated by simulation with a 6 MV FFF linac beam with similar SSD as the experimental set up. The spectrum of the FFF linac beam was obtained from the GATE software [19].
Moreover, additional simulations were performed to confirm that the 90Y-RNT experimental set-up; 1: results in a uniform dose distribution within the well, 2: the amount of cross–fire between adjacent wells in the same row does not affect the targeted dose, and 3: the well containing water can shield/attenuate the active rows from one another. Two adjacent wells were positioned in three rows; row 1 with active wells containing the highest 90YCl3 radioactivity, 288 kBq in 200 μl cell culture medium in each well, row 2 with wells containing 200 μl water, and row 3 with another two wells only containing 200 μl cell culture medium in each well (see Fig. 3g).
Dose actor
The dose actor (a package within GATE) represents a cubic sensitive detector that can be voxelised into 3D rectangular or cubic voxels. Parameters such as dose, deposited energy, number of ionisations and number of beta particle hits were stored into this 3D matrix according to the spatial position of the hits for each individual simulated cell cytoplasm and nucleus. These parameters were calculated for varying 90Y activity concentrations used in the experiment. Additionally, the average number of hits per cell nucleus was calculated as a function of time for each 90Y activity to investigate the effect of initial dose rate. The number of beta particle hits per cell nucleus was calculated using
| 4 |
where An is the total number of decays within day n (where n = 1,2,3,...8) and is the average number of beta particle hits to the nucleus corresponding to the total cumulative activity. For each , the corresponding was determined from simulations.
Cell survival study
For each of the EBRT, LDR and HDR–90Y cell irradiation experiments including their control cell plates, the MTS cell viability assay was added and cells were incubated at 37 ∘C for ≈ 3 h. Next, the viability of each cell culture was measured and α and β parameters were calculated from the linear quadratic (LQ) model [10]:
| 5 |
where SF is the cell survival fraction, α and β are the radiobiological parameters corresponding to the linear and nonlinear (quadratic) responses to the radiation dose. The α and β parameters were obtained by fitting the LQ model, Eq. 5, to the measured survival data. The SF was calculated for each cell line using Eq. 6 [25]:
| 6 |
where is the mean optical density. The cell free wells contained the culture medium only.
The cells are incubated with 90YCl3 for 8 days; however, since the initial dose rate is exponentially decreasing over time, at a critical time (Tcrit) or dose rate (Rcrit) the DNA damage (the probability of causing DSB) effectively becomes insignificant [10]. For an exponentially decreasing dose rate, it is possible to calculate the critical time (Tcrit) after the start of treatment [10]. Tcrit and Rcrit for all the three lines are calculated for the highest initial dose rate using Eqs. 7 and 8 [10]:
| 7 |
| 8 |
where λ, α, R0 and Tav are the decay constant for 90Y, the radiobiological parameter of the cell line, the initial dose rate of 90Y RNT and the average doubling time of the cell line, respectively.
Results
Cell culture
Cell density measurements shown in Fig. 4 were used to find the optimal number of cells for both the EBRT and 90Y RNT experiments. The optimal cell densities in an exponential phase of growth for an 8 day density viability assay were calculated to be 30, 100 and 200 cells/well (in a 96-well plate) for HCT116, HT29 and SW48, respectively.
Fig. 4.
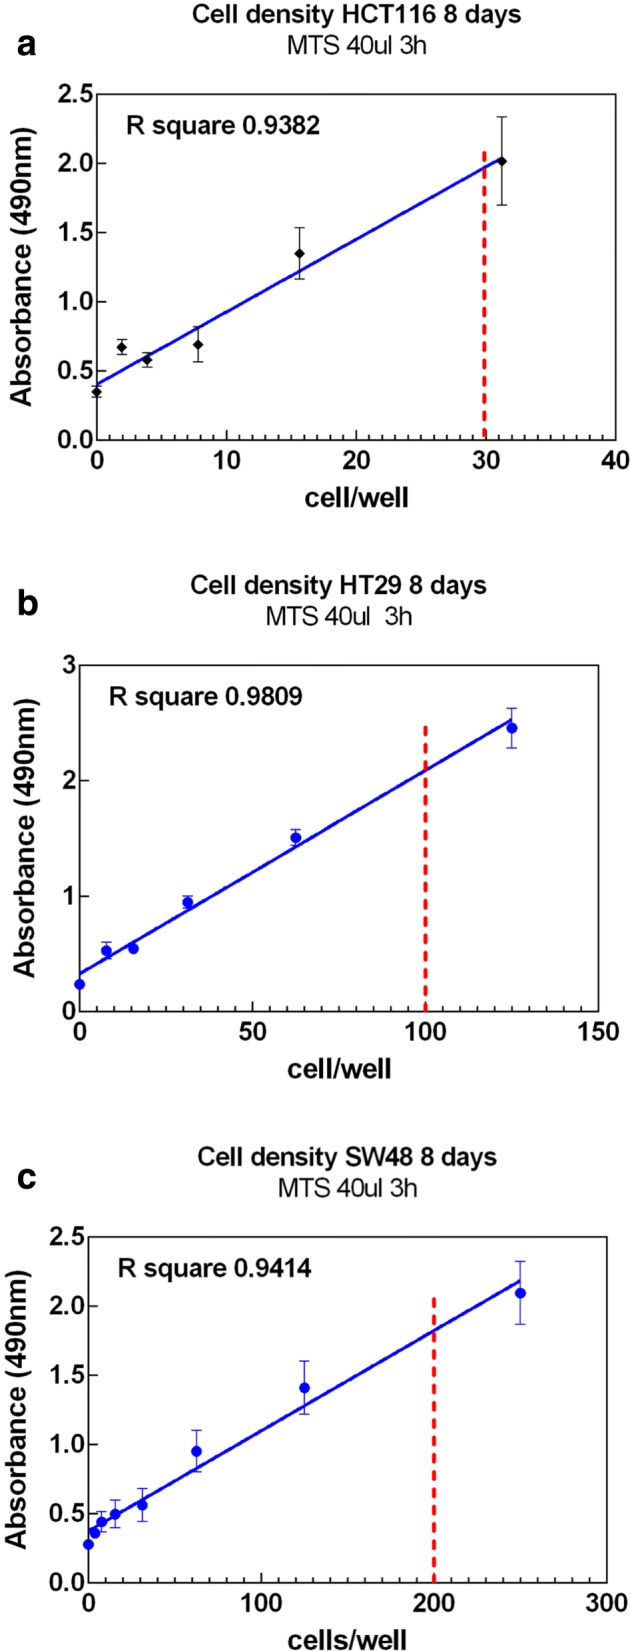
Linear regression fit for the cell density of three cell lines. The red dashed line indicates the number of cells per well used to culture the cells
Dosimetry
A summary of total dose calculations and simulation results are presented in Tables 1 and 2. Figure 5 presents the calculated dose rates with corresponding total doses for both LDR and HDR–90Y. The activity for each delivered dose was selected to achieve the target total dose at T = 8 days incubation. In addition, a summary of total dose calculations performed by GATE, Matlab and OLINDA [21] is presented in Table 1. It is evident from Fig. 5 that different 90Y activities correspond to different initial dose rates, with a maximum ≈ 220 μGy/s, that decay exponentially over incubation time. In comparison, EBRT has a higher and constant dose rate, 277 Gy/h, (i.e. ≈ 105 μGy/s) with shorter irradiation time, T ≈ 1.7 min.
Table 1.
Summary of dose calculations for HDR and LDR–90Y activities
| ALDR (kBq) | AHDR(kBq) | GATE (Gy) | Matlab (Gy) | OLINDA (Gy) | ||||
|---|---|---|---|---|---|---|---|---|
| LDR | HDR | LDR | HDR | LDR | HDR | LDR | HDR | |
| 1 | 48.0 | 288 | 10.3 ± 0.1 | 61.7 ± 0.2 | 10.4 ± 0.2 | 62.3 ± 0.2 | 10.1 ± 0.1 | 60.6 ± 0.1 |
| 2 | 43.2 | 259 | 9.10 ± 0.1 | 55.5 ± 0.1 | 9.30 ± 0.1 | 56.1 ± 0.2 | 9.10 ± 0.1 | 54.5 ± 0.3 |
| 3 | 38.4 | 230 | 8.10 ± 0.1 | 49.4 ± 0.1 | 8.30 ± 0.1 | 49.9 ± 0.1 | 8.10 ± 0.2 | 48.5 ± 0.2 |
| 4 | 33.6 | 202 | 7.20 ± 0.2 | 43.2 ± 0.1 | 7.20 ± 0.1 | 43.6 ± 0.1 | 7.10 ± 0.1 | 42.4 ± 0.1 |
| 5 | 28.8 | 173 | 6.10 ± 0.1 | 37.0 ± 0.1 | 6.20 ± 0.2 | 37.4 ± 0.1 | 6.10 ± 0.2 | 36.6 ± 0.2 |
| 6 | 24.0 | 144 | 4.90 ± 0.1 | 30.9 ± 0.2 | 5.20 ± 0.1 | 31.2 ± 0.2 | 5.10 ± 0.2 | 30.1 ± 0.2 |
| 7 | 19.2 | 115 | 4.10 ± 0.2 | 24.7 ± 0.1 | 4.20 ± 0.2 | 24.9 ± 0.1 | 4.10 ± 0.2 | 24.2 ± 0.3 |
| 8 | 14.4 | 86.4 | 3.10 ± 0.1 | 18.5 ± 0.1 | 3.10 ± 0.1 | 18.7 ± 0.1 | 3.03 ± 0.1 | 18.2 ± 0.1 |
| 9 | 9.60 | 57.6 | 2.10 ± 0.1 | 12.3 ± 0.1 | 2.10 ± 0.1 | 12.5 ± 0.1 | 2.10 ± 0.2 | 12.1 ± 0.2 |
| 10 | 4.80 | 28.8 | 1.10 ± 0.1 | 6.20 ± 0.2 | 1.00 ± 0.1 | 6.20 ± 0.1 | 1.10 ± 0.3 | 6.10 ± 0.1 |
ALDR and AHDR represents the initial activity for the LDR– and HDR–90Y sources, respectively
Table 2.
Summary of GATE simulation results for EBRT and 90Y irradiation
| EBRT | 90Y | |||||
|---|---|---|---|---|---|---|
| Cytoplasm | Nucleus | Cell | Cytoplasm | Nucleus | Cell | |
| Irradiation time | < 1.7 min | < 1.7 min | < 1.7 min | 8 days | 8 days | 8 days |
| Total no. of hits | 3.11 × 10¹⁰ | 7.38 × 10⁹ | 3.85 × 10¹⁰ | 5.57 × 10⁹ | 9.97 × 10⁸ | 6.10 × 10⁹ |
| 1.25 × 10³ | 295 | 1.540 × 10³ | 122 | 21 | 143 | |
| Dint(Gy) | 4.17 × 10⁴ | 8.28 × 10³ | 5.00 × 10⁴ | 4.26 × 10⁴ | 7.71 × 10³ | 5.03 × 10⁴ |
| (Gy) | 10.5 | 10.1 | 10.3 | 10.4 | 10.1 | 10.3 |
| Total no. of ionisations | 1.49 × 10¹⁰ | 6.49 × 10⁹ | 2.14 × 10¹⁰ | 1.11 × 10¹⁰ | 2.78 × 10⁹ | 1.39 × 10¹⁰ |
| Ave no. of ionisations | 2.98 × 10⁷ | 1.30 × 10⁶ | 3.11 × 10⁷ | 2.23 × 10⁷ | 5.56 × 10⁵ | 2.29 × 10⁷ |
, Dint represent the average number of hits and integral dose respectively. The statistical uncertainties are negligible
Fig. 5.
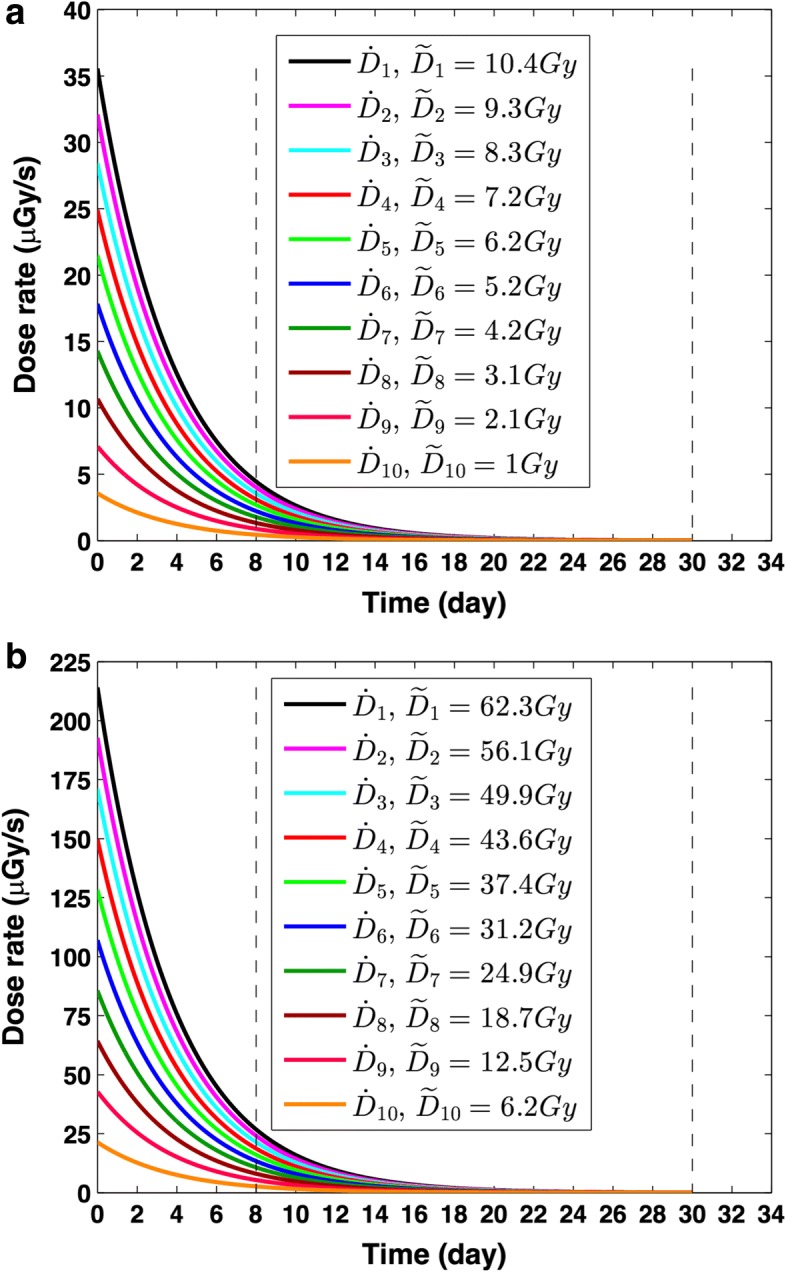
Dose rate () and corresponding total dose (D) for different 90YCl3 concentrations calculated for T = 8 days: a LDR–90Y and b HDR–90Y.
Cell survival
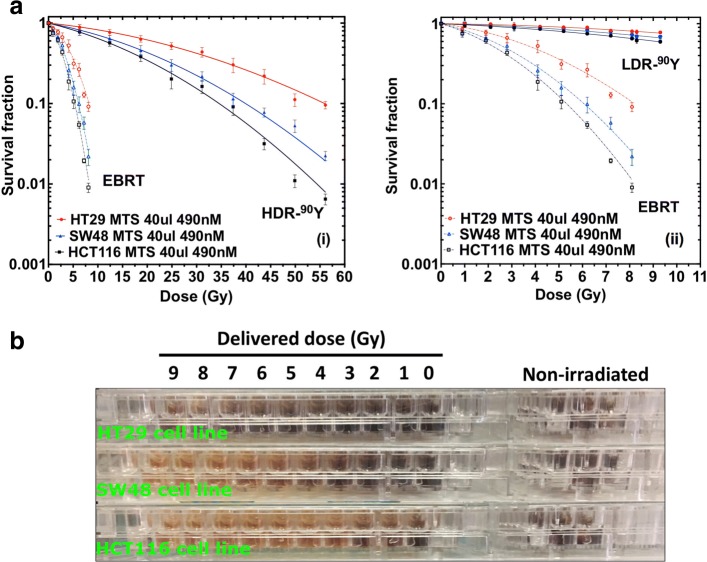
Figure 6 presents the cell survival curves for all three cell lines for both EBRT and 90Y RNT. For each cell line, an EBRT dose > 8 Gy and a HDR–90Y dose > 56 Gy resulted in similar survival fractions and thus are not shown. Comparing the EBRT and HDR–90Y survival curves, similarities can be observed. Both EBRT and HDR–90Y resulted in an exponential dose response. However, at doses < 19 Gy, the HDR–90Y survival curve slope is shallower compared to that for EBRT. As the HDR–90Y dose rate decreases exponentially over the incubation time, for a given dose, HDR–90Y irradiation resulted in less cell kill than EBRT for all three cell lines. Figure 6a (ii) demonstrates the difference between cell survival for LDR–90Y RNT and EBRT, showing a negligible response from LDR–90Y RNT and resulting in negligible dose response compared to EBRT over the dose range studied, 1–8 Gy. The calculated α,β values are listed in Table 3. In comparison to EBRT, both of the α and β parameters for HDR–90Y are smaller. This is due to the relatively lower and exponentially decreasing dose rate of 90Y (i.e. maximum 0.77 Gy/h). Additionally, the Tcrit for each cell lines is presented in Table 4. The Tcrit for all three cell lines ranged approximately between 3 to 5.5 days. The HT29 cell line has the shortest Tcrit (i.e. ≈ 3 days) which further confirmed that HT29 is the most radioresistant cell line.
Fig. 6.
a Cell survival as a function of delivered dose for EBRT and (i) HDR–90Y RNT and (ii) LDR–90Y RNT, b MTS colorimetric dose response of EBRT at different delivered acute doses, darker brown colour represents higher number of viable cells in each well
Table 3.
Summary of α and β parameters from EBRT and HDR–90Y irradiation
| Cell lines | HCT116 | SW48 | HT29 |
|---|---|---|---|
| αEBRT (Gy −1) | 0.1981 | 0.1511 | 0.0842 |
| βEBRT (Gy −2) | 0.0439 | 0.0376 | 0.0239 |
| (Gy −1) | 0.0350 | 0.0265 | 0.0145 |
| (Gy −2) | 0.0009 | 0.0008 | 0.0005 |
Table 4.
Critical times (Tcrit) and dose rates (Rcrit) for HDR–90Y RNT
| Cell lines | λ(h−1) | α(Gy−1) | R0(Gy/h) | Tav(h) | Tcrit(days) | Rcrit(Gy/h) |
|---|---|---|---|---|---|---|
| HCT116 | 0.0107 | 0.1981 | 0.792 | 20 [43] | 5.883 | 0.1749 |
| HT29 | 0.0107 | 0.0842 | 0.792 | 23 [44] | 3.095 | 0.3578 |
| SW48 | 0.0107 | 0.1511 | 0.792 | 24 [43] | 5.538 | 0.1911 |
λ, α, R0 and Tav are the decay constant for 90Y, the radiobiological parameter of the cell line, the initial dose rate of 90Y RNT and the average doubling time of the cell line, respectively
Figure 6b presents the colorimetric dose response of EBRT at different delivered acute doses (e.g. 1–9 Gy). This figure shows all three cell lines with added MTS solution and incubated for 3 h. The dark brown colour represents a higher number of viable cells in each well. The HT29 cell line is shown to be the most radioresistant cell line. This is evident from Fig. 6b as more cells survived at higher dose (darker colour). The HCT116 cell line was the most radiosensitive cell line showing less cell survival at even a low delivered doses (less dark). The α/β ratios were determined from the LQ model (Eq. 5) for both EBRT and HDR–90Y. For LDR–90Y, the percentage of cell kill was insignificant to obtain meaningful α/β values. The alpha values derived from the survival curve were 0.01 ± 0.0029, 0.007 ± 0.0017, and 0.0023 ± 0.001 Gy −1 for HCT116, SW48, and HT29 cell lines, respectively.
Monte Carlo simulation
Figure 7 presents histograms of the number of beta particle hits per cell nucleus during the 8-day irradiation time for both LDR– and HDR–90Y calculated by the simulations. The number of hits per cell nucleus decreases as the activity decays with time. The mean separation between energy deposition events at an LET value of ≈ 1 keV/ μm (i.e. LET of beta particles emitted from 90Y) is larger than the DNA double helix’s diameter (i.e. ≈ 2 nm)[26]. Therefore, for a single-beta particle hit, the probability of a DSB occurring is lower for betas with LET above the mean compare to below the mean [26]. Thus, the minimum number of hits needed to give a nonzero probability of DSB is ≈ 2. It is evident for LDR–90Y that the average number of hits per cell nucleus is ≲ 2 for doses ≲ 3 Gy during the 8 days irradiation time. Although for doses 3 Gy the average number of hits per cell nucleus is 2, it decreases rapidly and falls below 2 after ≈ 5 days of irradiation for doses ≲ 5 Gy. For higher doses, N/nucleus is ≲ 2 after ≈ 7–8 days. For HDR–90Y, similarly, the number of hits per cell nucleus decreases during the 8 days of irradiation time but the average number of hits per cell nucleus remains above 2 for all 90Y doses investigated. For EBRT, 295 and 30 for 10 and 1 Gy total dose, respectively.
Fig. 7.
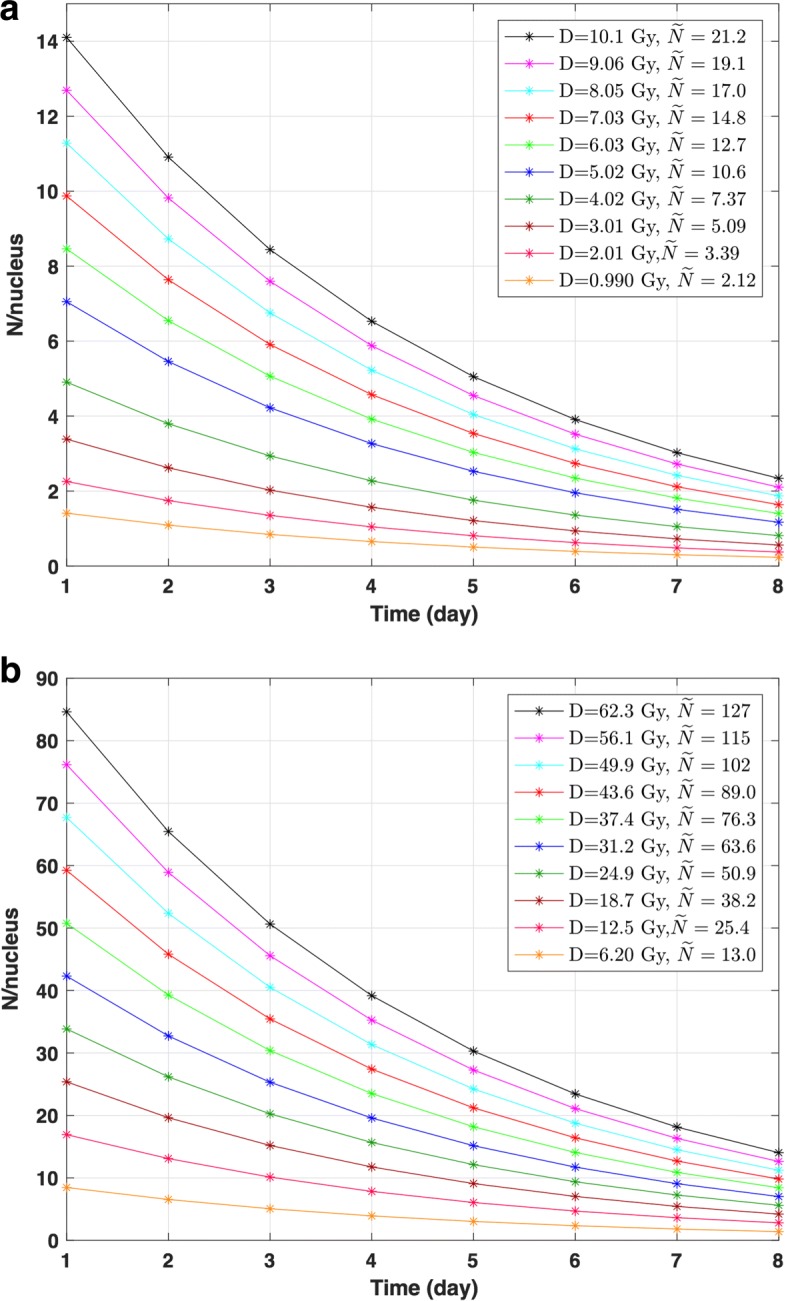
Histograms of the average number of beta particle hits per cell nucleus N/nucleus binned into each day of irradiation and corresponding average number of hits for the total 8-day irradiation time calculated from simulations for a LDR–90Y and b HDR–90Y. D is the total dose (D)
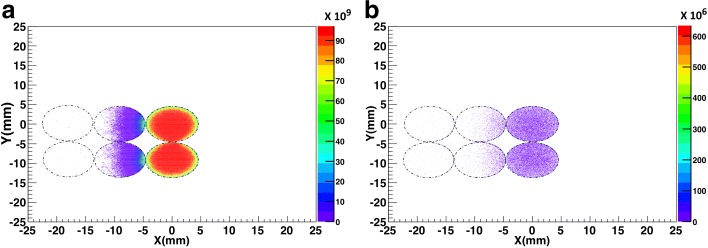
Furthermore, Fig. 8a demonstrates a two-dimensional (2D) histogram of the energy distribution in all six wells. As it is evident from Fig. 8a, most of the voxels in each active well receive a similar energy deposition (the red region). Figure 8b shows a 2D histogram of beta particle fluence for all six wells. The beta particle fluence histogram represents the number of particles that entered into each well from outside (the amount of cross-fire between adjacent wells). Figure 8b demonstrates a beta particle equilibrium between the adjacent active cell wells. Each active well in row 1 equally received 6% from the adjacent well (the purple region). Additionally the cross-fire between the adjacent wells did not change the total energy deposition in each well (each well received approximately 61.7 Gy).
Fig. 8.
a Two-dimensional energy histogram for six adjacent wells by integrating the corresponding 3D energy distribution along the Z direction. The scale bar is in MeV. b Two-dimensional beta particle fluence histogram for six adjacent wells by integrating the corresponding 3D fluence distribution along the Z direction. Black dotted circles indicate the edges of the wells
Discussion
In comparison to the established clonogenic assay, the MTS (or MTT) assays are sensitive and accurate methods with several advantages such as requiring a short time to assess the viability, acquiring the results easily and accurately [25, 27–32]. It measures all viable cells thus representing cells from a true tumour population rather than just clonogenic cells (i.e. cells that can form colonies) [33, 34].
Previous studies have shown that the cells exposed to the higher radiation doses cannot regain their exponential growth in a single MTT or MTS assay, and multiple MTS assays are required to obtain measurements of radiation survival that is comparable to that of clonogenic assays [27, 29]. Although previous studies have shown that MTS and MTT assays are suitable to investigate the radiation dose-response analysis [29], the clonogenic assay has been preferred to measure survival after radiation exposure, as it measures the sum of all modes of cell death, encompassing both early and late events such as delayed growth arrest [35]. Therefore, the α/β ratios derived from a metabolic activity assay at a single time point should be used cautiously in further radiobiological modelling. Additionally, the cells sustaining radiation-induced damage may exhibit delayed effects and there could be a lag between irradiation and subsequent biological events (e.g. cell cycle arrest, caspase activation) leading to cell death [10, 36]. The acute DNA damage induced by radiation and the subsequent cellular responses are influenced by multiple factors including radiation characteristic, dose rate and cell cycle phase [10, 36]. In RNT, the dose rate is one of the most important factors influencing the cell damage, cell repair and also the effective treatment time. The Tcrit for all three lines ranges approximately 3–5.5 days. In this study, the MTS assays were performed eight days after the initial addition of 90YCl3, on average ≈ 4 days beyond these critical times where the treatment is effectively being insignificant and the delayed effects could occur. Thus, performing the MTS assay after the actual treatment time could still include the cell death due to the delayed effects.
The cell survival results provide insight into different damage responses to EBRT and 90Y RNT. With EBRT, the dose was delivered at a constant dose rate of 277 Gy/h in ≈ 1.7 min, whereas 90Y was delivered at a lower dose and varying rate (i.e. 0.013–0.13 Gy/h and 0.077–0.77 Gy/h) over 8 days. The dose rate and nature of radiation clearly affects the nature of cell damage. There are two types of cell damages: (1) double-strand break (DSB), where two proximal DNA strands are broken simultaneously by a single radiation event causing lethal damage (LD) (i.e. cell death) and (2) single-strand break (SSB), where each DNA strand broken by independent radiation events. When only a single DNA strand is damaged, the cell is considered sublethally damaged (SLD) and has the ability to repair itself typically within in 0.5-3 hours [37]. Therefore, at lower dose rates, the probability of accruing two sequential hits to damage before DNA repair is less. Moreover for an exponentially decreasing dose rate, the probability of DSB is even lower. Therefore LDR–90Y RNT is less effective at causing lethal damage than HDR–90Y RNT and EBRT.
The rate of cell kill through the DSB process is measured from the response component of the survival curve parameterised by α. The rate of cell kill through the SSB process is measured from the quadratic part of the survival curve, parameterised by β which is highly dependent on the initial dose rate. The value of α depends on the the radiation type. For high LET radiation such as alpha particles, DSB dominates the cell kill process and therefore α has higher significance than β. Therefore, for a low and exponentially decreasing dose rate 90Y source, there is less contribution to SF from the βD2 component than from the α term. This is evident from Fig. 6a (i and ii), as SSB repair results in the formation of a shoulder for the HDR–90Y survival curve. However, as the EBRT dose rate is significantly higher than HDR–90Y RNT (by a factor 400), the rate of lethal SSB production is much higher. Consequently, this results in delivering more lethal damage to cells at an even lower EBRT dose range (compared to 90Y doses). Moreover for LDR–90Y (0.013-0.13 Gy/h), there is even less contribution from the βD2 component since the rate of SSB repair occurs even more rapidly (see Fig. 6a (ii)) than the rate of damage. Simulation results further confirmed that for both of HDR– and LDR–90Y, for smaller delivered activities and doses (i.e. ≲ 3 Gy) the average number of hits per cell nucleus is ≲2. Additionally for doses 3 Gy, although the average number of hits is 2, the number of beta particle hits per cell nucleus decreases and falls below 2 after ≈ 5 days of irradiation. This is also consistent with the calculated Tcrit for each cell lines (i.e. 3–5.5 days). This suggests that for LDR– 90Y only ≈ 1–2 half-lives of delivered dose can potentially cause direct cell nucleus DNA damage.
All three cell lines showed higher sensitivity to EBRT than 90Y. The HT29 and HCT116 cell lines were the most radioresistant and radiosensitive cell lines, respectively. This is also consistent with previous studies [38, 39]. Similar sensitivity for both cell lines was observed for 90Y irradiation results. The α/β ratios for both EBRT and 90Y were derived from Eq. 5. However, several models have been developed to incorporate the effect of DNA repair and the exponentially changing dose rate of RNT [10, 37]. The extended LQ model includes the kinetics of DSB creation, repair, and misrepair to estimate the true fraction of surviving cells in an irradiated cell population (Eqs. 9a and 9b).
| 9a |
| 9b |
where G is the Lea–Catcheside factor and μ is the DNA repair time constant [40]. The first integral represents the physical absorbed dose. The integrand of the second integral over t′ refers to the first SSB of two DSBs required to cause lethal damage. Also, the integral over t refers to the second SSB of remaining of two DSBs to cause the unrepairable lethal damage. The exponential term describes the repair and reduction in 2 SSB → DSB process due to decreasing dose rate. For a constant EBRT dose rate where the dose is delivered acutely and the irradiation time is very short, the G–factor approaches unity and Eq. 9a simplifies to its general form (Eq. 5). This means the rate of SSB → DSB process production is higher than the DNA repair rate, and therefore, the kinetics of DSB creation are negligible.
In comparison to EBRT, the 90Y RNT dose rate is much lower and exponentially decreasing (Eq. 1), so the difference in the kinetics of DSB creation has more impact on cell survival. The G factor can be derived for 90Y radiation using Eqs. 10a, 10b.
| 10a |
| 10b |
For long irradiation times (i.e. T → ∞) the G factor reduces to:
| 11 |
where T and τ are the physical half-life of 90Y and DNA repair half-life, respectively. Since G∞ only depends on the physical half-life of 90Y and the DNA repair half-life, its value for both HDR– and LDR–90Y RNT can be determined using Eq. 11. However, as the DNA repair half-lives for all the three cell lines in our study were not experimentally derived, G∞ for HDR– and LDR–90Y was calculated using Eq. 11 and assuming an average value of τ1/2=1.5 h [11], giving G∞=0.022. Such a relatively small G∞ value for 90Y suggests less contribution from 2 SSB → DSB production (e.g. β D2) as the dose rate is relatively lower compared to EBRT. In comparison, G∞≈1 for EBRT, using an irradiation time ≈ 1.7 min. This is more evident for the LDR–90Y survival curve since for a given dose, the initial dose rate is ≈ 0.013–0.13 Gy/h. This is also consistent with the simulation results. For example, for LDR–90Y, for smaller delivered activities and doses (i.e. ≲ 3 Gy), the average number of hits per cell nucleus is ≲ 2 during the 8 days irradiation time (see Fig. 7a). Therefore, there will be very low probability for 2 SSB → DSB process at this dose rate levels. These results highlight the importance of initial dose rate in radionuclide therapy.
In RNT, dose rate is inversely proportional to the radionuclide half-life for a given total dose. Therefore, a longer half-life radionuclide such as 90Y delivers dose at a relatively lower rate for a fixed total dose. Equation 11 implies that for a similar absorbed dose, radionuclides with a shorter half-life could potentially result in better dose response for RNT. Since radionuclides with shorter half-lives deliver dose at much higher initial rate, the DNA damage process can compete with DNA repair rate and thus result in better dose response.
The G∞ factor was calculated and plotted (see Fig. 9 in Appendix) for a few commonly used isotopes in RNT and emission tomography for comparison. These calculations assume μ to be 0.42 h −1 (ln(0.5)/15 hours). The G∞ factor also plays an important role for high LET radiation. For example 213Bi with a 46 min half-life which decays ≈2% as high LET alpha and ≈98% low energy beta particles, delivers dose at a reasonably high dose rate. Currently 213Bi is the only radionuclide that can deliver dose at a dose rate close to the EBRT dose rate (GEBRT ≈ 1, GBi ≈ 0.7). The ability to deliver a very localised dose at very high dose rate has a significant impact on the RNT [41]. For both EBRT and 90Y, the HT29 and HCT116 cell lines were the most radioresistance and radiosensitive cell lines, respectively. HT-29 cells have the TP53 mutation which may increase the cell resistance to radiation [38]. The α/β derived from the HDR–90Y cell survival curve was larger than that derived from EBRT by a factor of ≈ 8 for all three cell lines. This can be attributed to a relatively lower dose rate of 90Y. Also for each given dose, the total HDR–90Y absorbed dose (6.2–55.5 Gy) was up to six times greater than the EBRT dose (1–9 Gy).
Fig. 9.
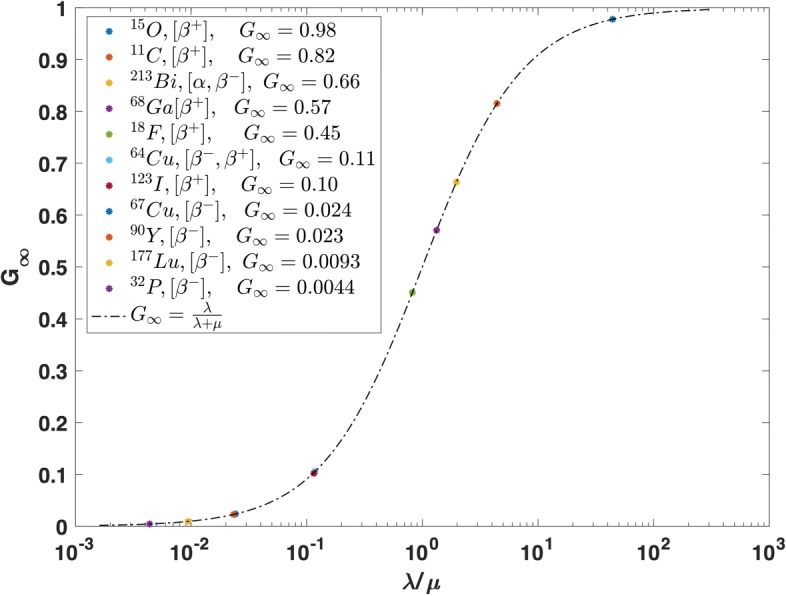
G∞ for common medical isotopes
Additionally, different α and β values derived for HDR–90Y RNT and EBRT reflect on the different relative radiobiological effectiveness of 90Y RNT compared to EBRT.
These results are subject to several assumptions. Firstly, for all the calculations and formalisms, it was assumed that there is no significant cell repopulation during 8 days of incubation. A more complex formulation is required to offset the repopulation effect [10, 42]. Secondly, it was assumed that 90YCl3 was uniformly distributed in the well. This assumption was used to calculate the absorbed dose to cells for each 90YCl3 activity.
Conclusions
We benchmarked the effectiveness of EBRT to 90Y RNT in vitro specific to CRC cell lines. For the HT29 cell line, we found α/β ≈ 31 for HDR–90Y compared to ≈ 3.5 for EBRT. For LDR–90Y, we found insignificant cell death at doses < 10 Gy compared to EBRT. Simulation results also demonstrated that for 90Y doses ≲ 3 Gy, the average number of hits per cell nucleus ≲ 2 indicating insufficient delivered lethal dose. Similarly, for 90Y doses 3 Gy the average number of hits per cell nucleus falls below ≈ 2 after ≈ 5 days of incubation time. Our simulation results also demonstrated that the average number of hits per cell nucleus for EBRT is ≈ 14 times larger than 90Y RNT. Therefore, our results demonstrate that LDR–90Y is radiobiologically less effective than EBRT. However, HDR–90Y at ≈ 56 Gy was shown to be radiobiologically as effective as acute ≈ 8 Gy EBRT. These results demonstrate that the efficacy of RNT is dependent on the initial rate at which dose is delivered. The RNT dose rate is inversely proportional to the radionuclide half-life for a given total dose. Therefore, a longer half-life radionuclide such as 90Y requires a higher initial activity to attain higher initial dose rate, and a larger total dose in Gy delivered is required to achieve a treatment outcome that is equally as effective as EBRT.
Appendix
Acknowledgements
The authors thank the reviewers, whose comments and suggestions helped to improve this article. We gratefully acknowledge the staff from the Department of Nuclear Medicine and Radiation Oncology from the Royal North Shore Hospital and the staff from the Bill Walsh Cancer Laboratory from the Kolling Institute in Sydney for their overall support and kind collaboration.
Funding
This work was funded by the ANSTO/Australian and New Zealand Society of Nuclear Medicine.
Availability of data and materials
The supporting data files can be found in the supplemental material.
Ethical approval and consent to participate
Not applicable.
Authors’ contributions
YHG performed the experiments; developed, built and ran the simulations; analysed the results and drafted the manuscript. DLB, ZK and KPW aided results analysis and revised the manuscript. NJF, RH, NH, RB, HR, SY and VMH helped with the experiments. All authors read and approved the final version of the manuscript.
Competing interests
The authors declare that they have no competing interests.
Publisher’s Note
Springer Nature remains neutral with regard to jurisdictional claims in published maps and institutional affiliations.
References
- 1.Ersahin D, Doddamane I, Cheng D. Targeted Radionuclide Therapy. Cancers (Basel). 2011; 3(4):3838–55. Available from: https://www.ncbi.nlm.nih.gov/pmc/articles/PMC3763399/. [DOI] [PMC free article] [PubMed]
- 2.Murthy R, Kamat P, Nuñez R, Salem R. Radioembolization of Yttrium-90 Microspheres for Hepatic Malignancy. Semin Intervent Radiol. 2008; 25(1):48–57. Available from: http://www.ncbi.nlm.nih.gov/pmc/articles/PMC3036397/. [DOI] [PMC free article] [PubMed]
- 3.Delpassand ES, Samarghandi A, Zamanian S, Wolin EM, Hamiditabar M, Espenan GD, et al. Peptide receptor radionuclide therapy with 177Lu-DOTATATE for patients with somatostatin receptor-expressing neuroendocrine tumors: the first US phase 2 experience. Pancreas. 2014;43(4):518–25. doi: 10.1097/MPA.0000000000000113. [DOI] [PubMed] [Google Scholar]
- 4.Parker C, Nilsson S, Heinrich D, Helle SI, O’Sullivan JM, Fosså SD, et al. Alpha emitter radium-223 and survival in metastatic prostate cancer. N Engl J Med. 2013; 369(3):213–23. Available from: 10.1056/NEJMoa1213755. [DOI] [PubMed]
- 5.Solanki J, Tritt T, Pasternack J, Kim J, Domogauer J, Colangelo N, et al.Cellular response to exponentially increasing and decreasing dose rates. J Nucl Med.2016;57(supplement 2). Available from: http://jnm.snmjournals.org/content/57/supplement_2/1354. [DOI] [PMC free article] [PubMed]
- 6.Zhang L, Chen H, Wang L, Liu T, Yeh J, Lu G, et al.Delivery of therapeutic radioisotopes using nanoparticle platforms: potential benefit in systemic radiation therapy. Nanotechnol Sci Appl. 2010; 3:159–70. Available from: http://www.ncbi.nlm.nih.gov/pmc/articles/PMC3781699/. [DOI] [PMC free article] [PubMed]
- 7.Kassis AI, Adelstein SJ. Radiobiologic principles in radionuclide therapy. J Nucl Med. 2005;46(Suppl 1):4S–12S. [PubMed] [Google Scholar]
- 8.Kumar C, Shetake N, Desai S, Kumar A, Samuel G, Pandey BN. Relevance of radiobiological concepts in radionuclide therapy of cancer. Int J Radiat Biol. 2016;92(4):173–86. doi: 10.3109/09553002.2016.1144944. [DOI] [PubMed] [Google Scholar]
- 9.Paillas S, Ladjohounlou R, Lozza C, Pichard A, Boudousq V, Jarlier M, et al.Localized irradiation of cell membrane by Auger Electrons is cytotoxic through oxidative stress-mediated nontargeted effects. Antioxid Redox Signal. 2016; 25(8):467–84. Available from: http://www.ncbi.nlm.nih.gov/pmc/articles/PMC5028911/. [DOI] [PMC free article] [PubMed]
- 10.Dale RG. Dose-rate effects in targeted radiotherapy. Phys Med Biol. 1996;41(10):1871–84. doi: 10.1088/0031-9155/41/10/001. [DOI] [PubMed] [Google Scholar]
- 11.Dale RG, Jones B. The clinical radiobiology of brachytherapy. Br J Radiol. 1998;71(845):465–83. doi: 10.1259/bjr.71.845.9691890. [DOI] [PubMed] [Google Scholar]
- 12.Gordon Steel G, Deacon JM, Duchesne GM, Horwich A, Kelland LR, Peacock JH. The dose-rate effect in human tumour cells. Radiother Oncol. 1987; 9(4):299–310. Available from: http://www.sciencedirect.com/science/article/pii/S0167814087801512. [DOI] [PubMed]
- 13.Steel GG, Down JD, Peacock JH, Stephens TC. Dose-rate effects and the repair of radiation damage. Radiother Oncol. 1986;5(4):321–31. doi: 10.1016/S0167-8140(86)80181-5. [DOI] [PubMed] [Google Scholar]
- 14.Nath R, Martin DF, Park CH, Rockwell S, Fischer JJ. Development of an 241Am applicator for continuous low-dose-rate irradiation of the rat sarcoma BA1112. Int J Radiat Oncol Biol Phys. 1987; 13(12):1883–92. Available from: http://www.sciencedirect.com/science/article/pii/0360301687903567. [DOI] [PubMed]
- 15.Mazeron JJ, Simon JM, Le Péchoux C, Crook JM, Grimard L, Piedbois P, et al. Effect of dose rate on local control and complications in definitive irradiation of T1-2 squamous cell carcinomas of mobile tongue and floor of mouth with interstitial iridium-192. Radiother Oncol. 1991;21(1):39–47. doi: 10.1016/0167-8140(91)90339-I. [DOI] [PubMed] [Google Scholar]
- 16.Mazeron JJ, Simon JM, Crook J, Calitchi E, Otmezguine Y, Bourgeois JPL, et al.Influence of dose rate on local control of breast carcinoma treated by external beam irradiation plus iridium 192 implant. Int J Radiat Oncol Biol Phys. 1991; 21(5):1173–7.Available from: http://www.redjournal.org/article/0360-3016(91)90273-7/abstract. [DOI] [PubMed]
- 17.White JR, Armour EP, Armin AR, Dewitt CC, Corry PM, Martinez A. Reproducible rat model for comparing late rectal toxicity from different brachytherapy techniques. Int J Radiat Oncol Biol Phys. 1997; 37(5):1155–61. Available from: http://www.sciencedirect.com/science/article/pii/S0360301697001028. [DOI] [PubMed]
- 18.Henschke UK. “Afterloading” applicator for radiation therapy of carcinoma of the uterus. 1960; 74(Radiology):834. [DOI] [PubMed]
- 19.Jan S, Santin G, Strul D, Staelens S, Assié K, Autret D, et al.GATE: a simulation toolkit for PET and SPECT. Phys Med Biol. 2004; 49(19):4543. Available from: http://stacks.iop.org/0031-9155/49/i=19/a=007. [DOI] [PMC free article] [PubMed]
- 20.Agostinelli St. Geant4—a simulation toolkit. Nuclear Instruments and Methods in Physics Research Section A: Accelerators, Spectrometers, Detectors and Associated Equipment. 2003; 506(3):250–303. Available from: http://www.sciencedirect.com/science/article/pii/S0168900203013688.
- 21.Stabin MG, Sparks RB, Crowe E. OLINDA/EXM: the second-generation personal computer software for internal dose assessment in nuclear medicine. J Nucl Med. 2005;46(6):1023–7. [PubMed] [Google Scholar]
- 22.Chauvie S, Guatelli S, Ivanchenko V, Longo F, Mantero A, Mascialino B, et al.Geant4 low energy electromagnetic physics. IEEE Nucl Sci Conf R. 2004; 3:1881–5. https://ieeexplore.ieee.org/document/1462612/.
- 23.Browne E. Nuclear Data Sheets for A = 90. Nucl Data Sheets. 1997; 82(3):379–546. Available from: http://www.sciencedirect.com/science/article/pii/S0090375297900211.
- 24.Tahara M, Inoue T, Miyakura Y, Horie H, Yasuda Y, Fujii H, et al.Cell diameter measurements obtained with a handheld cell counter could be used as a surrogate marker of G2/M arrest and apoptosis in colon cancer cell lines exposed to SN-38. Biochem Biophys Res Commun. 2013; 434(4):753–9. Available from: http://www.sciencedirect.com/science/article/pii/S0006291X13006074. [DOI] [PubMed]
- 25.Kim WH, Chon CY, Moon YM, Kang JK, Park IS, Choi HJ. Effect of anticancer drugs and desferrioxamine in combination with radiation on hepatoma cell lines. Yonsei Med J. 1993;34(1):45–56. doi: 10.3349/ymj.1993.34.1.45. [DOI] [PubMed] [Google Scholar]
- 26.Nuclear Medicine Radiation Dosimetry - Advanced Theoretical \textbar Brian J McParland \textbar Springer. Available from: http://www.springer.com/gp/book/9781848821255. Accessed 28 Oct 2017.
- 27.Buch K, Peters T, Nawroth T, Sänger M, Schmidberger H, Langguth P. Determination of cell survival after irradiation via clonogenic assay versus multiple MTT Assay—a comparative study. Radiation Oncology. 2012; 7:1. Available from: 10.1186/1748-717X-7-1. [DOI] [PMC free article] [PubMed]
- 28.Price P, McMillan TJ. Use of the tetrazolium assay in measuring the response of human tumor cells to ionizing radiation. Cancer Res. 1990; 50(5):1392–6. Available from: http://cancerres.aacrjournals.org/content/50/5/1392. [PubMed]
- 29.Slavotinek A, McMillan TJ, Steel CM. Measurement of radiation survival using the MTT assay. Eur J Cancer. 1994; 30(9):1376–82. Available from: http://www.sciencedirect.com/science/article/pii/0959804994901899. [DOI] [PubMed]
- 30.Sieuwerts AM, Klijn JG, Peters HA, Foekens JA. The MTT tetrazolium salt assay scrutinized: how to use this assay reliably to measure metabolic activity of cell cultures in vitro for the assessment of growth characteristics, IC50-values and cell survival. Eur J Clin Chem Clin Biochem. 1995;33(11):813–23. doi: 10.1515/cclm.1995.33.11.813. [DOI] [PubMed] [Google Scholar]
- 31.Arab-Bafrani Z, Shahbazi-Gahrouei D, Abbasian M, Fesharaki M. Multiple MTS a as the alternative method to determine survival fraction of the irradiated HT-29 colon cancer cells. J Med Signals Sens. 2016;6(2):112–6. [PMC free article] [PubMed] [Google Scholar]
- 32.Ghisolfi L, Keates AC, Hu X, Lee Dk, Li CJ. Ionizing radiation induces stemness in cancer cells. PLoS ONE. 2012; 7(8):e43628. Available from: http://journals.plos.org/plosone/article?id=10.1371/journal.pone.0043628. [DOI] [PMC free article] [PubMed]
- 33.Shoemaker RH, Wolpert-DeFilippes MK, Kern DH, Lieber MM, Makuch RW, Melnick NR, et al. Application of a human tumor colony-forming assay to new drug screening. Cancer Res. 1985;45(5):2145–53. [PubMed] [Google Scholar]
- 34.Weisenthal LM, Lippman ME. Clonogenic and nonclonogenic in vitro chemosensitivity assays. Cancer Treat Rep. 1985;69(6):615–32. [PubMed] [Google Scholar]
- 35.Mirzayans R, Andrais B, Scott A, Tessier A, Murray D. A sensitive assay for the evaluation of cytotoxicity and its pharmacologic modulation in human solid tumor-derived cell lines exposed to cancer-therapeutic agents. J Pharm Pharm Sci. 2007;10(2):298s–311s. [PubMed] [Google Scholar]
- 36.Schmidt-Ullrich RK, Dent P, Grant S, Mikkelsen RB, Valerie K. Signal transduction and cellular radiation responses. Radiat Res. 2000;153(3):245–57. doi: 10.1667/0033-7587(2000)153[0245:STACRR]2.0.CO;2. [DOI] [PubMed] [Google Scholar]
- 37.Dale R, Carabe-Fernandez A. The Radiobiology of conventional radiotherapy and its application to radionuclide therapy. Cancer Biother Radiopharm. 2005; 20(1):47–51. Available from: http://online.liebertpub.com/doi/abs/10.1089/cbr.2005.20.47. [DOI] [PubMed]
- 38.Häggblad Sahlberg S, Spiegelberg D, Lennartsson J, Nygren P, Glimelius B, Stenerlöw B. The effect of a dimeric Affibody molecule (ZEGFR:1907)2 targeting EGFR in combination with radiation in colon cancer cell lines. Int J Oncol. 2012;40(1):176–84. doi: 10.3892/ijo.2011.1177. [DOI] [PubMed] [Google Scholar]
- 39.Dunne AL, Price ME, Mothersill C, McKeown SR, Robson T, Hirst DG. Relationship between clonogenic radiosensitivity, radiation-induced apoptosis and DNA damage/repair in human colon cancer cells. Br J Cancer. 2003;89(12):2277–83. doi: 10.1038/sj.bjc.6601427. [DOI] [PMC free article] [PubMed] [Google Scholar]
- 40.Lea DE, Catcheside DG. The mechanism of the induction by radiation of chromosome aberrations. J Genet. 1942; 44(2–3):216–45. https://link.springer.com/article/10.1007%2FBF02982830.
- 41.Sathekge M, Knoesen O, Meckel M, Modiselle M, Vorster M, Marx S. 213Bi-PSMA-617 targeted alpha-radionuclide therapy in metastatic castration-resistant prostate cancer. Eur J Nucl Med Mol Imaging. 2017; 44(6):1099–100. Available from: http://www.ncbi.nlm.nih.gov/pmc/articles/PMC5397654/. [DOI] [PMC free article] [PubMed]
- 42.Antipas V, Dale RG, Coles IP. A theoretical investigation into the role of tumour radiosensitivity, clonogen repopulation, tumour shrinkage and radionuclide RBE in permanent brachytherapy implants of 125 I and 103 Pd. Phys Med Biol. 2001; 46(10):2557. Available from: http://stacks.iop.org/0031-9155/46/i=10/a=304. [DOI] [PubMed]
- 43.Ahmed D, Eide PW, Eilertsen IA, Danielsen SA, EknÊs M, Hektoen M, et al.Epigenetic and genetic features of 24 colon cancer cell lines. Oncogenesis. 2013; 2:e71. [DOI] [PMC free article] [PubMed]
- 44.Zhu S, Bjorge JD, Fujita DJ. PTP1B contributes to the oncogenic properties of colon cancer cells through Src activation. Cancer Res. 2007;67(21):10129–37. doi: 10.1158/0008-5472.CAN-06-4338. [DOI] [PubMed] [Google Scholar]
Associated Data
This section collects any data citations, data availability statements, or supplementary materials included in this article.
Data Availability Statement
The supporting data files can be found in the supplemental material.


