

Abstract
Scope
Dietary fats have been shown to affect gut microbiota composition and aging gene expression of middle‐aged rats at a normal dose, but little is known about such an effect on gut barrier. In this study, the changes in colonic Muc2 expression are investigated and the underlying mechanism is also proposed.
Methods and results
36 middle‐aged Sprague–Dawley rats are assigned to one of the diets containing soybean oil, lard, or fish oil (4%). The rats are fed for 5 weeks and then goblet cells, Muc2 expression, and inflammatory cytokines in the colon are measured. Proteome analysis is performed. Compared with the lard and soybean oil diet groups, intake of fish oil decreases the number of goblet cells, and inhibits Muc2 and TLRs expression in the colon of middle‐aged rats, which would impair mucus barrier. Several key enzymes involved in glycosylation process, including Agr2, Gale, Gne, Pmm2, Pdxdc1, Plch1, Pfkp, Cmpk1, and Rexo2, show the lowest abundance in the fish oil diet group.
Conclusion
Intake of fish oil at a normal dose downregulates colonic Muc2 expression. This negative effect of fish oil may involve the suppression of mucin glycosylation process.
Keywords: colon, dietary fats, goblet cells, Muc2, proteome
1. Introduction
Fat is a food component that comprises of essential fatty acids and phospholipids.1 Different sources of fats have substantially distinct composition of fatty acids. Lard mainly comprises of saturated fatty acids (SFAs), while soybean oil is rich in linolenic acid, a kind of n‐6 PUFAs.2 Fish oil contains high levels of n‐3 highly PUFAs, in particular to eicosapentaenoic acid (EPA) and docosahexaenoic acid (DHA).3 In recent years, the associations between fat intake and human health have been widely concerned. On one hand, high‐fat diet may induce metabolic disorders, including obesity, diabetes, and inflammation.4, 5, 6, 7 On the other hand, different dietary fats have distinct effects on gut bacteria composition, liver metabolism, and phenotypes.8, 9, 10 Such a difference could be mainly attributed to the difference in fatty acid composition in diets.11, 12, 13 The intake of SFAs is more likely to impair gut barrier function, and cause adipocyte hyperplasia, obesity, and inflammation.14, 15 The n‐3 PUFAs have an antioxidative activity and may decrease inflammatory response, however, the oxidation of n‐6 PUFAs may induce DNA oxidative breaks and proinflammation.16 Due to the special fatty acid composition, supplemental and therapeutic uses of fish oil have been widely concerned. Itariu et al. has indicated that omega‐3 fatty acids in fish oil played a role in preventing and treating many health conditions,17 however Duriancik et al. showed an opposite result.18 Recent studies indicated that the impacts of fish oil diet could be tissue‐specific. At a normal dose (4%), the intake of fish oil significantly decreased the level of fat accumulation, oxidative stress, and inflammatory cytokines in the liver but increased the abundance of phylum Proteobacteria and genus Desulfovibrio as well as the inflammatory cytokines in the colon.9, 19
The gastrointestinal tract is not only an entry for nutrients from the lumen to different organs, but also a barrier for the host to prevent pathogenic attack.20 On the gut tissue, there are two mucus layers that have different properties and functions. The outer loose mucus layer is a habitat of bacteria, while the inner firmly attached mucus layer is impervious to bacteria.21, 22, 23 The major components of mucus are mucins, which are heavily O‐glycosylated glycoproteins and have the function to protect the epithelial surface of the intestine from the attack of luminal digestive enzymes, abrasion of food particles, and pathogens.24 During biosynthesis, the mucin monomers are dimerized in the ER via its cysteine‐rich C‐termini, heavily O‐glycosylated in the Golgi, and polymerized via the N‐termini by disulfide bond trimerization.25 There are tens of mucins specific for tissues, of which Muc2 is the most abundant in human and rat colons. Muc2 is critical for colonic protection and Muc2‐deficient mice were shown to spontaneously develop colitis.26 Although Muc2 plays a critical role in the colon, little is known about how it responds to dietary fats at a normal dose (4%).
This study was to investigate how intake of soybean oil, lard, and fish oil affected the goblet cells and Muc2 expression in the colon of middle‐aged rats. The overall colonic proteome analysis was performed by using tandem mass tags (TMT) label proteome technology to reveal the possible molecular mechanisms.
2. Experimental Section
2.1. Animals and Diets
Thirty‐six male Sprague–Dawley rats (12 months old) were bought from a commercial experimental animal center (Sichuan, China) and housed individually in a specific pathogen‐free animal center (SYXK <Jiangsu> 2011‐0037). All animal experimental protocols were approved by the Animal Care Committee of Nanjing Agricultural University. After 7 days acclimatization, the rats were randomly assigned to one of three different diets groups (n = 12 per group), i.e., soybean oil, lard, or fish oil. The rats were subjected to a 12 h light–dark cycle in low‐stress conditions (21 ± 1 °C, 50–60% humidity and low noise) with access to diet and water ad libitum for 5 weeks. The diet and water were replaced every 2 days. Body weight was measured once a week at fixed time (between 15:00 and 16:00).
Animal diets were formulated by Trophic Animal Feed High‐Tech Co., Ltd (Nantong, China), according to the recommendation of the American Institute of Nutrition for middle‐aged rats (AIN‐93M).27 Briefly, the formulations comprised of 4% soybean oil, pork lard, or fish oil, 14.0% protein, 46.6% cornstarch, 15.5% dextrinized cornstarch, 10.0% sucrose, 5.0% fiber, 3.5% mineral mix (AIN‐93‐M), 1.0% vitamin mix (AIN‐93‐VX), 0.2% L‐cystine, 0.3% choline bitartrate, and 0.0008% tert‐butylhydroquinone.9 Soybean oil was bought from Shanghai Jiali Oil Industry Co. Ltd (Shanghai, China). Pork lard was obtained from Tianjin Lihongde Fat Products Inc. (Tianjin, China) and fish oil was bought from Rongcheng Ayers Ocean Bio‐technology Co, Ltd (Weihai, China). The diets were vacuum packaged, stored at −20 °C, and allowed to reach room temperature before being served.
2.2. Sample Collection
All rats were euthanized by cervical dislocation after 5‐week feeding. Blood and colon tissue samples were collected. Blood was centrifuged at 3000 × g for 15 min and the serum was stored at –20 °C. Colon tissue was either fixed in 4% (w/v) paraformaldehyde in PBS or frozen in liquid nitrogen and stored at –80 °C.
2.3. Histological Analysis
After fixation overnight, 0.5 cm cubes of colon were embedded in paraffin and 5 μm sections were cut. The sections were stained with Alcian blue‐periodic acid‐Schiff as previously described.28 Mucosal thickness, crypt depth, and goblet cells were measured by analyzing ten crypts per section and three tissue samples from each animal.
2.4. Real‐Time‐Quantitative PCR
Total RNA was isolated from the colonic tissues by using the MiniBEST Universal RNA Extraction Kit (TaKaRa, Ostu, Japan), and 1.5 μg RNA was used to prepare cDNA by using the PrimeScript RT Master Mix (TaKaRa, Ostu, Japan) following the manufacturer's protocols. Quantitative real‐time PCR (RT‐qPCR) was performed by the SYBR Green probe (QuantStudio 6 Flex, Applied Biosystems, Foster, CA). Each cDNA sample was added into four wells. The cycling conditions were as follows: initial denaturation at 95 °C for 2 min, and then 40 amplification cycles of 95 °C for 10 s and 60 °C for 30 s. Relative gene expression was analyzed with 2−ΔΔCt method.29 The mRNA level in the test samples was normalized relative to GAPDH and calculated as fold (2−ΔΔCt) in which the soybean oil group was set as control. The target primers were listed in Table 1 (Sangon Biotech).
Table 1.
Primer sequences for Muc2, inflammation cytokines, and TLRs
| Gene | Forward Primer | Reverse Primer |
|---|---|---|
| GAPDH | GGCAAGTTCAACGGCACAG | CGCCAGTAGACTCCACGACAT |
| Muc2 | CTCCCAAGCACTACTACGA | GCACAGAGGGCAGCAT |
| TLR2 | CTCCTGTGAACTCCTGTCCTT | AGCTGTCTGGCCAGTCAAC |
| TLR4 | CCCTCATGACATCCCTTATTCA | CTGTCAGTACCAAGGTTGAGAGC |
| MyD88 | GGACTGGGAAACTCGTCCAG | CTCCTGTGTTCGAGGTCCAC |
| IL‐1β | AAAAATGCCTCGTGCTGTCT | TCGTTGCTTGTCTCTCCTTG |
| IL‐6 | CCAGTTGCCTTCTTGGGACT | GGTCTGTTGTGGGTGGTATCC |
| IL‐10 | GAGAGCGCTCATCTCGATTT | GGGTCTCCCAAGGAAAGGTA |
| IL‐12 | ATCAGGGACATCATCAAACCG | ACGCACCTTTCTGGTTACACTC |
| TNF‐α | TGATCGGTCCCAACAAGGA | TGCTTGGTGGTTTGCTACGA |
| TGF‐β | AGCCCTGTATTCCGTCTCCT | ATTCCTGGCGTTACCTTGG |
| NF‐κB | TGATGACATACTCCCACAAG | CAATATCCCCAGACCTAAC |
2.5. Western Blotting
Colon tissue samples were homogenized in RIPA buffer that contained protease and phosphatase inhibitors (Roche Applied Science, Penzberg, Germany). After centrifugation at 13000 × g for 15 min, protein concentration in the supernatant was quantified with the bicinchoninic acid protein assay (Thermo Scientific). Protein samples (45 μg) were loaded on 4–12% SDS‐PAGE gels. Electrophoresis was run at 120 V for 2 h at 4 °C (Bio‐Rad Mini‐Protean) and western blotting was performed with primary antibodies against Muc2 (1:4000; Abcam, Cambridge, UK) and β‐actin (1:3000; Bioworld, Nanjing, China). The intensity of target protein Muc2 was normalized against β‐actin.
2.6. TMT Label Proteome
Colonic proteins were extracted with lysis buffer I (7 m urea, 2 m thiourea, 4% CHAPS, 40 mm Tris‐HCl, pH 8.5) that contained protease and phosphatase inhibitors (Roche Applied Science, Penzberg, Germany). The proteins were reduced, alkylated, and digested by trypsin.30 Six 6‐plex TMT (Thermo St, Los Angeles, CA, USA) analyses were performed and the protein samples were labeled with tags 126, 127, 128, 129, 130, and 131, individually. In brief, a common reference sample was prepared by pooling protein samples from all three groups, used for independent labeling with mass 131 and randomly assigned to six replicates. The colon tissue samples from the soybean oil, pork lard, and fish oil groups were labeled with tags 126, 127, 128, 129, and 130, respectively. Labeled control and diet‐specific samples were equivalently combined before sample fractionation. Combined samples were analyzed by high‐resolution Orbitrap LC–MS/MS to identify peptides and quantify reporter ions.
Raw data were analyzed by the Proteome Discoverer Software (version: 1.4, Thermo Fisher Scientific, Waltham, MA, USA). Protein identification was performed using Sequest HT engine against the UniprotKB Rattus norvegicus database (http://www.uniprot.org/uniprot/, Accessed on 14 Oct 2016). Pathway analysis was performed by using the OmicsBean (http://www.omicsbean.cn), which integrated Gene Ontology (GO) enrichment, Kyoto Encyclopedia of Genes and Genomes pathway analysis.
2.7. Statistical Analysis
The diet effect was evaluated by the factorial analysis of variance. Means were compared by the Duncan's multiple comparison under the SAS system (version 9.2). The significance level was set smaller than 0.05 for all statistical analyses.
3. Results
3.1. Dietary Fats Affected the Development of Colon Tissue
Alcian blue‐periodic acid‐Schiff staining showed diet‐induced changes in the colonic morphology (Figure 1). Compared to the soybean oil diet group, the fish‐oil‐fed rats had a significant decrease in mucosal thickness and crypt depth, and fewer goblet cells (p < 0.05). The lard diet showed a similar phenomenon but only the crypt depth was significant (p < 0.05).
Figure 1.
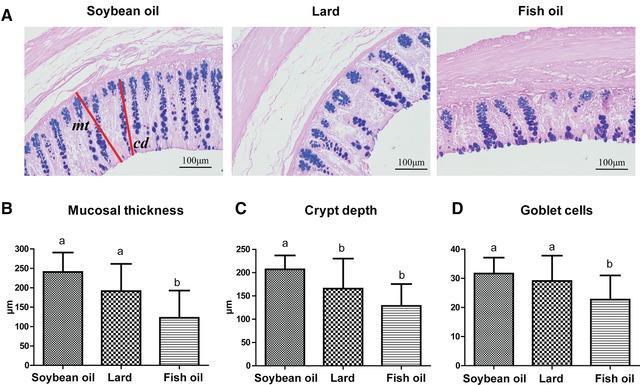
Effect of dietary fats on colonic histology. A) Alcian blue‐periodic acid‐Schiff staining images (magnification, ×200); B) mucosal thickness (mt); C) crypt depth (cd); and D) goblet cells. a, b, means with different letters differed significantly (p < 0.05). Error bars indicated the SDs. For each biological tissue, the parameters were averaged by three sections and ten crypts per section. Biological replicates n = 12 for each group.
3.2. Muc2 Content, Toll‐Like Receptors, and Inflammatory Cytokines in the Colon Varied with Dietary Fats
The RT‐qPCR and western blotting revealed the Muc2 difference among diet groups (Figure 2). The RT‐qPCR showed lower abundance of Muc2 mRNA in both lard‐fed and fish‐oil‐fed rats than those of the soybean‐oil‐fed rats (p < 0.05, Figure 2A). Western blotting indicated that the fish‐oil‐fed rats had the lowest abundance of Muc2 protein (p < 0.05, Figure 2B), but there was no significant difference between lard‐fed and soybean‐oil‐fed rats. Taken together, the fish oil exhibited an inhibiting effect on Muc2 on both transcriptional and translational levels, while lard showed such an effect only on the transcriptional level.
Figure 2.
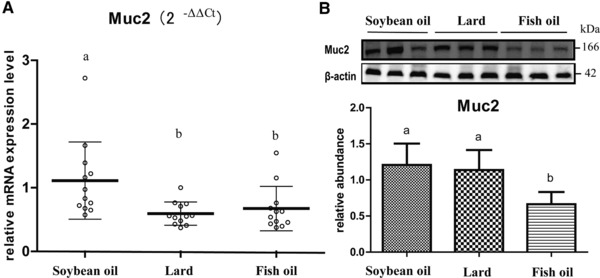
Effect of dietary fats on Muc2 expression in rat colon. A) Muc2 mRNA level that was quantified by RT‐qPCR, normalized to the housekeeping gene GAPDH and calculated as fold changes (2−ΔΔCt) in which the soybean oil group was set as control. B) Relative abundance of Muc2 protein that was quantified by western blotting and normalized to β‐actin. a, b, means with different letters differed significantly (p < 0.05). Error bars indicate the SDs. Biological replicates n = 12 for each group.
The RT‐qPCR also revealed diet‐induced changes of the main cell‐surface toll‐like receptors (TLRs), i.e., TLR2, TLR4, and TLR adaptor protein myeloid differentiation factor (MyD88) (Figure 3). The TLR2 mRNA level did not differ among the three groups (p > 0.05, Figure 3A), while TLR4 and MyD88 were downregulated in both lard‐fed and fish‐oil‐fed rats as compared to the soybean oil diet group, with the lowest for the fish‐oil‐fed rats (Figure 3B and C). This indicated that both fish oil and lard had a negative impact on the TLRs in the colon.
Figure 3.
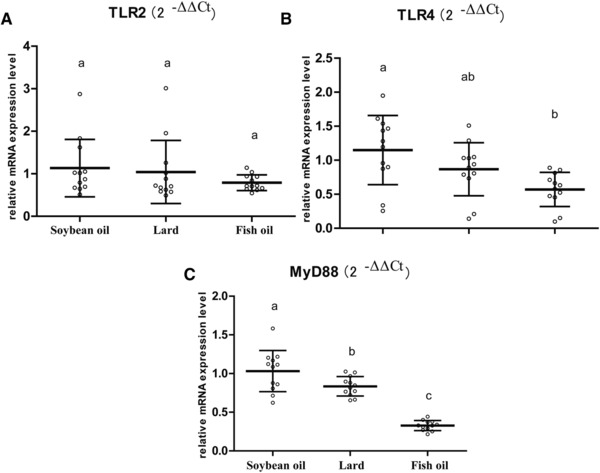
Effect of dietary fats on TLRs expression in rat colon. A) TLR2 mRNA level; B) TLR4 mRNA level; and C) MyD88 mRNA level. The mRNA levels of target genes were quantified by RT‐qPCR, normalized to the housekeeping gene GAPDH, and calculated as fold changes (2−ΔΔCt) in which the soybean oil group was set as control. a, b, c, means with different letters differed significantly (p < 0.05). Error bars indicate SDs. Biological replicates n = 12 for each group.
Our previous study showed that intake of fish oil for 3 months induced a higher level of inflammation in the colon.9 However, the present study did not show significant differences in IL‐1β, IL‐6, IL‐10, IL‐12, NF‐κB, TNF‐α, and TGF‐β mRNA levels (p > 0.05, Figure 4A–G). It indicated that inflammation is a complex process of gradually developing pathology.
Figure 4.
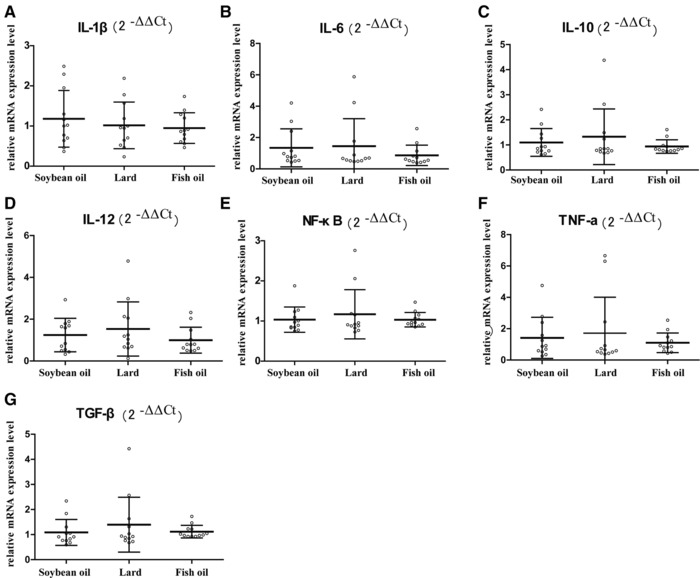
mRNA levels of inflammatory factors in rat colon. A) IL‐1β, B) IL‐6, C) IL‐10, D) IL‐12, E) NF‐κB, F) TNF‐α, and G) TGF‐β mRNA data were quantified by RT‐qPCR, normalized to the housekeeping gene GAPDH, and calculated as fold changes (2−ΔΔCt) in which the soybean oil group was set as control. Error bars indicated the standard deviations. Biological replicates n = 12 for each group.
3.3. Dietary Fats Effect Could be Associated with Glycosylation Process
As shown above, the intake of fish oil induced a substantial change in the goblet cell number, Muc2 level, and TLRs abundance in the colon of middle‐aged rats. To further explore the underlying molecular mechanisms, TMT label proteome analysis was performed. A total of 3907 proteins were identified, of which 2438 proteins (62.4%) were matched with at least two unique peptides (Supporting Information file 1). Difference was expressed by fold changes and a p‐value cutoff, which addressed the reduction in quantitative accuracy from precursor interference associated with TMT labeling.31, 32 The fold change of protein abundance ratio greater than 1.2 and p‐value smaller than 0.05 indicated a significant difference.
Fifty‐nine proteins were observed different in abundance between the lard and fish oil groups, of which 25 proteins were highly abundant in the fish oil group and 34 proteins were highly expressed in the lard group (Supporting Information file 2). Twenty‐eight proteins showed different abundances between the soybean oil and fish oil groups, with 13 proteins highly abundant in the fish oil group and 15 proteins higher in the soybean oil group (Figure 5A, B; Supporting Information file 3).
Figure 5.
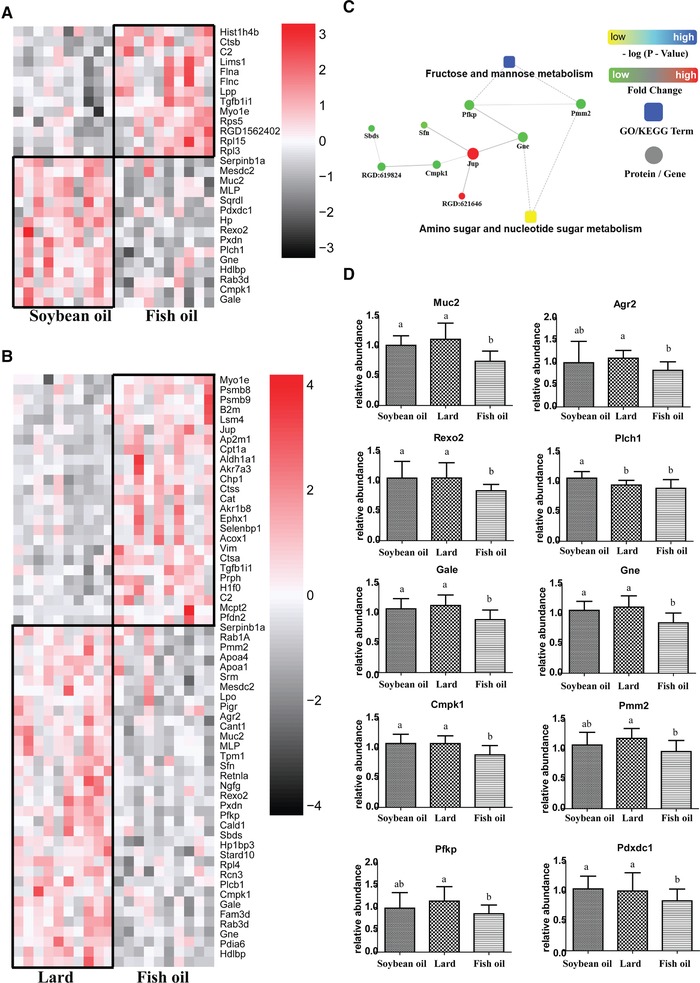
Diet‐induced change of colonic proteome. A) A heatmap of differentially expressed proteins in colonic tissues of soybean‐oil‐fed and fish‐oil‐fed middle‐aged rats. B) A heatmap of differentially expressed proteins in colonic tissues of lard‐fed and fish‐oil‐fed middle‐aged rats. C) A protein–protein interaction of differentially expressed proteins involved in glycosylation. D) Comparisons of Muc2, Agr2, Rexo2, Plch1, Gale, Gne, Cmpk1, Pmm2, Pdxdc1, and Pfkp expression among three groups. a, b, means with different letters differed significantly (p < 0.05). Error bars indicated the SDs. Biological replicates n = 10 for each group.
Kyoto Encyclopedia of Genes and Genomes analysis of differentially expressed proteins revealed 13 differentially enriched pathways, of which fructose/mannose metabolism and amino sugar/nucleotide sugar metabolism were thought to be closely related to glycosylation (Figure 5C). The Muc2 abundance was observed the lowest in the fish‐oil‐fed rats (Figure 5D), which was consistent with the western blotting result. The fish oil group had the lowest abundance of Agr2, Gale, Gne, Pmm2, Pdxdc1, Plch1, Pfkp, Cmpk1, and Rexo2, which are the key enzymes involved in glycosylation process. And thus, fish oil diet decreased colonic Muc2 expression probably by limiting the glycosylation process. In addition, the other differentially abundant proteins, i.e., Apoa1, Apoa4, and Cpt1a, were mainly involved in lipid metabolism. However, the associations between these proteins and Muc2 are still unknown.
3.4. Feed Intake and Body Weight of Middle‐Aged Rats Varied with Dietary Fats
Feed intake and body weight of middle‐aged rats were also measured (Table 2). No significant difference was observed in body weight between any two groups on day 0. After 5‐week feeding, fish‐oil‐fed rats showed the highest daily feed intake and the lowest body weight gain. This indicated that fish oil did work well to reduce body weight to a certain degree. The lard‐fed rats had higher body weight gain and lower feed intake than the fish‐oil‐fed rats (p < 0.05), but showed no significant difference with soybean‐oil‐fed rats (p > 0.05).
Table 2.
Feed intake and body weight of middle‐aged rats after feeding for 5 weeks
| Items | Soybean oil | Lard | Fish oil |
|---|---|---|---|
| Initial body weight (g) | 631.17 ± 41.31a) | 628.92 ± 39.30a) | 628.08 ± 38.35a) |
| Average daily feed intake (g) | 26.25 ± 2.39b) | 27.56 ± 2.55a) , b) | 30.72 ± 4.79a) |
| Body weight gain (g) | 90.25 ± 29.22a) , b) | 103.63 ± 18.49a) | 80.23 ± 25.20b) |
The numerical values were the means and the SDs.
a,b) means with different superscripts differed significantly (p < 0.05). Biological replicates n = 12 for each group.
4. Discussion
Dietary fat has been widely concerned because its composition has more or less associations with health. Fish oil is rich in the omega‐3 fatty acids, including EPA and DHA, and known to have several biological functions.33 Intake of lard is usually associated with the risk to overweight, obesity, diabetes, dyslipidemia, and other chronic diseases.34, 35 However, recent studies have mainly concerned the association between high‐fat diet and gut microbiota and metabolic disorders,4, 6, 36 but few studies focused on the normal intake of dietary fats. A previous study indicated that, at a normal dose (4%), the fish oil diet group induced higher abundances of Desulfovibrionaceae and Bilophila in the colon, which could impair intestinal barrier function and finally increase the risk of inflammation.9 This study further confirmed the potential negative effect of fish oil on gut barrier.
The intestinal mucus layer has functions to lubricate the epithelial surface, to protect from potential luminal insults, and to participate in nutrient transport. In the colon, the main component of mucus layer is Muc2. Colonic Muc2 is mainly produced and secreted by the goblet cells that are derived from multipotent stem cells. In the colon, the majority of multipotent stem cells exist at the bottom of the crypts and the remainder are scattered through the intestinal crypt.37 And thus the reduction in crypt length in the fish oil diet group may indicate fewer multipotent stem cells existing in the colon, and in consequence with a smaller number of goblet cells. In addition, the goblet cells and the secretion of mucins were suggested to be modulated by the gut microbiota, and innate and adaptive immunity to keep a state of dynamic balance.38 Mucins could be packaged into granules prior to secretion. The mucins would be secreted if goblet cells received a stimulus. The breakdown of intestinal Muc2 can be associated with an increased permeability in rats.39 Muc2 knockout mice had a diminished mucus barrier, and increased the risk to inflammation, diarrhea, bleeding, and rectal prolapse, which would further induce tumor development at elderly ages.40 Therefore, the changes in colonic crypt and goblet cells may have a critical impact on Muc2 production, and the Muc2 abundance indirectly reflect the diet effect on colonic barrier. As compared to the soybean‐oil‐fed rats, the fish‐oil‐fed rats showed lower abundance of Muc2 expression at both transcriptional and translational levels, reduced crypt depth, and smaller number of goblet cells, which indicated that intake of fish oil could have an adverse effect on the colonic barrier. Duriancik et al. also showed that dietary fish oil caused colon inflammation and impaired mucus layer integrity.18
Colonic goblet cells have TLRs that are known as key signaling pathways for mucosal homeostasis.41, 42, 43, 44, 45 TLRs signaling in the colonic epithelium regulates the normal differentiation of the epithelium and is required for goblet cell proliferation and Muc2 secretion. Birchenough et al. found that the Muc2 secretion was reduced in colonic explants from Tlr2−/−, Tlr4−/−, MyD88−/−, Trif −/−, and Rag1−/− mice when compared to wild‐type mice, and colonic goblet cells exposed to high concentrations of TLRs (mainly TLR2, TLR4, TLR5, and MyD88) stimulated Muc2 secretion ex vivo.44 In the present study, intake of fish oil significantly weakened TLRs signaling pathway with a significant decrease in TLR4 and MyD88 abundances. This could be a compensatory mechanism in fish‐oil‐fed mice with reduced mucus barriers to maintain homeostasis and reduce inflammatory response to microbiome.
Proteome analysis showed the lowest abundance of Agr2 and Pdxdc1, Pfkp, Plch1, Gale, Gne, Cmpk1, Pmm2, and Rexo2 in the fish oil diet group, which can be involved in the glycosylation process. Mucins are high‐molecular‐weight glycoproteins characterized by serine, threonine, and proline‐rich domains, which are the sites of glycosylation with oligosaccharides.37 N‐glycosylation and C‐terminal dimerization occur in the ER, while O‐glycosylation and N‐terminal multimerization of the dimmers occur in the Golgi. Agr2 is one family member of protein disulfide isomerases and exists in the ER of intestinal secretory epithelial cells. A cysteine residue within the Agr2 thioredoxin‐like domain can react with Muc2 to form disulfide bonds, and the Agr2‐deficient mice were found to lack intestinal mucus and Muc2, indicating a critical role of Agr2 in colonic Muc2 formation.46 The oligosaccharide side chains of Muc2 are formed by five sugars: fucose, galactose (Gal), N‐acetylgalactosamine (GalNAc), N‐acetylglucosamine, and sialic acid (SA).25, 37 The cellular levels of UDP, CDP, and GDP‐activated sugar substrates and the expression levels of glycosyl‐transferases determine the heterogeneity of glycosylation.47 Therefore, the involved enzymes and proteins play an important role in the production and secretion of Muc2. UDP‐glucose 4‐epimerase (Gale) catalyzes the reversible epimerization of UDP‐glucose to UDP‐ galactose and UDP‐N‐acetylglucosamine to UDP‐GalNAc. It contributes to the catabolism of dietary galactose and enables the endogenous biosynthesis of both UDP‐ galactose and UDP‐GalNAc, which would be coupled with the hydroxyl groups of serine or threonine in the Muc2.48 UDP‐N‐acetylglucosamine 2‐epimerase (Gne) is a kinase that regulates and initiates biosynthesis of N‐acetylneuraminic acid, a precursor of SA. SA is not only the sugar to form the oligosaccharide side chains of Muc2, but also critical for bacteria binding and masking bacterial binding sites.49 Phosphomannomutase 2 (Pmm2) is involved in the synthesis of the GDP‐mannose and dolichol‐phosphate‐mannose, playing an important role in protein glycosylation. The most common disorder of glycosylation is caused by mutations in Pmm2 that limits availability of mannose precursors required for protein glycosylation.50 Pyridoxal‐dependent decarboxylase domain‐containing protein (Pdxdc1) is involved in the catalysis of the nonhydrolytic addition or removal of a carboxyl group to or from a compound. The free carboxyl group of aspartic acid or glutamate is a cross point to form the glycosidic bond and the glycopeptide bond. Braun et al. also mentioned that such enzyme could promote mucin expression.51 Phosphoinositide phospholipase C (Plch1) is an enzyme that cleaves phosphatidylinositol 4,5‐bisphosphate to generate inositol 1,4,5‐trisphosphate and diacylglycerol. The hydrophilic segment of inositol 1,4,5‐trisphosphate includes two consensus sites for glycosylation.52 The ATP‐dependent 6‐phosphofructokinase (Pfkp) catalyzes the phosphorylation of d‐fructose 6‐phosphate to fructose 1,6‐bisphosphate, which is the first limiting step of glycolysis. UMP‐CMP kinase (Cmpk1) catalyzes the phosphorylation of pyrimidine nucleoside monophosphates at the expense of ATP. The 3'–5' exoribonuclease (Rexo2) is specific for small oligoribonucleotides. Pmm2, Pfkp, Cmpk1, and Rexo2 are the key enzymes of glycolysis, in which glucose is initially converted to glucose‐6‐phosphate and a portion of the glucose‐6‐phosphate is then metabolized via the pentose phosphate pathway. This leads to production of nucleotides, including uridine triphosphate, guanosine triphosphate, and cytidine triphosphate, which are structural components of diverse nucleotide sugars, such as UDP‐N‐acetylglucosamine and UDP‐GalNAc.53 Taken together, these enzymes (Gale, Gne, Pmm2, Pdxdc1, Plch1, Pfkp, Cmpk1, and Rexo2) play a positive role in the production and secretion of Muc2 via regulating the biosynthesis of five sugars to form the oligosaccharide side chains. As a result, the changes of Arg2 and the above enzymes may directly affect the Muc2 production. In the present study, intake of fish oil downregulated the expression of Arg2 and those enzymes involved in Muc2 glycosylation, and consequently Muc2 was the least abundant in the fish‐oil‐diet‐fed rats. However, no significant difference was observed between the lard and soybean oil diet groups. The reduced level of enzymes could be attributed to the fewer goblet cells.
The fish‐oil‐fed rats had higher daily feed intake but lower body weight gain as compared to the soybean oil diet group. In our previous study, soybean oil was observed to have high levels of n‐6 PUFAs (53.67%) but fish oil had high levels of n‐3 PUFAs (15.79% in EPA and 12.28% in DHA), while lard is largely composed of SFAs and MUFAs (43.59% and 39.99%).19 Intake of long‐chain SFAs may increase lipid deposition, while MUFAs or PUFAs would inhibit lipid deposition.19 Such an effect could be dependent upon the fatty acid β‐oxidation, mRNA fatty acid synthase, and sterol regulatory element binding protein‐1c expression.54 Although the changes in body weight gain and feed intake, no significant difference was observed in inflammatory cytokines in the present study. However, our previous data showed that a 3‐month feeding of the same diets did induce significant changes in inflammatory cytokines, and the fish‐oil‐diet‐fed rats had the highest values.9 This could be because inflammation is a complex process of gradually developing pathology.
Although lard has been widely discouraged because it is rich in SFAs,4, 6, 36 the present study indicated that few variables were significantly different between the soybean oil and lard diet group. And thus, lard was not as bad as we imaged at a normal dose.
The interaction between gut microbiota and gut barrier should also be considered, as the bacteria can use glycans as nutrient sources and attachment sites.37 Our previous study showed that the gut microbiota structure in the fish oil group was substantially different from those of the soybean oil and lard groups in both in vitro and in vivo studies. The fish oil group had the highest relative abundances of phylum Proteobacteria and genus Desulfovibrio in the colonic contents.9 The metabolites of these gut microbiota may break the metabolic balance and cause endotoxemia, which would increase pathogen adhesion to intestinal wall, impair intestinal barrier function, and finally increase the risk to inflammation.37
In conclusion, the intake of fish oil at a normal dose (4% fat in diet) induced distinct changes in Muc2 expression, goblet cell number, and TLRs expression in the colon of middle‐aged rats, which reflected the change in colonic mucus barrier. This negative effect of fish oil could be associated with the suppression of Muc2 glycosylation process. Further studies are needed on cell model and gene knockout mice to confirm the consequences of diet‐induced changes in colonic mucosal barrier.
Abbreviations
- DHA
docosahexaenoic acid
- EPA
eicosapentaenoic acid
- Gal
galactose
- GalNAc
N‐acetylgalactosamine
- MyD88
TLR adaptor protein myeloid differentiation factor
- RT‐qPCR
quantitative real‐time polymerase chain reaction
- SA
sialic acid
- SFAs
saturated fatty acids
- TLR
toll‐like receptor
- TMT
tandem mass tags
Conflict of Interest
The authors have declared no conflict of interest.
Supporting information
Additional file 1: The information of identified total proteins by LC‐MS/MS. (XLS 3.19 MB)
Additional file 2: The different abundant colonic proteins between soybean oil and fish oil groups. (XLS 37.0 KB)
Additional file 3: The different abundant colonic proteins between Lard and fish oil groups. (XLS 55.5 KB)
Acknowledgments
The authors are justifiably credited with authorship, according to the authorship criteria. In details: C.L., G.Z., X.X., and Y.M. conceived the experiments; Y.M., Y.L., Y.Z., X.Y., F.Z., and H.L. conducted research; Y.M. and C.L. acquired and analyzed all raw data. C.L. gave critical revision of this manuscript. All authors reviewed the manuscript.
The authors would like to thank Chen Dai, Xuebin Shi, Jing He, Chao Wang, Chong Wang, Xiaoyu Zou, Min Zhang, Yunting Xie, Xinyue Liu, Qi An from Nanjing Agricultural University for their help during animal feeding and sampling. This work was financially supported by the National Natural Science Foundation (31530054, 34171600), Jiangsu Province (PAPD) and the Ministry of Agriculture (CARS‐35).
The proteomic data have been deposited to the ProteomeXchange Consortium (http://proteomecentral.proteomexchange.org) via the PRIDE55 partner repository with the data set identifier PXD007229. The copyright line for this article was changed on 17 August 2018 after original online publication.
Ma Y., Zhou G., Li Y., Zhu Y., Yu X., Zhao F., Li H., Xu X., Li C., Mol. Nutr. Food Res. 2018, 62, 1700661 10.1002/mnfr.201700661
References
- 1. Hernandez E. M., Kamal‐Eldin A. (Ed), Nutrigenomics and Lipids in the Human Diet, John Wiley & Sons, Manhattan: 2013, pp. 175–189. [Google Scholar]
- 2. Rohman A., Triyana K., Sismindari S., Erwanto Y., Int. Food Res. J. 2012, 19, 475. [Google Scholar]
- 3. Tsuduki T., Honma T., Nakagawa K., Ikeda I., Miyazawa T., Nutrition 2011, 27, 334. [DOI] [PubMed] [Google Scholar]
- 4. Buettner R., Scholmerich J., Bollheimer L. C., Obesity 2007, 15, 798. [DOI] [PubMed] [Google Scholar]
- 5. Martinez‐Fernandez L., Laiglesia L. M., Huerta A. E., Martinez J. A., Moreno‐Aliaga M. J., Prostaglandins Other Lipid Mediat. 2015, 121, 24. [DOI] [PubMed] [Google Scholar]
- 6. Asakawa H., Tokunaga K., Kawakami F., Diabetes Res. Clin. Pract. 2002, 55, 139. [DOI] [PubMed] [Google Scholar]
- 7. Lam Y. Y., Mitchell A. J., Holmes A. J., Denyer G. S., Gummesson A., Caterson I. D., Hunt N. H., Storlien L. H., Obesity 2011, 19, 2113. [DOI] [PubMed] [Google Scholar]
- 8. Caesar R., Tremaroli V., Kovatcheva‐Datchary P., Cani P. D., Backhed F., Cell Metab. 2015, 22, 658. [DOI] [PMC free article] [PubMed] [Google Scholar]
- 9. Li H., Zhu Y., Zhao F., Song S., Li Y., Xu X., Zhou G., Li C., Sci. Rep. 2017, 7, 826. [DOI] [PMC free article] [PubMed] [Google Scholar]
- 10. Carbonero F., Benefiel A. C., Alizadeh‐Ghamsari A. H., Gaskins H. R., Front. Physiol. 2012, 3, 448. [DOI] [PMC free article] [PubMed] [Google Scholar]
- 11. Rios‐Covian D., Ruas‐Madiedo P., Margolles A., Gueimonde M., de Los Reyes‐Gavilán C. G., Salazar N., Front. Microbiol. 2016, 7, 185. [DOI] [PMC free article] [PubMed] [Google Scholar]
- 12. den Besten G., van Eunen K., Groen A. K., Venema K., Reijngoud D. J., Bakker B. M., J. Lipid Res. 2013, 54, 2325. [DOI] [PMC free article] [PubMed] [Google Scholar]
- 13. Dewulf E. M., Cani P. D., Neyrinck A. M., Possemiers S., Holle A. V., Muccioli G. G., Deldicque L., Bindels L. B., Pachikian B. D., Sohet F. M., Mignolet E., Francaux M., Larondelle Y., Delzennea N. M., J. Nutr. Biochem. 2011, 22, 712. [DOI] [PubMed] [Google Scholar]
- 14. Cani P. D., Bibiloni R., Knauf C., Waget A., Neyrinck A. M., Delzenne N. M., Burcelin R., Diabetes 2008, 57, 1470. [DOI] [PubMed] [Google Scholar]
- 15. Lewis J. D., Abreu M. T., Gastroenterology 2017, 152, 398. [DOI] [PubMed] [Google Scholar]
- 16. Tai C. C., Ding S. T., J. Nutr. Biochem. 2010, 21, 357. [DOI] [PubMed] [Google Scholar]
- 17. Itariu B. K., Zeyda M., Hochbrugger E. E., Neuhofer A., Prager G., Schindler K., Bohdjalian A., Mascher D., Vangala S., Schranz M., Krebs M., Bischof M. G., Stulnig T. M., Am. J. Clin. Nutr. 2012, 96, 1137. [DOI] [PubMed] [Google Scholar]
- 18. Duriancik D. M., Comstock S. S., Langohr I. M., Fenton J. I., J. Nutr. Biochem. 2015, 26, 1261. [DOI] [PubMed] [Google Scholar]
- 19. Li Y., Zhao F., Wu Q., Li M., Zhu Y., Song S., Zhu J., Ma Y., Li H., Shi X., Xu X., Zhou G., Li C., Sci. Rep. 2017, 7, 6241. [DOI] [PMC free article] [PubMed] [Google Scholar]
- 20. Vancamelbeke M., Vermeire S., Expert Rev. Gastroenterol. Hepatol. 2017, 1. [DOI] [PMC free article] [PubMed] [Google Scholar]
- 21. Thornton D. J., Sheehan J. K., Proc. Am. Thoracic Soc. 2004, 1, 54. [DOI] [PubMed] [Google Scholar]
- 22. Linden S. K., Florin T. H., McGuckin M. A., PLoS One 2008, 3, e3952. [DOI] [PMC free article] [PubMed] [Google Scholar]
- 23. Ermund A., Schutte A., Johansson M. E., Gustafsson J. K., Hansson G. C., Am. J. Physiol. Gastrointest. Liver Physiol. 2013, 305, G341. [DOI] [PMC free article] [PubMed] [Google Scholar]
- 24. Pelaseyed T., Bergstrom J. H., Gustafsson J. K., Ermund A., Birchenough G. M., Schütte A., van der Post S., Svensson F., Rodríguez‐Piñeiro A. M., Nyström E. E., Wising C., Johansson M. E., Hansson G. C., Immunol. Rev. 2014, 260, 8. [DOI] [PMC free article] [PubMed] [Google Scholar]
- 25. Birchenough G. M., Johansson M. E., Gustafsson J. K., Bergstrom J. H., Hansson G. C., Mucosal Immunol. 2015, 8, 712. [DOI] [PMC free article] [PubMed] [Google Scholar]
- 26. Van der Sluis M., De Koning B. A., De Bruijn A. C., Velcich A., Meijerink J. P., Van Goudoever J. B., Büller H. A., Dekker J., Van Seuningen I., Renes I. B., Einerhand A. W., Gastroenterology 2006, 131, 117. [DOI] [PubMed] [Google Scholar]
- 27. Reeves P. G., Nielsen F. H., Fahey G. C. Jr., J. Nutr. 1993, 123, 1939. [DOI] [PubMed] [Google Scholar]
- 28. Kim C. H., Song K. S., Kim S. S., Kim H. U., Seong J. K., Yoon J. H., Laryngoscope 2000, 110, 2110. [DOI] [PubMed] [Google Scholar]
- 29. Livak K. J., Schmittgen T. D., Methods 2001, 25, 402. [DOI] [PubMed] [Google Scholar]
- 30. Liu T., Shen C., Wang Y., Huang C., Shi J., PLoS One 2014, 9, e109573. [DOI] [PMC free article] [PubMed] [Google Scholar]
- 31. Van Houdt W. J., Emmink B. L., Pham T. V., Piersma S. R., Verheem A., Vries R. G., Fratantoni S. A., Pronk A., Clevers H., Borel Rinkes I. H., Jimenez C. R., Kranenburg O., Mol. Cell. Proteomics 2011, 10, M111.011353. [DOI] [PMC free article] [PubMed] [Google Scholar]
- 32. Mu Y., Chen Y., Zhang G., Zhan X., Li Y., Liu T., Li G., Li M., Xiao Z., Gong X., Chen Z., Electrophoresis 2013, 34, 1679. [DOI] [PubMed] [Google Scholar]
- 33. Ellulu M. S., Khaza'ai, H. , Abed Y., Rahmat A., Ismail P., Ranneh Y., Inflammopharmacology 2015, 23, 79. [DOI] [PubMed] [Google Scholar]
- 34. Givens D. I., Kliem K. E., Talbot G. (Eds.), Chronic Disease Risk Associated with Different Dietary Saturated Fatty Acids ‐ Reducing Saturated Fats in Foods, Woodhead Publishing, Cambridge: 2011, pp. 98–111. [Google Scholar]
- 35. Lee J. Y., Zhao L., Hwang D. H., Nutr. Rev. 2010, 68, 38. [DOI] [PubMed] [Google Scholar]
- 36. Wang J., Tang H., Zhang C., Zhao Y., Derrien M., Rocher E., van‐Hylckama Vlieg J. E., Strissel K., Zhao L., Obin M., Shen J., ISME J. 2015, 9, 1. [DOI] [PMC free article] [PubMed] [Google Scholar]
- 37. Kim J. J., Khan W. I., Pathogens 2013, 2, 55.25436881 [Google Scholar]
- 38. Brownlee I. A., Havler M. E., Dettmar P. W., Allen A., Pearson J. P., Proc. Nutr. Soc. 2003, 62, 245. [DOI] [PubMed] [Google Scholar]
- 39. Chang M., Tom A., Kistler E. B., Schmid‐Schönbein G. W., PLoS One 2012, 7, e40087. [DOI] [PMC free article] [PubMed] [Google Scholar]
- 40. Carmiel‐Haggai M., Cederbaum A. I., Nieto N., FASEB J. 2005, 19, 136. [DOI] [PubMed] [Google Scholar]
- 41. Velcich A., Yang W., Heyer J., Fragale A., Nicholas C., Viani S., Kucherlapati R., Lipkin M., Yang K., Augenlicht L., Science 2002, 295, 1726. [DOI] [PubMed] [Google Scholar]
- 42. Bhinder G., Stahl M., Sham H. P., Crowley S. M., Morampudi V., Dalwadi U., Ma C., Jacobson K., Vallance B. A., Infect. Immun. 2014, 82, 3753. [DOI] [PMC free article] [PubMed] [Google Scholar]
- 43. Rakoff‐Nahoum S., Paglino J., Eslami‐Varzaneh F., Edberg S., Medzhitov R., Cell 2004, 118, 229. [DOI] [PubMed] [Google Scholar]
- 44. Birchenough G. M., Nystrom E. E., Johansson M. E., Hansson G. C., Science 2016, 352, 1535. [DOI] [PMC free article] [PubMed] [Google Scholar]
- 45. Burger‐van Paassen N., van der Sluis M., Bouma J., Korteland‐van Male A. M., Lu P., Van Seuningen I., Boehm G., van Goudoever J. B., Renes I. B., Am. J. Physiol. Gastrointest. Liver Physiol. 2011, 301, G667. [DOI] [PubMed] [Google Scholar]
- 46. Park S. W., Zhen G., Verhaeghe C., Nakagami Y., Nguyenvu L. T., Barczak A. J., Killeen N., Erle D. J., Proc. Natl. Acad. Sci. USA. 2009, 106, 6950. [DOI] [PMC free article] [PubMed] [Google Scholar]
- 47. DeVito S. R., Ortiz‐Riano E., Martinez‐Sobrido L., Munger J., Proc. Natl. Acad. Sci. USA. 2014, 111, 18019. [DOI] [PMC free article] [PubMed] [Google Scholar]
- 48. Tran D. T., Ten Hagen K. G., J. Biol. Chem. 2013, 288, 6921. [DOI] [PMC free article] [PubMed] [Google Scholar]
- 49. Millerpodraza H., Bergström J., Teneberg S., Milh M. A., Longard M., Olsson B. M., Uggla L., Karlsson K. A., Infect. Immun. 1999, 67, 6309. [DOI] [PMC free article] [PubMed] [Google Scholar]
- 50. Chan B., Clasquin M., Smolen G. A., Histen G., Powe J., Chen Y., Lin Z., Lu C., Liu Y., Cang Y., Yan Z., Xia Y., Thompson R., Singleton C., Dorsch M., Silverman L., Su S. M., Freeze H. H., Jin S., Hum. Mol. Genet. 2016, 25, 2182. [DOI] [PMC free article] [PubMed] [Google Scholar]
- 51. Braun H. S., Sponder G., Pieper R., Aschenbach J. R., Deiner C., Genes Nutr. 2015, 10, 47. [DOI] [PMC free article] [PubMed] [Google Scholar]
- 52. Seo M. D., Velamakanni S., Ishiyama N., Stathopulos P. B., Rossi A. M., Khan S. A., Dale P., Li C., Ames J. B., Ikura M., Taylor C. W., Nature 2012, 483, 108. [DOI] [PMC free article] [PubMed] [Google Scholar]
- 53. Shirato K., Nakajima K., Korekane H., Takamatsu S., Gao C., Angata T., Ohtsubo K., Taniguchi N., J. Clin. Biochem. Nutr. 2011, 48, 20. [DOI] [PMC free article] [PubMed] [Google Scholar]
- 54. Wan J., Hu S., Jacoby J. J., Liu J., Zhang Y., Yu L. L., Food Funct. 2017, 8, 1793. [DOI] [PubMed] [Google Scholar]
- 55. Vizcaíno J. A., Csordas A., Deltoro N., Dianes J. A., Griss J., Lavidas I., Mayer G., Perez‐Riverol Y., Reisinger F., Ternent T., Xu Q. W., Wang R., Hermjakob H., Nucleic Acids Res. 2016, 44, D447. [DOI] [PMC free article] [PubMed] [Google Scholar]
Associated Data
This section collects any data citations, data availability statements, or supplementary materials included in this article.
Supplementary Materials
Additional file 1: The information of identified total proteins by LC‐MS/MS. (XLS 3.19 MB)
Additional file 2: The different abundant colonic proteins between soybean oil and fish oil groups. (XLS 37.0 KB)
Additional file 3: The different abundant colonic proteins between Lard and fish oil groups. (XLS 55.5 KB)