

Abstract
Scope
Calorie restriction (CR) has been shown to extend life‐ and health‐span in model species. For most humans, a life‐long CR diet is too arduous to adhere to. The aim of this study was to explore whether weekly intermittent CR can (1) provide long‐term beneficial effects and (2) counteract diet‐induced obesity in male aging mice.
Methods and results
In this study, we have exposed C57Bl/6J mice for 24 months to an intermittent (INT) diet, alternating weekly between CR of a control diet and ad libitum moderate‐fat (MF) feeding. This weekly intermittent CR significantly counteracted the adverse effects of the MF diet on mortality, body weight, and liver health markers in 24‐month‐old male mice. Hepatic gene expression profiles of INT‐exposed animals appeared much more comparable to CR‐ than to MF‐exposed mice. At 12 months of age, a subgroup of MF‐exposed mice was transferred to the INT diet. Gene expression profiles in the liver of the 24‐month‐old diet switch mice were highly similar to the INT‐exposed mice. However, a small subset of genes was consistently changed by the MF diet during the first phase of life.
Conclusion
Weekly intermittent CR largely, but not completely, reversed adverse effects caused by a MF diet.
Keywords: Aging, Intermittent calorie restriction, Liver, Moderate‐fat diet, Obesity, Transcriptomics
Abbreviations
- ALT
alanine aminotransferase
- CR
calorie restriction
- C
control
- HS
hepatic steatosis
- IHTG
intrahepatic triglyceride
- INT
intermittent
- IPA
ingenuity pathway analysis
- MA
microarray
- MF
moderate fat
- NASH
nonalcoholic steatohepatitis
- NAFLD
nonalcoholic fatty liver disease
- OGTT
oral glucose tolerance test
- PCA
principle component analysis
1. Introduction
The beneficial health effects of a calorie restricted (CR) diet, avoiding malnutrition, can be appreciated from two perspectives. First, in our obesogenic society, where about half of the population is overweight or obese 1, maintaining a reduced energy intake is the best nutritional strategy to achieve and maintain weight loss 2, 3. Since obesity causes a wide range of serious chronic diseases, the negative energy balance induced by a CR diet will result in weight loss and induce, concomitantly, health promoting effects. Secondly, CR has been acknowledged as the most successful approach to increase longevity in a wide range of species 4. Apart from life‐span, reduced food intake also increases health‐span. Here, the health‐promoting effect is not achieved by counteracting obesity‐related disorders, but by ameliorating a wide range of aging‐related diseases 5, 6, 7. It is worth mentioning, however, that these obesity‐ and age‐related disorders fundamentally overlap.
In order to achieve longevity, the application of a CR diet requires life‐long adherence to a very strict dietary regimen. Severe food restriction is very arduous and too difficult to practice and to sustain for most individuals. Importantly, long‐term exposure to a CR diet might also cause substantial side effects like amenorrhoea, osteoporosis, decreased fertility, and libido, impaired wound healing and increased susceptibility to infections 8, 9, 10, 11. Different variants of intermittent energy restriction (CR for intermittent periods of time) have been reported to have health‐promoting effects. These beneficial health effects include improvements of body composition 12, 13, 14, skin wound healing 9, blood pressure and cardiovascular health markers 15, 16, neurological health and cognitive performance 17, 18, 19 and retarded tumor growth/formation 20, 21, 22, 23. By applying repetitive cycles of fasting/CR and regular eating, the negative side effects of CR are thought to be circumvented. Moreover, an intermittent CR regimen is more feasible to maintain. Importantly, increasing evidence points out that the beneficial health effects of (intermittent) CR are not solely caused by reduced body weight 24, 25. Timing and limitation of meal frequency affect the circadian rhythm and might induce a repetitive challenge that most likely will contribute to the health promoting effects 26, 27, 28, 29. We recently reported that an intermittent energy restriction (INT) diet maintains metabolic health and reverses the adverse effects of the moderate‐fat (MF) diet, when provided for 10 months to 9‐week‐old male C57BL/6J mice 30.
One of the most frequently affected organs in obese individuals is the liver, which is recognized to be the most important metabolic organ and supporting nearly every other organ in the body. Obesity induces a spectrum of abnormalities in the liver called nonalcoholic fatty liver disease (NAFLD), which is currently the most common chronic liver disease in developed countries. NAFLD is seen in 20–40% of the general adult population, but incidence in severe obese adult individuals is much higher (70–90%) 31. The mildest form of NAFLD is simple hepatic steatosis (HS) and is characterized by intrahepatic accumulation of lipids alone. In around 47% of the severely obese adults this benign hepatic lipid accumulation evolves into nonalcoholic steatohepatitis (NASH) characterized by inflammatory infiltration of the liver and low‐level fibrosis 32. Between 10 and 29% of the individuals with NASH develop advanced fibrosis, cirrhosis, and ultimately, hepatocellular carcinoma (HCC) 33, 34. This progressive disease development is characterized by increasing severity and predisposition to mortality. It has been reported that both the prevalence of NAFLD as well as progression into more severe forms of NAFLD in the general population increase with age 35, 36, 37. The early stages of NAFLD are considered to feature a benign, nonprogressive, and reversible disease 31. Management of HS and NASH is mainly focused on treatment of obesity by introducing lifestyle modifications including increased exercise and decreased calorie intake. Although there is strong evidence that the early stages of NAFLD caused by an obesogenic diet are reversible, it is currently not clear whether all detrimental effects are completely restored after long‐term exposure to such a diet.
In this study, we explored the effects of an intermittent calorie restriction (INT) regimen on NAFLD development during aging by applying the same strict and robust form of the INT diet in male C57BL/6J mice, as previously reported 30. By alternating weekly between a 40E% calorie restricted control diet and an ad libitum MF diet, the mice were challenged to adapt to differences in (1) energy intake, (2) macronutrient composition of the diet, and (3) continues food exposure versus a one‐portion‐a‐day feeding pattern. The effects of this exceptionally challenging diet on overall body health in the period between middle‐aged (12 months) and old (24 months) C57BL/6J mice were explored. In addition, we examined the biochemical, morphological and molecular effects this diet caused in the liver of the 24‐month‐old mice. The obesity‐counteracting effects of this diet were identified by introducing a diet switch in life‐long MF‐exposed mice at the age of 12 months to the INT diet. In 24‐month‐old mice we examined into what extent the adverse health effects caused by the MF diet, are reversible by applying the INT diet on whole‐body as well as on liver health. Life‐long exposure to a low‐fat control diet (C), MF, or a continuous CR diet (30% calorie reduction) were included as normal, unhealthy, and healthy aging controls, respectively.
2. Materials and methods
2.1. Ethics statement
The institutional and national guidelines for the care and use of animals were followed and the Local Committee for Care and Use of Laboratory Animals at Wageningen University approved the experiment (code number: drs‐2010151b).
2.2. Animals and diets
Male C57BL/6J mice (age: 7 weeks) were purchased from Janvier (Cedex, France) and were housed in pairs of two in the light and temperature (20°C)‐controlled animal facility of Wageningen University (12‐hour light/dark cycle, light on at 04.00). The mice received standard AIN‐93G (Research Diet Services, Wijk bij Duurstede, The Netherlands) for 2 weeks upon arrival.
At the start of the diet intervention the mice were 9 weeks old, housed individually and randomly distributed into four intervention groups: (1) Control diet (C) receiving AIN‐93W diet ad libitum (n = 89); (2) Moderate‐fat diet (MF) receiving AIN‐93W‐MF ad libitum (n = 127); (3) Intermittent diet (INT) receiving alternating one week AIN‐93W‐MF ad libitum followed by one week 60E% of the C diet based on the mean energy intake of the mice on the AIN‐93W diet (n = 155), and (4) Calorie restricted diet (CR) receiving AIN‐93W‐CR in portions containing 70E% of the mean energy intake of the group of the control mice were provided each day at 15.30 (n = 117). At the age of 12 M we created group (5) by transferring a subset of 32 randomly selected mice from the MF‐intervention group to the INT diet which they received for the second part of their life (for study design see Fig. 1A). With the INT dietary intervention we intended to induce the maximal fluctuation in weight gain and weight loss that is allowed according to the regulations of our Local ethical committee for care and use of laboratory animals (that is 20% of the total body weight). AIN‐93W is a variant of the AIN‐93M (maintenance of adult mice) diet, which slightly differs on the fat source. The 10E% fat content in AIN‐93M solely comes from soybean oil, while the fat source of AIN‐93W is a mix of 6E% soybean oil and 4E% palm oil, in order to balance saturated and unsaturated fat composition. The AIN‐93‐W‐MF contained 25E% fat, also from soybean oil and palm oil. AIN‐93W‐CR contained increased concentrations of vitamins and minerals in order to feed these mice the same concentrations of micronutrients as the mice receiving AIN‐93W diet to avoid malnutrition. The complete composition of the applied diets is listed in Supporting Information Table 1 (Research Diet Services, Wijk bij Duurstede, The Netherlands). All mice were provided with ad libitum access to water.
Figure 1.
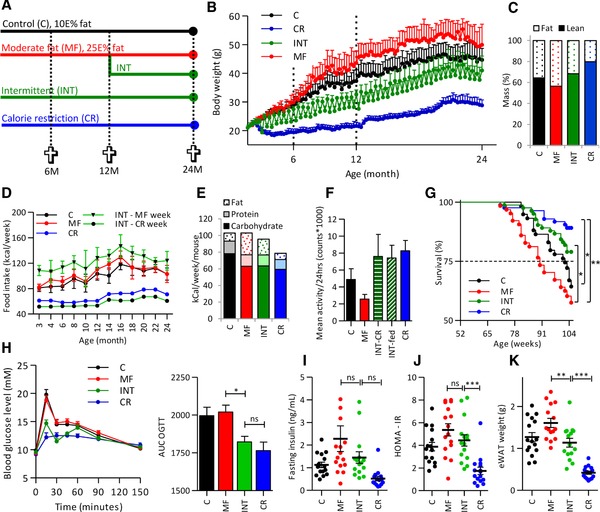
Intermittent calorie restriction (INT) strongly increases life‐ and health‐span. (A) Study design scheme. (B) Weekly body weight measurements show a fluctuating body weight of the INT‐exposed mice dependent on the diet the mice received in the preceding week and a mean body weight in between that of the mice fed a control (C)‐ or calorie restricted (CR) diet. Body weight development results up till 12 months of age have been published before 30. (C) INT‐exposed mice display an increase in lean body mass but not to the same extent as found in the CR‐fed animals. (D) During the whole study the highest food intake was found for the ad libitum fed mice from the INT group while the during the CR week this intervention group had the lowest food intake. (E) Mean energy intake of the INT‐fed mice is slightly lower compared to the Moderate‐fat (MF)‐exposed animals and significantly higher compared to the CR‐fed mice. (F) Mean daily activity levels in the INT‐fed mice were highly similar to the CR‐exposed animals and differ significantly from the MF‐exposed mice. (G) Weekly intermittent CR causes a significant increase in survival compared to the MF‐exposed mice but not to the same extent as found for the CR‐fed animals. (H) An oral glucose tolerance test (OGTT) showed that glucose clearance in the INT‐exposed mice is similar to the CR‐fed mice. (I) Fasting insulin levels and HOMA‐IR index of the INT‐fed mice were in between the levels found in the MF‐ and CR‐exposed mice. (J) eWAT weight of the INT‐exposed animals was significantly lower compared to the MF‐fed mice but significantly higher than found for the CR‐exposed mice. Results are means ± SEM, *p < 0.01, **p < 0.001, ***p < 0.0001.
Body weight of (1) all mice was recorded every two weeks and (2) of a representative subgroup of ∼24 mice of each intervention group in the in between weeks (to represent a weekly body weight development). Food intake of 20 mice of each intervention group was measured every 2 months, comprising one week measurement for the C, CR, and MF‐fed mice and 2 weeks measurement for the INT‐fed mice. Portion sizes of the mice on the CR and INT were adjusted at the beginning of the study and at the age of 6, 12, and 18 months based on food intake of C mice.
At the age of 6, 12, and 24 months, 12–16 mice of each intervention group were sacrificed between 14.00 and 17.00 on consecutive days (the remaining mice stayed in the experiment and were sacrificed at older ages). All mice were included in the survival analysis and censored when they were culled at the different ages. INT mice were sacrificed in their ad libitum MF feeding week. Similar to what we performed in the previous study 30, prior to sacrifice each mouse was first fasted for 4 h after which they received an intragastric gavage of either solvent (0.5% carboxymethyl cellulose) or Wy‐14 643 dispersed in solvent (160 mg Wy‐14 643/kg body weight), then fasted again for another 6 h. Only mock‐treated animals were included in the molecular analysis, since the Wy‐14 643 treatment have an immediate effect on the gene expression levels 38. The purpose of this treatment is to examine PPARα adaptive capacity analysis, which has been covered in a separate publication 39. After sedation with a mixture of isoflurane (1.5%) in nitrous oxide (70%) and oxygen (30%), blood samples were collected by cardiac puncture, then followed by neck dislocation. Weight of the various organs was measured and subsequently organs/tissues were snap‐frozen and stored at –80°C until further molecular/biochemical analysis. For histological analysis, organs/tissues were fixed in 4% paraformaldehyde.
2.3. Daily activity measurement
At 23 months of age, 19–24 mice of each intervention group were housed in new cages to monitor physical activity continuously during 3 days as previously described 40, 41. Activity sensors (dual technology detector DUO 240, Visonic; adapted by R. Visser, NIN, Amsterdam, The Netherlands) were mounted above the cages and data were analyzed with MED‐PC® IV software for data collection (MED associates, St Albans, VT, USA). Activity was expressed in counts per 30 min and calculated for each mouse separately.
2.4. DEXA scan body composition analysis
Body composition was measured by Dual Energy X‐ray Absorptiometry (DEXA) scan, using a PIXImus imager (GE Lunar, Madison, WI, USA) of 24 mice of each dietary intervention group. The scans produced data concerning lean mass, fat mass, and bone mineral density. During the measurements the animals were under general anesthesia (isoflurane/N2O/O2).
2.5. Oral glucose tolerance test
The mice sacrificed at the age of 24 months were all subjected to an oral glucose tolerance test (OGTT) two weeks prior to sacrifice. In the OGTT, the mice were fasted for 6 h, then received 1.5 mg glucose per gram body weight via an oral gavage. Subsequently, blood glucose was measured 15, 30, 45, 60, 90, and 150 min following the glucose load using Accu‐Check blood glucose meters (Roche Diagnostics, Almere, The Netherlands).
2.6. RNA isolation
Total RNA was isolated from the liver of each individual mouse using TRIzol reagent (Invitrogen Breda, The Netherlands) according to the manufacturer's instructions. The RNA was treated with DNAse and purified on columns using the RNAeasy microkit (Qiagen, Venlo, The Netherlands). RNA concentration was measured on a NanoDrop ND‐1000 UV–vis spectrophotometer (Isogen, Maarssen, The Netherlands) and RNA integrity was checked on an Agilent 2100 Bioanalyzer (Agilent Technologies, Amsterdam, The Netherlands) with 6000 Nano Chips according to the manufacturer's instructions. RNA was judged as suitable only if samples showed intact bands of 18S and 28S ribosomal RNA subunits, displayed no chromosomal peaks or RNA degradation products, and had a RNA integrity number above 8.0.
2.7. Microarray hybridization and analysis
Hundred nanograms of purified RNA from the liver of the individual mice was used for the preparation of labeled cDNA, applying the Ambion Whole Transcript (WT) Expression kit (Life Technologies, Carlsbad, USA) in combination with the Affymetrix GeneChip WT Terminal Labeling kit (Affymetrix, Santa Clara, USA). All samples were hybridized at one time point to Affymetrix GeneChip Mouse Gene 1.1 ST arrays according to standard Affymetrix protocols. Microarray analysis was performed in MADMAX, a pipeline for statistical analysis of microarray data 42. Arrays were normalized using the Robust Multiarray Average 43, 44. Probe sets were defined according to Dai et al. 45. In this method probes are assigned to unique gene identifiers, in this case Entrez IDs. The probes on the Gene 1.1 ST arrays represent 21 225 Entrez IDs. Array data were submitted to the Gene Expression Omnibus and are available under accession number GSE93642.
2.8. Bioinformatic analysis
Of the 21 225 defined genes covered by the microarray (MA), only genes with an intensity value of ≥20 on at least five arrays, represented by at least seven probes per gene on the array and an interquartile range (IQR) ≥0.1 were selected for further analysis and not annotated were removed. The top‐1000 most variable genes were used for principle component analysis (PCA) using MultiExperimentViewer version 4.8.1 46, 47. Signal log2 ratios, which represent fold changes, and related significances of change were calculated from the mean signal intensities and differences between diet groups was analyzed using intensity based‐moderated t‐statistics implementing empirical Bayes correction 48. Resulting log2 ratios and p‐values were applied for further descriptive bioinformatic analysis of the data. Ingenuity pathway analysis (IPA, Ingenuity® Systems, http://www.ingenuity.com) was used to explore the canonical pathways affected by the 148 reversibly and 1510 consistently changed genes. Comparison of the expression patterns of the 148 irreversible changed genes in the MF, INT, and MF/INT diet switch groups was carried out by generating a heat map using MultiExperimentViewer, version 4.8.1 46, 47.
2.9. Histopathology
Formalin‐fixed and paraffin‐embedded cross‐sections (5 μm) of the liver lobe were stained with haematoxylin and eosin. Samples were scored blindly by a board‐certified pathologist using an adapted grading method for human NASH 49 in 6–8 mice of each intervention group. Briefly, a haematoxylin and eosin stained liver cross‐section per mouse was examined and the level of steatosis was determined relative to the total liver area analyzed (expressed as a percentage). Hepatic inflammation was assessed by counting the number of inflammatory foci at a 100× magnification (view size 3.1 mm2), in five nonoverlapping fields.
2.10. Hepatic triglyceride and 4‐hydroxyproline measurement
Liver triglycerides were determined in 5% liver homogenates prepared in buffer containing 250 mM sucrose, 1 mM EDTA, 10 mM Tris‐HCl (pH 7.5), using the triglyceride Liquicolor Monoreagent (Instruchemie, Delfzijl, The Netherlands). 4‐hydroxyproline content was determined spectrophotometrically in liver hydrolysates as previously described in Hillebrandt et al. 50. For both assays 16 mice of each intervention group were included in the analysis.
2.11. Plasma measurements
Plasma insulin, IL‐6, and leptin levels were measured using a Mouse Adipokine (MADKMAG‐71K) kit Merckmillipore, Amsterdam, The Netherlands, according to the manufacturer's instructions in 16 mice of each intervention group. Plasma concentration of alanine aminotransferase (ALT) was measured with commercially available kits from Instruchemie (Delfzijl, the Netherlands) in all sacrificed mice and measured in 16 mice of each intervention group. Plasma triglyceride and free fatty acid were measured using Liquicolor (Instruchemie, Wiesbaden, Germany) and NEFA‐C kit (Wako, Neuss, Germany), respectively in 6–8 mice of each intervention group. Both assays were performed according to manufacturer's instructions.
2.12. cDNA synthesis and real‐time quantitative PCR
The microarray data were validated by real‐time quantitative PCR (qPCR). For each individual sample, single‐stranded complementary DNA was synthesized from 1 μg of total RNA using the First Strand cDNA Synthesis kit (Thermo Scientific, Landsmeer, The Netherlands), following the supplier's protocol. Q‐PCR was performed using SensiMix SYBR No‐ROX kit (Bioline, Alphen aan de Rijn, The Netherlands) and a CFX384 thermal cycler (Bio‐Rad, Veenendaal, The Netherlands). The following thermal cycling conditions were used: 2 min at 94°C, followed by 40 cycles of 94°C for 15 s and 60°C for 45 s. PCR reactions to validate the MA results of a panel of gens were performed in duplicate and all samples were normalized to 36B4 expression. Primer sequences were retrieved from the online PrimerBank database 51.
2.13. Statistical analysis
Except for the gene expression, data were analyzed with GraphPad Prism 5.04 applying 1‐way ANOVA followed by a Tukey posttest analysis. Statistical significance for the survival of groups was established by the log‐rank analysis of Kaplan–Meier plots.
3. Results
3.1. Intermittent calorie restriction protected against the detrimental effects of a moderate‐fat diet
The first part of this study explored the long‐term effects of weekly intermittent CR (for study design see Fig. 1A). Body weight was recorded weekly during the study. The obtained results showed, as expected, that the MF‐exposed mice gained the highest body weight while the lowest body weight was observed for the CR‐fed animals (Fig. 1B). Body weight of the INT‐fed mice displayed a constantly fluctuating pattern, dependent on the diet the mice received in the preceding week. DEXA scan analysis showed that, in line with the body weight, the percentages of fat (f) and lean (l) body mass of the INT‐exposed mice (l: 68.3%, f: 31.7%) were in between those of the CR‐ (l: 78.9%, f: 20.1%) and C‐fed mice (l: 64.4%, f: 35.6%) (Fig. 1C). Food intake recordings presented in Fig. 1D show that, during the entire study, of all intervention groups the INT‐exposed mice have the highest energy intake during the ad libitum feeding week and the lowest during their CR‐restricted week. Combining the intake values of the CR and ad libitum MF weeks at 24 month of age revealed that the mean energy intake of the INT‐fed mice was slightly lower than the amount of calories consumed by C‐fed mice and substantially higher than that consumed by the CR‐exposed mice (Fig. 1E). Furthermore, it is important to note that this figure also reveals that, although the INT‐exposed mice consume less kCal/week than the control mice, their fat intake is higher. Consequently, INT‐exposed mice were challenged by fluctuating amount of calories, but also by a difference in macronutrient composition of the consumed diet. We have recently shown that 12‐month‐old mice exposed to the INT diet demonstrate hyperphagia during the first few days of the ad libitum feeding week 30. This increased eating pattern at the first days after the diet switch still occurred at old age (Supporting Information Fig. 1A).
Daily activity recorded at the age of 23 months revealed that the INT‐exposed animals were significantly more active than the C‐ and MF‐exposed mice and similarly active to the life‐long CR‐exposed animals (Fig. 1F). Although this increased activity pattern in the INT‐exposed mice was found in both the CR and the ad libitum MF feeding week, the timing of the activity differed (Supporting Information Fig. 1B). During the MF‐week, the burst of activity was observed when the light was switched off. During the CR‐week the activity increased when the food was provided, 30 min before the light was switched off similar to the pattern found for the life‐long CR exposed mice. Mortality rates of the four intervention groups, presented in Fig. 1G, show the highest survival in CR‐fed animals. The survival rate of the CR intervention group was significantly higher than that of the C‐fed (p = 0.001) and MF‐fed (p < 0.001) mice. The survival rate of the INT‐exposed mice was lower than that of the CR‐fed mice, but still significantly enhanced (p = 0.04) compared with the MF‐exposed mice. Pathological analysis of the mice that died or were euthanized during the study revealed that most of them suffered from multiple pathologies. Various tumors, particularly in the liver and lungs, ulcerative dermatitis, and eye abnormalities were often detected (Supporting Information Table 2). No clearly distinct pathological features were detectable between the intervention groups.
An OGTT, carried out 2 weeks prior to sacrifice, revealed that glucose clearance in the INT‐fed mice was significantly improved compared to the MF‐exposed mice and almost similar to the CR‐fed mice (Fig. 1H). In addition, fasting insulin levels in the INT‐exposed mice showed a tendency to decrease compared to the MF‐exposed mice, although this effect was not significant (Fig. 1I). Similarly, the homeostatic model assessment of insulin resistance (HOMA‐IR) result revealed that the mean HOMA‐IR value in the INT intervention group was slightly lower than that of MF group (Fig. 1J) but significantly higher compared to the CR‐exposed mice. A significant decrease in plasma leptin levels in the INT versus the MF‐exposed animals was found but no significant changes between the four intervention groups was found for plasma IL‐6, free fatty acid (FFA), and triglyceride (TG) levels (Supporting Information Fig. 1C). Weight of the epididymal white adipose tissue (eWAT) in the INT‐exposed mice was found to be significantly decreased compared to the MF‐exposed mice and significantly increased compared with the CR intervention group (Fig. 1K). A similar effect was found for kidney weight but not for heart, lung, spleen, and pancreas weight (Supporting Information Fig. 1D).
Taken together, intermittent CR significantly improved overall health compared with the MF‐fed mice, indicating a protection against the detrimental effects of a MF diet. However, the beneficial effects were not as pronounced as induced by continuous CR exposure.
3.2. Life‐long weekly intermittent calorie restriction reduced most but not all detrimental effects caused by a MF diet in the liver
To evaluate the effects of life‐long INT feeding on the liver, a panel of different markers was examined in 24‐month‐old mice. Liver weight in the INT‐fed mice was significantly lower compared with the MF‐exposed mice and did not differ significantly from the CR‐fed mice (Fig. 2A). However, when normalized to the body weight, the relative liver weight of INT diet group was significantly lower than that of the CR diet (Fig. 2B). A significant decrease in the intrahepatic triglyceride (IHTG) levels was found in the INT‐fed mice compared with the MF‐exposed mice, but the levels were significantly higher compared with the CR‐exposed mice (Fig. 2C). The correlation between IHTG and plasma insulin levels was assessed, and revealed that high IHTG levels did not necessarily correlate with high plasma insulin levels (Fig. 2D). Histological analysis of the livers of the mice from the different intervention groups confirmed the results of the IHTG measurements (Fig. 2E and Supporting Information Fig. 2). Moreover, intermittent CR caused significant improvement of plasma ALT levels, a well‐established marker of liver injury/damage compared to the mice exposed to the MF diet (Fig. 2F). In addition, histological scoring of inflammatory aggregates (Fig. 2G) and quantification of liver fibrosis by measuring 4‐hydroxyproline levels (Fig. 2H) showed significant improvement of liver health of the INT‐fed mice compared to the MF‐exposed mice. These last three markers represent the more advanced stages of NAFLD and revealed no significant differences between the INT‐ and CR‐exposed mice.
Figure 2.
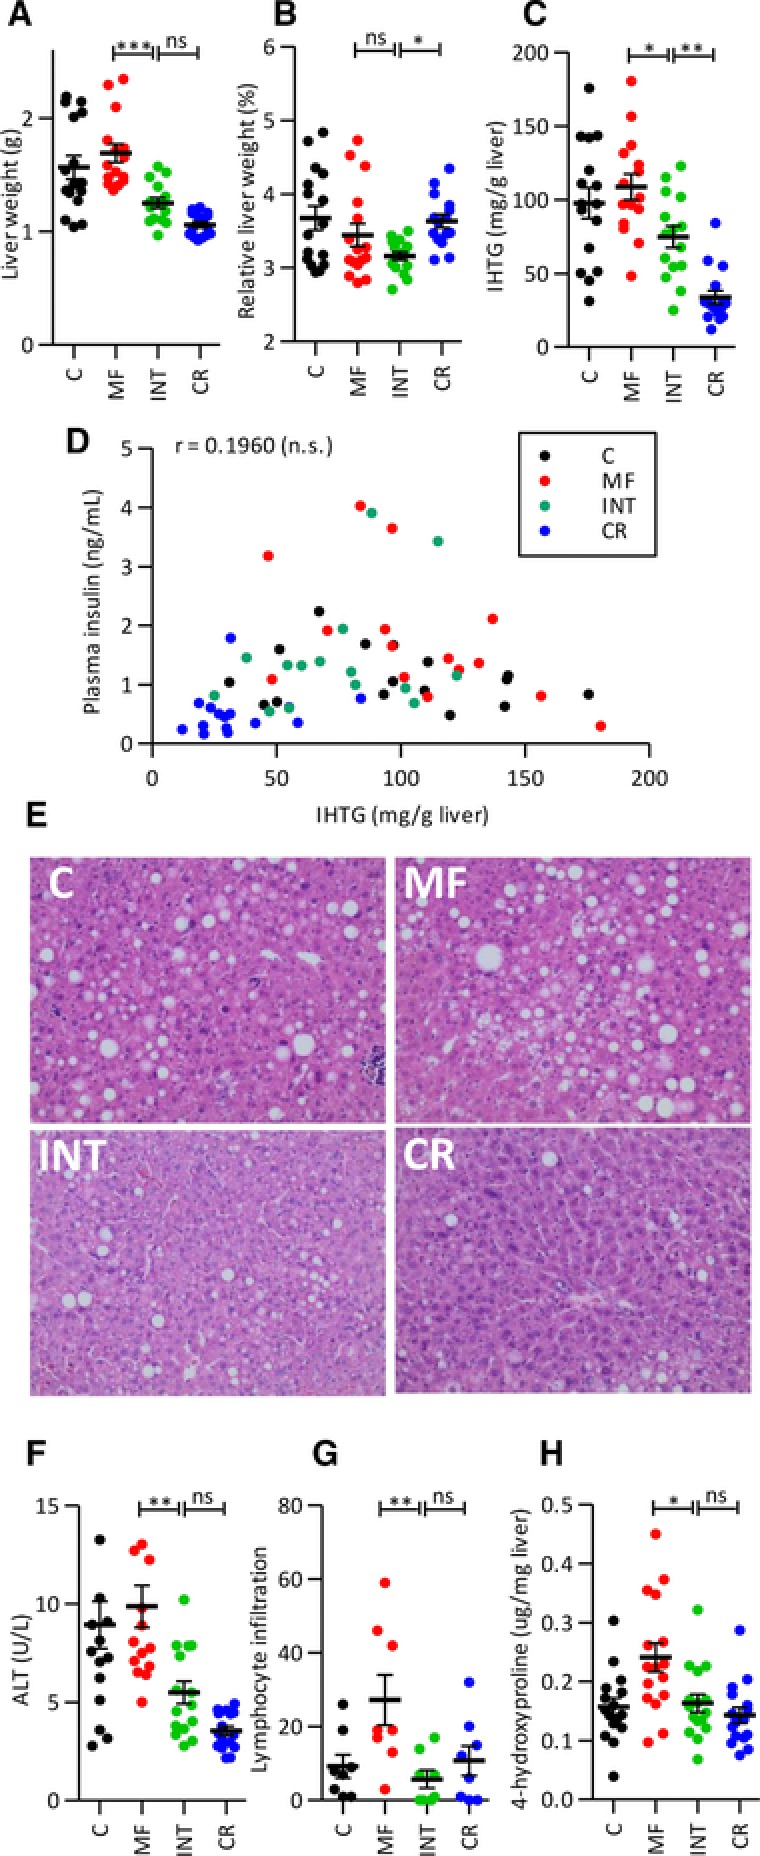
Intermittent CR counteracts the adverse health effects of the MF diet on the liver. The adverse effects caused by a MF diet on (A) liver weight, (B) relative liver weight, (C) intrahepatic triglyceride (IHTG) levels, and (D) Correlation between IHTG and plasma insulin. (E) Four representative examples of haematoxylin and eosin stained sections of the different intervention groups are presented. Markers of the severe stages of NAFLD including (F) ALT, (G) lymphocyte infiltration, and (H) 4‐hydroxyproline levels were significantly counteracted by intermittent CR in the INT‐exposed animals. Results are means ± SEM, * p < 0.01, ** p < 0.001, *** p < 0.0001.
In summary, despite the fact that INT‐fed animals had been exposed to the MF diet for half of their life, apart from displaying slight accumulation of liver triglycerides, they performed equally well as CR‐exposed mice for all other NAFLD markers tested.
3.3. Gene expression profiles of 24‐month‐old INT‐fed mice were more similar to CR than to MF‐exposed animals
Next, we studied the differences in hepatic gene expression patterns of the INT‐exposed mice in comparison to the CR and MF intervention groups. For this purpose, MA analysis was applied on RNA isolated of the livers from the mice. As shown in Fig. 3A, the number of significantly (p < 0.01) differentially expressed genes between INT‐ and MF‐exposed animals increased with age and the highest number of differentially expressed genes was found at the oldest time point. In contrast, the difference between INT‐ and CR‐exposed mice was most abundant in 6‐month‐old mice and decreased during aging. At the age of 24 months, in total 2815 genes displayed differential expression between INT‐ and MF‐exposed animals while 569 genes were found to be differential expressed between INT‐ and CR‐fed mice. PCA of the top‐1000 most variable genes in the 24‐month‐old animals, showed higher similarity between the INT and the CR‐fed animals than between the INT‐ and MF‐exposed mice (Fig. 3B). IPA revealed that the differentially expressed genes in the two comparisons are related to different canonical pathways. The results presented in Fig. 3C show that that hepatic fibrosis/hepatic stellate cell activation and other immune pathway‐related genes dominate the difference between INT‐ and MF‐exposed animals. This result confirms the biochemical data presented in Fig. 2. RXR activation was identified as the major difference between INT‐ and CR‐fed mice by IPA. Furthermore, IPA upstream regulator analysis suggested that the factors driving the differential gene expression between the INT and MF diet were TGFB1 and a number other cytokines including TNF, IL4, and IFNγ. On the contrary, differential gene expression between INT and CR‐ exposed mice was due to NFE2L2 (or NRF2) activity well‐known for its antioxidant response 52, XBP1, acknowledged to mediate ER stress/apoptosis 53, 54, and the well‐established liver the liver transcription factor HNF4A 55. Remarkably, our data do not point toward the involvement of one or more of the four well‐established pathways involved in mediating the CR effect including (1) the insulin like growth factor (IGF‐1)/insulin signaling pathway, (2) the sirtuin pathway, (3) the adenosine monophosphate activated protein kinase pathway, and (4) the target of rapamycin pathway 6, 56, as upstream regulators. The expression profiles of the strongest differentially expressed genes in INT‐exposed mice are depicted in Fig. 3D–G and listed in Supporting Information Table 3. Cyp2b9, Igkv4‐57‐1, and Acot3 are the strongest upregulated genes when compared to the CR‐fed mice (Fig. 3D). Moxd1, Cyp4a12b, and Gldn exhibit the strongest downregulation in the same comparison (Fig. 3E). The results presented in Fig. 3D, E reveal that in INT‐fed mice the genes that are differentially expressed compared to the CR mice are highly similar to the expression patterns in the MF‐exposed mice. The genes showing the strongest increased expression in INT‐fed compared to MF‐exposed mice are Hsd3b5, Serpina4‐ps1, and Slco1a1 (Fig. 3F) while Cyp2b13, Cidea, and Pls1 exhibit the strongest decrease (Fig. 3G). The genes presented in Fig. 3F, G show, apart from differential expression compared to the MF‐exposed mice, highly similar expression compared to CR‐exposed mice.
Figure 3.
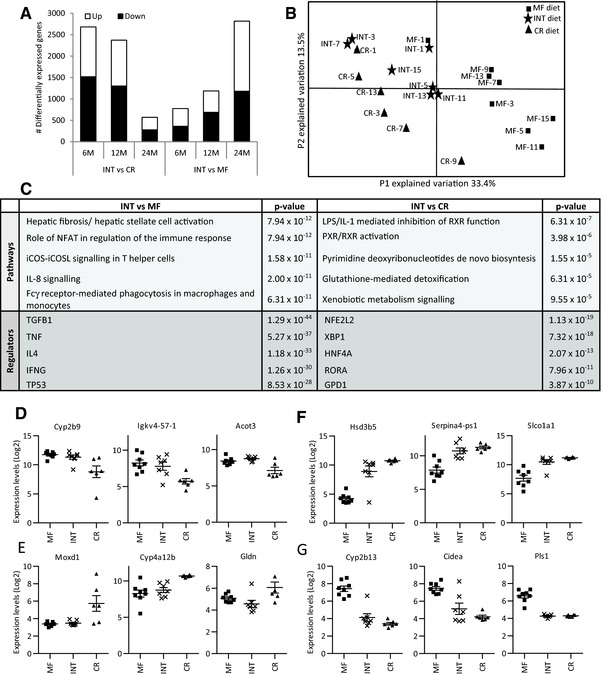
Gene expression measured in the liver of 24‐months‐old INT‐exposed mice is more similar to that of CR than MF‐fed animals. (A) The number of significantly differentially expressed genes between the INT and MF intervention groups increase during aging while the INT versus CR comparison revealed an aging‐related decrease of differentially expressed genes. (B) The principal component analysis (PCA) plot generated from the top‐1000 most variable genes showed that the expression profiles of the INT‐fed animals is more similar to the CR than to the MF‐exposed animals. The numbers displayed in the PCA plot represent the numbers of the individual mice of the three intervention groups. (C) IPA analysis revealed distinct canonical pathways and upstream regulators for the two subsets of differentially expressed genes. MA expression profiles of the three genes encompassing the strongest (D) upregulation or (E) downregulation in INT compared to CR‐exposed mice or (F) upregulation or (G) downregulation compared to MF‐exposed mice.
In conclusion, these results indicate that weekly intermittent CR alters gene expression profiles induced by the MF diet at old age and are, significant but to a lesser extent, distinct from the continuously CR‐exposed mice.
3.4. Phenotypic plasticity observed in the MF/INT diet switch group
In the final part of our analysis, we explored the plasticity of the long‐term effects induced by the MF diet. For this purpose, a subset of 12‐month‐old mice was transferred from the MF to the INT diet (MF/INT diet switch group). The mice of the diet switch group received the INT diet till sacrifice at the age of 24 months. As shown in Fig. 4A, the results of the OGTT analysis revealed that glucose metabolism of the mice in the diet switch group was similar to that of the life‐long INT‐exposed mice. Furthermore, survival of the diet switch group markedly increased compared to the life‐long MF‐exposed animals, although this effect did not reach the level of significance (Fig. 4B). Compared with the life‐long MF‐exposed mice body weight decreased significantly in the diet switch mice (Fig. 4C). A reduction in eWAT (Fig. 4D) and liver (Fig. 4E) weight was observed but both adaptations were not significant. Analysis of a panel of liver health markers (Fig. 4F) revealed no change in IHTG levels after the diet switch and a marked but not significant decrease in plasma ALT, lymphocyte infiltration, and 4‐hydroxyproline levels in the MF/INT diet switch mice compared to the life‐long MF‐exposed animals.
Figure 4.
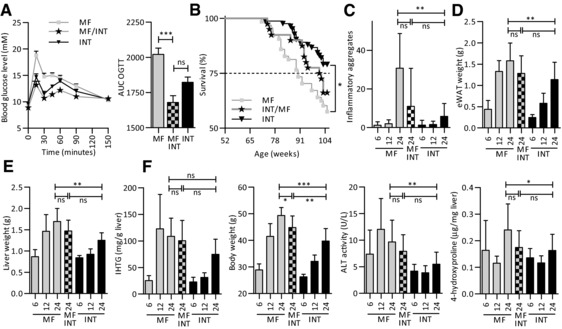
Effects of exposure to a MF diet are partially reversed after transferring the mice to the INT diet for the last 12 months of their life. Strong adaptation to the INT diet in the MF/INT diet switch group was found by measuring (A) glucose clearance (B) survival and (C) body weight. The decrease in (D) eWAT weight, (E) liver weight, (F) IHTG levels, liver inflammation, ALT and 4‐hydroxyproline levels after the diet switch were not significant. The data of 12‐month‐old mice are parts of our previous publication 30. Results are means ± SEM, * p < 0.01, ** p < 0.001, *** p < 0.0001.
3.5. Molecular adaptations and irreversible changes in the liver of the MF/INT diet switch group
As shown in Fig. 3A, microarray analysis revealed that, at the age of 24 months, 2815 genes displayed significant differentially expression between INT‐ and MF‐exposed mice. We compared the expression levels of these 2815 genes between the diet switch group with either the life‐long MF‐ or INT‐exposed animals, respectively (see Fig. 5A). Expression levels of 1510 genes were found to be similar in the MF/INT and the life‐long INT‐exposed animals and distinct from the MF‐exposed animals (MF/INT versus INT p > 0.01; MF/INT versus MF p < 0.01). This result indicated that expression levels of these 1510 genes adapted to the INT diet that the mice had received during the last 12 months of their life. Expression levels of a second subset of 1157 genes did not differ significantly from either the MF or from the INT‐fed animals (MF/INT versus INT p > 0.01; MF/INT versus MF p > 0.01). Interestingly, expression of a relative small subset of 148 genes differed significantly between the MF/INT diet switch and the INT‐exposed mice, but not from the MF‐exposed mice (MF/INT versus INT p < 0.01; MF/INT versus MF p > 0.01). This result implies that the differential expression induced by the MF diet of these 148 genes did not adjust to the INT diet during the last 12 months of life, thus indicating an irreversibility of the MF‐induced effects. The heatmap of the hierarchical clustering of this selection of 148 genes presented in Fig. 5B shows clustering of the INT‐exposed mice and a distinct expression profile compared to mice of the MF and MF/INT intervention groups. IPA applied to compare the canonical pathways of the 148 irreversible (Supporting Information Table 4) and the 1510 reversible genes (Supporting Information Table 5), revealed that these subsets of genes represented distinct canonical pathways. The 148 consistently altered genes were found to affect RXR‐mediated processes and xenobiotic metabolism signaling (Fig. 5C). In contrast, the 1510 adaptive genes were found to be involved in a variety of immune response and inflammation‐related pathways and in hepatic fibrosis/stellate cell activation (Fig. 5D). IPA was applied to obtain insight into the mechanisms regulating the expression of the 148 consistently altered genes and found that PXR was the strongest regulator of this selection of genes (Table 1).
Figure 5.
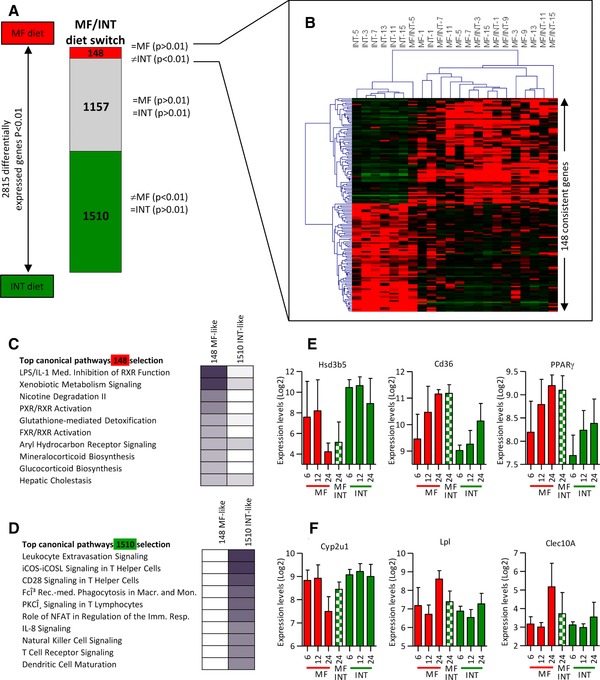
A small fraction of the MF‐induced genes during the first 12 months of life are consistently altered. (A) Schematic overview of the different gene groups revealing full (1510 genes) or partial (1157) adaptation to the INT diet and a subset of 148 genes of which the expression levels remained similar to the life‐long exposed MF mice. (B) A heatmap of the 148 consistently altered genes show clustering of the MF and MF/INT diet switch mice and distinct expression profiles for most of the INT‐exposed 24‐month‐old mice. Ingenuity pathway analysis (IPA) of the (C) 148 genes consistently changed by the MF diet and the (D) 1510 adaptable genes revealed that they present different functional categories. (E) Gene expression profiles obtained from microarray data of three examples of consistently affected genes and (F) genes that adapt to the INT diet after the diet switch. The data of 12‐month‐old mice are parts of our previous publication 30. Results are means ± SEM.
Table 1.
Upstream regulators of the 148 MF‐consistent genes with a p‐value of overlap < 0.001 and an activation score>2 or repression score←2
| Upstream regulator | Exp fold change | Molecule type | Activation z‐score | p‐value of overlap |
|---|---|---|---|---|
| PXR | Ligand‐dependent nuclear receptor | 3.20 | 2.28 × 10⁻¹³ | |
| Ncoa‐PXR‐Rxra | Complex | 2.00 | 4.50 × 10⁻⁶ | |
| PXR ligand‐PXR‐retinoic acid‐RXRα | Complex | 2.20 | 4.58 × 10⁻⁶ | |
| MED13 | Transcription regulator | –2.00 | 8.38 × 10⁻⁶ | |
| NFE2L2 | Transcription regulator | 2.80 | 2.83 × 10⁻⁵ | |
| PPARG | 1.76 | Ligand‐dependent nuclear receptor | 2.60 | 4.00 × 10⁻⁴ |
| mir‐223 | Microrna | 2.00 | 9.24 × 10⁻⁴ |
In Fig. 5E expression profiles of Hsd3b5, Cd36, and Pparγ are shown, representing three examples of genes of the subset of 148 consistently altered genes (qPCR validation and additional examples are presented in Supporting Information Fig. S3A, B). Interestingly, for most of the genes displaying consistent changes induced by the MF diet, significant differential expression between the INT‐ and MF‐exposed mice started at a younger age (6 or 12 months), e.g. Cd36, Pparγ, and Cidea. Figure 5F presents the expression levels of Cyp2u1, Lpl, and Clec10a, showing that the mean expression levels in the MF/INT‐exposed animals differs strongly from the life‐long MF‐exposed mice. For these genes of which the expression levels adapted to the INT diet, no marked changes were found between young MF‐ and INT‐exposed animals (qPCR validation and additional examples are presented in Supporting Information Fig. S3C, D). By analyzing the age‐related effect of the 148 consistently altered genes in more detail we found that 43% of these genes showed a MF‐induced change in gene expression at young age (6 or 12 months) while this was found for only 9% of the 1510 adaptive genes.
In conclusion, differential expression regulation of irreversible altered genes might have an onset earlier in life than the genes of which expression levels adapt to the INT diet.
4. Discussion
In this study, we explored whether life‐long intermittent CR could prevent against the adverse health effects induced by a MF diet in aging mice. During the last decade the health‐promoting and life‐extending effects of a wide variety of variants of a standard CR diet have been examined in both humans and models species 29, 57, 58, 59, 60, 61, 62. The major differences between the dietary variants of intermittent calorie restriction are (1) the extent of calorie reduction varying from complete fasting to a mild decrease in calorie intake and (2) the time window when the fasting/CR is applied in combination with the period in between the fasting/CR cycles. We define our INT dietary regimen as periods of one week of CR and refeeding, in order to allow the body to adapt to the two dietary conditions. Our results obtained from the food intake measurements at middle 30 and old age (Supporting Information Fig. 1C) revealed that the mice displayed hyperphagia during the ad libitum feeding but returned voluntarily to normal rations at the end of the week, indicating that this adaptive response was achieved. To attain the strongest adaptation in weight loss that did not exceed the guidelines of the “Committee for Care and Use of Laboratory Animals” (less than 20% loss of body weight/week) we have included a 40E% calorie reduction. During the experiment the INT‐fed mice weekly lose or gain ∼15% of their body weight. This fluctuating pattern is maintained from 9 weeks till 24 months of age, which is much longer than the time interval applied in most other studies examining intermittent fasting/CR 9, 17, 30, 63, 64 and allows us to explore the effects induced at both young and old age. To check whether this dietary variant could prevent against the adverse health effects caused by an obesogenic diet during the ad libitum feeding week we included a MF instead of a control diet. The results we present show that, although the mean energy intake of the INT‐exposed over a two‐week time interval mice was only marginally (7%) reduced compared to the MF‐exposed mice, the 24‐month‐old mice display (1) a significant decrease in body weight, (2) a better fat/lean body mass ratio, (3) an improved glucose metabolism, and (4) an increased survival. However, it should be noted that, apart from glucose metabolism, continuously CR‐exposed mice performed better on all features compared with the INT intervention group. This result indicates that the INT diet applied in this study is insufficient to reach the same health and life‐span promoting effects as achieved by the CR diet, but largely restores the serious health effects induced by the MF diet. This is in agreement with previous findings, in which the application of intermittent CR provides protection against prostate cancer, mammary tumorigenesis, and pancreatic cancer 65, 66, 67, 68.
It is important to note that with the relatively extreme variant of this INT diet we exposed the mice to multiple challenges. In line with previous publications [26, 27, 28, 29, 69] it can be hypothesized that the health‐ and life‐span extending effects are not necessarily derived from the energy reduction only, but that intermittent exposure to challenges might have an additional health‐promoting effect. Apart from exposure to alternating energy availability in this study the gastrointestinal tract as well as metabolic organs like the liver, were challenged to handle variations in carbohydrate and fat content. Another challenge the INT mice were exposed to was the food exposure time. During the CR week one portion of food was offered 30 min prior to the initiation of the dark‐phase and the mice consumed the whole portion (almost all) at once. In contrast, during the MF‐week the mice had continuous access to food. Furthermore, it is important to take into consideration that the daily activity of the INT‐exposed mice appeared to differ significantly from the MF‐exposed mice. We have previously reported an increase in daily activity in life‐long CR‐exposed mice in this cohort 41 in line with what has been reported earlier 6. Since exercise is an important factor regulating health, this feature might very likely contribute to the health improving effects induced by the INT and CR diet. Intriguingly, the increase in daily activity in the INT‐fed compared to the MF‐exposed mice was not only observed in the restricted feeding week, due to foraging activity when hungry, but the same enhanced level of activity was also measured during the ad libitum feeding week. This result suggests that the increased activity can be seen as a habit more than a response to the lack of availability of food. These data also indicate that performing physical activity measurements in animal studies exploring the effects of dietary interventions is of utmost important to determine whether altered daily activity might play a (causal) role in diet‐induced health‐ and lifespan promoting effects.
The effects of the INT diet were analyzed in more detail in the liver, a central organ in the regulation of metabolic health. NAFLD frequently occurs in obese individuals and is recognized as the hepatic manifestation of metabolic syndrome 70. In the 24‐month‐old MF‐exposed mice, increased IHTG, greater liver inflammation, enhanced liver 4‐hydroxyproline levels and elevated plasma ALT levels indicate the presence of advanced stages of NAFLD. Life‐long exposure to the CR diet fully protected against NAFLD development. INT‐fed mice display significant decreases in markers representing the advanced stages of NAFLD (ALT, liver inflammation, and liver fibrosis) compared with the MF‐exposed mice. INT‐exposed mice, however, display mild steatosis with IHTG levels significantly lower than the MF‐exposed mice. This result differs from what we previously have observed in 12‐month‐old mice where the INT diet improved liver health even beyond the effect achieved by the CR diet 30. Figure 6 presents an overview of physiological markers measured in the INT‐exposed animals during aging. In this figure the degree of similarity of the INT‐exposed animals at the age of 12 and 24 month compared to the continuous CR and MF diets is depicted for all markers apart from survival for which only 24 months value is depicted (since almost all mice were alive at 12 months of age). At both 12 and 24 months of age, the body weights of INT‐exposed animals were between those of CR‐ and MF‐fed animals wile food intake levels increased. With aging, plasma insulin and IL‐6 levels of animals in the INT diet group became more comparable with the profiles of the CR group while relative leptin levels did not alter. Furthermore, unlike in the continuous MF‐exposed animals, NAFLD in the INT diet group did not progress to severe pathology, as indicated by the liver 4‐hydroxyproline content. A small increase in relative plasma ALT levels was observed. In contrast, IHTG levels substantially elevated during aging, reaching a level similar to that of the MF group at the age of 24 months. The results we present here indicate that, in the long run, an INT diet protects the liver for the advanced stages of NAFLD but does not fully prevent MF‐induced lipid accumulation at older age. This suggests that the metabolic capacity required for the modulation of liver fat content by catabolism and redistribution at old age might be impaired. This result is in line with previous studies that have indicated that aging is a risk factor for fat accumulation in the liver 71, 72.
Figure 6.
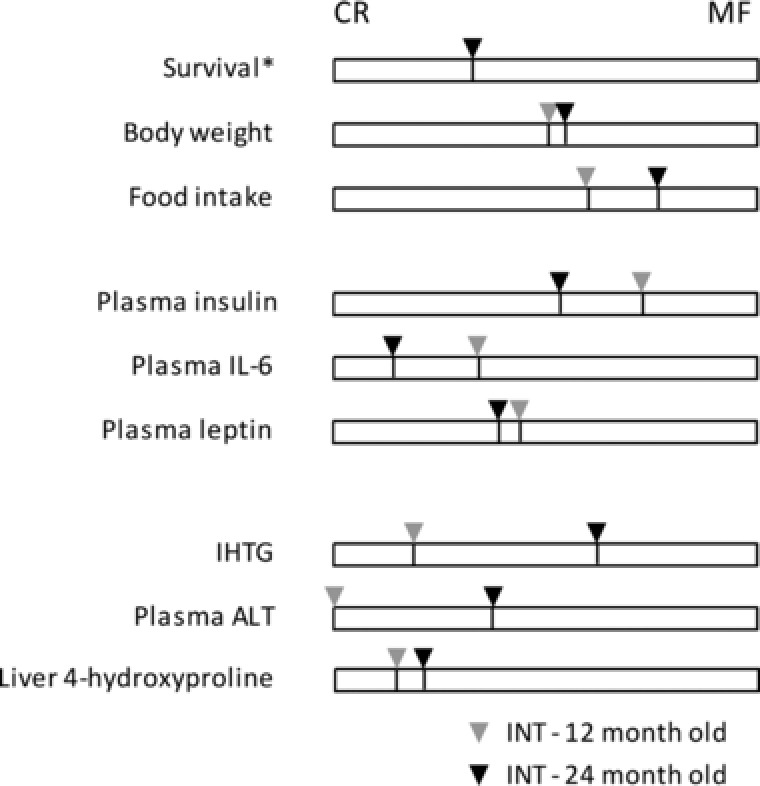
Feature similarity of the INT diet group at 12 and 24 months in comparison to the CR and MF groups. The bars represent the difference between the CR and MF groups, which was set as 100% for each time point. Then, the position of the INT‐exposed group within the 100% scale was determined and represented by the line and pointer. The survival bar included only the 24 M pointer since hardly any mice died at this age.
Gene expression profiles generated from the liver of the 24‐month‐old INT‐exposed mice revealed that gene expression in these animals appeared to be more similar to the CR than to the MF‐exposed mice, underscoring the beneficial effects of the INT diet on metabolic health. This size of effect is remarkably large, considering that previous findings have shown that the effect of CR diet on the liver transcriptomic profile is rapidly blunted following an ad libitum refeeding 73, 74. This suggests that the effects of long‐term repeated exposure to CR might accumulate and eventually result in a profile more similar to CR diet, instead of the MF diet. Functional analysis of the differentially expressed genes further confirmed that intermittent CR affects pathways involved in liver fibrosis and cirrhosis and the advanced stages of NAFLD. Taken together, strong improvement in total body and liver health was caused by regular, short‐term exposure to a CR diet. The INT diet almost completely counteracts the adverse health effects of the MF diet, which these mice consumed for half of their life. However, despite of the additional challenges these mice have been exposed to in addition to the reduction in energy intake, the effects did not reach the standards achieved by a life‐long CR diet.
CR interventions are often applied to achieve weight loss in overweight and obese subjects 75, 76, 77. In the second part of our study, we explored into what extent, the molecular effects induced by a MF diet in the liver during the first 12 months of life, can be reversed by exposure to the INT diet during the second 12 months of life. Glucose tolerance is markedly increased in the diet switch group that is in agreement with a recent study where obese mice were exposed to a high‐fat alternating‐day fasting regimen that showed improved glucose tolerance 78.
Microarray analysis exhibited significant differential expression of 2815 genes between 24‐month‐old MF and INT intervention groups. Analysis of the gene expression levels in the MF/INT diet switch group revealed that the majority of these 2815 differentially expressed genes partially (1157 genes) or fully (1510 genes) adopted to the INT expression profile. IPA analysis showed that the subset of 1510 reversible genes represent predominantly inflammation‐related pathways. Similarly, a decrease in plasma ALT levels and liver lymphocyte aggregates and fibrosis was observed in the diet switch mice, although these effects were not significant. Expression levels of a relative small subset of genes (148), however, appeared consistently changed by exposure to the MF diet during the first 12 months of life. IPA showed that this subset of 148 genes encompasses genes involving lipid and xenobiotic metabolic processes. The observation that PXR (or NR1I2) was the strongest predicted upstream regulator, suggests a connection between these two functions. PXR is a ligand‐activated nuclear receptor that, upon activation, forms a heterodimer with RXR. This complex is not only activated by exogenous toxins but has also been shown to responds to endobiotics like bile acids and steroid hormones 79, 80. Previous studies have shown that PXR activation in mice induces fatty acids uptake via upregulation of Cd36, which is one of the 148 consistently regulated genes. Additionally, other genes involved in lipid metabolism including Pparγ, Cyp7b1, Cidea, and Cidec are consistently upregulated in the MF/INT diet switch mice. This persistently regulated lipid metabolism and/or storage genes might “set” the homeostasis to be either inefficient in transporting and oxidizing fatty acids or susceptible to fat accumulation. With respect to the PXR target genes involved in xenobiotic metabolism, it should be noted that a large number of genes are consistently upregulated by the MF diet including Gstm1, Gstm5, Fmo1, Fmo2, Fmo3, Abcc3, Cyp3a5, etc., indicating strongly enhanced xenobiotic and/or endobiotic metabolism in both the MF‐exposed and the diet switch mice. Another example of a gene persistently altered by the MF diet that might contribute to the development of liver dysfunction is Ubiquitin‐conjugating enzyme 2c (Ube2c). Ube2c has been identified as a hepatocellular carcinoma gene 81, 82 and we observed elevated expression of Ube2c already at the age of 6 months in the MF‐exposed mice (Supporting Information Fig. 3B) but the INT diet appears to reverse this effect at young age. Importantly, overexpression of Ube2c has been shown to induce loss of genomic stability, since the cells neglect the mitotic spindle checkpoint signals 83. Therefore, the persistent effect of the MF diet on the expression of this gene might have serious consequences on liver health and might enhance the risk on hepatocellular carcinoma development. Additional research is required to validate this observation. Taken together these results suggest that, after a strong weight loss, robust reductions in the advanced stages of NAFLD can be achieved but that hepatic steatosis might not be fully reversible at old age.
In conclusion, our data indicate that intermittent CR offers significant health improving effects and largely counteracts the adverse effects of a MF diet on the liver, but does not reach the health‐ and life span improving effects of a CR diet. Although the number of consistent molecular changes induced in the liver by a MF diet is small, they might have potentially important adverse effects on health.
Supporting information
Supporting Information Figure S1 (A) Food intake was measured during one week for ±20 mice per intervention group. For the INT and the MF/INT groups food intake during the ad libitum MF week and during 40E% CR week are presented; (B) Actogram presenting the mean daily activity of mice from the different intervention groups recorded during 3 executive days; (C) Leptin, IL6, FFA and TG levels were measured in plasma isolated from the sacrificed mice; (D) Weight of the indicated organs was measured when the mice were sacrificed.
Supporting Information Figure S2. Formalin‐fixed and paraffin‐embedded cross‐sections (5μm) of the liver lobe was stained with haematoxylin and eosin. The results of 4 representative examples of the different intervention groups show hepatic steatosis in mice of the C and MF groups and also, but to a lesser extent, in the INT‐exposed mice. No lipid accumulation was detected in the life‐long CR‐exposed animals.
Supporting Information Table S1. Composition of the different diets
Supporting Information Table S2. Pathological report of the cause of death or eutanisation of the mice in the different intervention groups.
Supporting Information Table S3. Top‐25 up‐ and down‐regulated genes in 24‐month‐old INT‐fed mice compared to CR and MF‐exposed mice of the same age respectively
Supporting Information Table S4. 148 genes displaying differential expression between MF and INT‐exposed mice revealing that do not addapt to the INT diet in the MF/INT diet switch group
Supporting Information Table S5. 1510 genes displaying differential expression between MF and INT‐exposed mice revealing adaptation to the INT diet in the MF/INT diet switch group
Acknowledgments
This work was financially supported by the European Union's Seventh Framework Programme IDEAL (FP7/2007‐2011) under grant agreement no: 259679.
Conceived and designed the experiments: F.R., M.M., and W.T.S. Performed the experiments: F.R., C.L., M.V.B., M.vD., A.L.M., and W.T.S. Analyzed the data: W.T.S., F.R., M.V.B., M.vD., A.L.M., K.vN. Assessed quality control of microarrays: M.V.B. Wrote the paper: F.R. and W.T.S. Provided valuable feedback on manuscript: K.vN., M.V.B., M.vD., A.L.M., M.M. All authors read and approved the final manuscript. The copyright line for this article was changed on 17 August 2018 after original online publication.
Miriam van Dijk and Klaske van Norren are affiliated with Nutricia Research. Aswin L. Menke is affiliated with Triskelion. The other authors declare that they have no competing interests.
Rusli F., Lute C., Boekschoten M. V., Menke A. L., Müller M., Steegenga W. T., Mol. Nutr. Food Res. 2017, 61, 1600677.
5 References
- 1. WHO , 2016.
- 2. Sullivan, S. , Implications of diet on nonalcoholic fatty liver disease. Curr. Opin. Gastroenterol. 2010, 26, 160–164. [DOI] [PMC free article] [PubMed] [Google Scholar]
- 3. Thoma, C. , Day, C. P. , Trenell, M. I. , Lifestyle interventions for the treatment of non‐alcoholic fatty liver disease in adults: a systematic review. J. Hepatol. 2012, 56, 255–266. [DOI] [PubMed] [Google Scholar]
- 4. Fontana, L. , Partridge, L. , Longo, V. D. , Extending healthy life span—from yeast to humans. Science 2010, 328, 321–326. [DOI] [PMC free article] [PubMed] [Google Scholar]
- 5. Fontana, L. , Partridge, L. , Promoting health and longevity through diet: from model organisms to humans. Cell 2015, 161, 106–118. [DOI] [PMC free article] [PubMed] [Google Scholar]
- 6. Speakman, J. R. , Mitchell, S. E. , Caloric restriction. Mol. Aspects Med. 2011, 32, 159–221. [DOI] [PubMed] [Google Scholar]
- 7. Ingram, D. K. , Roth, G. S. , Calorie restriction mimetics: can you have your cake and eat it, too? Ageing Res. Rev. 2015, 20, 46–62. [DOI] [PubMed] [Google Scholar]
- 8. Fairburn, C. G. , Harrison, P. J. , Eating disorders. Lancet 2003, 361, 407–416. [DOI] [PubMed] [Google Scholar]
- 9. Hunt, N. D. , Li, G. D. , Zhu, M. , Miller, M. et al., Effect of calorie restriction and refeeding on skin wound healing in the rat. Age 2012, 34, 1453–1458. [DOI] [PMC free article] [PubMed] [Google Scholar]
- 10. Kristan, D. M. , Calorie restriction and susceptibility to intact pathogens. Age 2008, 30, 147–156. [DOI] [PMC free article] [PubMed] [Google Scholar]
- 11. Martin, B. , Pearson, M. , Kebejian, L. , Golden, E. et al., Sex‐dependent metabolic, neuroendocrine, and cognitive responses to dietary energy restriction and excess. Endocrinology 2007, 148, 4318–4333. [DOI] [PMC free article] [PubMed] [Google Scholar]
- 12. Gotthardt, J. D. , Verpeut, J. L. , Yeomans, B. L. , Yang, J. A. et al., Intermittent fasting promotes fat loss with lean mass retention, increased hypothalamic norepinephrine content, and increased neuropeptide Y gene expression in diet‐induced obese male mice. Endocrinology 2016, 157, 679–691. [DOI] [PMC free article] [PubMed] [Google Scholar]
- 13. Varady, K. A. , Roohk, D. J. , Loe, Y. C. , McEvoy‐Hein, B. K. et al., Effects of modified alternate‐day fasting regimens on adipocyte size, triglyceride metabolism, and plasma adiponectin levels in mice. J. Lipid Res. 2007, 48, 2212–2219. [DOI] [PubMed] [Google Scholar]
- 14. Rogozina, O. P. , Bonorden, M. J. , Seppanen, C. N. , Grande, J. P. et al., Effect of chronic and intermittent calorie restriction on serum adiponectin and leptin and mammary tumorigenesis. Cancer Prev. Res. 2011, 4, 568–581. [DOI] [PMC free article] [PubMed] [Google Scholar]
- 15. Mager, D. E. , Wan, R. , Brown, M. , Cheng, A. et al., Caloric restriction and intermittent fasting alter spectral measures of heart rate and blood pressure variability in rats. FASEB. J. 2006, 20, 631–637. [DOI] [PubMed] [Google Scholar]
- 16. Wan, R. , Camandola, S. , Mattson, M. P. , Intermittent fasting and dietary supplementation with 2‐deoxy‐D‐glucose improve functional and metabolic cardiovascular risk factors in rats. FASEB. J. 2003, 17, 1133–1134. [DOI] [PubMed] [Google Scholar]
- 17. Brandhorst, S. , Choi, I. Y. , Wei, M. , Cheng, C. W. et al., A periodic diet that mimics fasting promotes multi‐system regeneration, enhanced cognitive performance, and healthspan. Cell Metabol. 2015, 22, 86–99. [DOI] [PMC free article] [PubMed] [Google Scholar]
- 18. Fontan‐Lozano, A. , Saez‐Cassanelli, J. L. , Inda, M. C. , de los Santos‐Arteaga, M. et al., Caloric restriction increases learning consolidation and facilitates synaptic plasticity through mechanisms dependent on NR2B subunits of the NMDA receptor. J. Neurosci. 2007, 27, 10185–10195. [DOI] [PMC free article] [PubMed] [Google Scholar]
- 19. Singh, R. , Lakhanpal, D. , Kumar, S. , Sharma, S. et al., Late‐onset intermittent fasting dietary restriction as a potential intervention to retard age‐associated brain function impairments in male rats. Age 2012, 34, 917–933. [DOI] [PMC free article] [PubMed] [Google Scholar]
- 20. Lee, C. , Longo, V. D. , Fasting vs dietary restriction in cellular protection and cancer treatment: from model organisms to patients. Oncogene 2011, 30, 3305–3316. [DOI] [PubMed] [Google Scholar]
- 21. Safdie, F. , Brandhorst, S. , Wei, M. , Wang, W. et al., Fasting enhances the response of glioma to chemo‐ and radiotherapy. PLoS One 2012, 7, e44603. [DOI] [PMC free article] [PubMed] [Google Scholar]
- 22. Cleary, M. P. , Jacobson, M. K. , Phillips, F. C. , Getzin, S. C. et al., Weight‐cycling decreases incidence and increases latency of mammary tumors to a greater extent than does chronic caloric restriction in mouse mammary tumor virus‐transforming growth factor‐alpha female mice. Cancer Epidemiol. Biomarkers Prev. 2002, 11, 836–843. [PubMed] [Google Scholar]
- 23. Pape‐Ansorge, K. A. , Grande, J. P. , Christensen, T. A. , Maihle, N. J. et al., Effect of moderate caloric restriction and/or weight cycling on mammary tumor incidence and latency in MMTV‐Neu female mice. Nutr. Cancer 2002, 44, 162–168. [DOI] [PubMed] [Google Scholar]
- 24. Calabrese, E. J. , Baldwin, L. A. , Defining hormesis. Hum. Exp. Toxicol. 2002, 21, 91–97. [DOI] [PubMed] [Google Scholar]
- 25. Rattan, S. I. , Principles and practice of hormetic treatment of aging and age‐related diseases. Hum. Exp. Toxicol. 2008, 27, 151–154. [DOI] [PubMed] [Google Scholar]
- 26. Chaix, A. , Zarrinpar, A. , Miu, P. , Panda, S. , Time‐restricted feeding is a preventative and therapeutic intervention against diverse nutritional challenges. Cell Metab. 2014, 20, 991–1005. [DOI] [PMC free article] [PubMed] [Google Scholar]
- 27. Mattson, M. P. , Challenging oneself intermittently to improve health. Dose Response 2014, 12, 600–618. [DOI] [PMC free article] [PubMed] [Google Scholar]
- 28. Mattson, M. P. , Allison, D. B. , Fontana, L. , Harvie, M. et al., Meal frequency and timing in health and disease. Proc. Natl. Acad. Sci. USA 2014, 111, 16647–16653. [DOI] [PMC free article] [PubMed] [Google Scholar]
- 29. Longo, V. D. , Panda, S. , Fasting, circadian rhythms, and time‐restricted feeding in healthy lifespan. Cell Metab. 2016, 23, 1048–1059. [DOI] [PMC free article] [PubMed] [Google Scholar]
- 30. Rusli, F. , Boekschoten, M. V. , Zubia, A. A. , Lute, C. et al., A weekly alternating diet between caloric restriction and medium fat protects the liver from fatty liver development in middle‐aged C57BL/6J mice. Mol. Nutr. Food Res. 2014, 59, 533–543. [DOI] [PMC free article] [PubMed] [Google Scholar]
- 31. Fisher, C. P. , Kierzek, A. M. , Plant, N. J. , Moore, J. B. , Systems biology approaches for studying the pathogenesis of non‐alcoholic fatty liver disease. World J. Gastroenterol. 2014, 20, 15070–15078. [DOI] [PMC free article] [PubMed] [Google Scholar]
- 32. Pais, R. , Charlotte, F. , Fedchuk, L. , Bedossa, P. et al., A systematic review of follow‐up biopsies reveals disease progression in patients with non‐alcoholic fatty liver. J. Hepatol. 2013, 59, 550–556. [DOI] [PubMed] [Google Scholar]
- 33. De Minicis, S. , Day, C. , Svegliati‐Baroni, G. , From NAFLD to NASH and HCC: pathogenetic mechanisms and therapeutic insights. Curr. Pharm. Des. 2013, 19, 5239–5249. [PubMed] [Google Scholar]
- 34. Argo, C. K. , Caldwell, S. H. , Epidemiology and natural history of non‐alcoholic steatohepatitis. Clin. Liver Dis. 2009, 13, 511–531. [DOI] [PubMed] [Google Scholar]
- 35. Gan, L. , Chitturi, S. , Farrell, G. C. , Mechanisms and implications of age‐related changes in the liver: nonalcoholic Fatty liver disease in the elderly. Curr. Gerontol. Geriatr. Res. 2011, 2011, 831536. [DOI] [PMC free article] [PubMed] [Google Scholar]
- 36. Sheedfar, F. , Di Biase, S. , Koonen, D. , Vinciguerra, M. , Liver diseases and aging: friends or foes? Aging Cell 2013, 12, 950–954. [DOI] [PubMed] [Google Scholar]
- 37. Tajiri, K. , Shimizu, Y. , Liver physiology and liver diseases in the elderly. World J. Gastroenterol. 2013, 19, 8459–8467. [DOI] [PMC free article] [PubMed] [Google Scholar]
- 38. Rakhshandehroo, M. , Sanderson, L. M. , Matilainen, M. , Stienstra, R. et al., Comprehensive analysis of PPARalpha‐dependent regulation of hepatic lipid metabolism by expression profiling. PPAR Res. 2007, 2007, 26839. [DOI] [PMC free article] [PubMed] [Google Scholar]
- 39. Rusli, F. , Deelen, J. , Andriyani, E. , Boekschoten, M. V. et al., Fibroblast growth factor 21 reflects liver fat accumulation and dysregulation of signalling pathways in the liver of C57BL/6J mice. Sci. Rep. 2016, 6, 30484. [DOI] [PMC free article] [PubMed] [Google Scholar]
- 40. van Dijk, M. , Dijk, F. J. , Bunschoten, A. , van Dartel, D. A. et al., Improved muscle function and quality after diet intervention with leucine‐enriched whey and antioxidants in antioxidant deficient aged mice. Oncotarget 2016, 7, 17338–17355. [DOI] [PMC free article] [PubMed] [Google Scholar]
- 41. van Norren, K. , Rusli, F. , van Dijk, M. , Lute, C. et al., Behavioural changes are a major contributing factor in the reduction of sarcopenia in caloric‐restricted ageing mice. J. Cachexia Sarcopenia Muscle 2015, 6, 253–268. [DOI] [PMC free article] [PubMed] [Google Scholar]
- 42. Lin, K. , Kools, H. , de Groot, P. J. , Gavai, A. K. et al., MADMAX—management and analysis database for multiple ∼omics experiments. J. Integr. Bioinform. 2011, 8, 160. [DOI] [PubMed] [Google Scholar]
- 43. Bolstad, B. M. , Irizarry, R. A. , Astrand, M. , Speed, T. P. , A comparison of normalization methods for high density oligonucleotide array data based on variance and bias. Bioinformatics 2003, 19, 185–193. [DOI] [PubMed] [Google Scholar]
- 44. Irizarry, R. A. , Bolstad, B. M. , Collin, F. , Cope, L. M. et al., Summaries of Affymetrix GeneChip probe level data. Nucleic Acids Res. 2003, 31, e15. [DOI] [PMC free article] [PubMed] [Google Scholar]
- 45. Dai, M. , Wang, P. , Boyd, A. D. , Kostov, G. et al., Evolving gene/transcript definitions significantly alter the interpretation of GeneChip data. Nucleic Acids Res. 2005, 33, e175. [DOI] [PMC free article] [PubMed] [Google Scholar]
- 46. Saeed, A. I. , Bhagabati, N. K. , Braisted, J. C. , Liang, W. et al., TM4 microarray software suite. Methods Enzymol. 2006, 411, 134–193. [DOI] [PubMed] [Google Scholar]
- 47. Saeed, A. I. , Sharov, V. , White, J. , Li, J. et al., TM4: a free, open‐source system for microarray data management and analysis. Biotechniques 2003, 34, 374–378. [DOI] [PubMed] [Google Scholar]
- 48. Sartor, M. A. , Tomlinson, C. R. , Wesselkamper, S. C. , Sivaganesan, S. et al., Intensity‐based hierarchical Bayes method improves testing for differentially expressed genes in microarray experiments. BMC Bioinform. 2006, 7, 538. [DOI] [PMC free article] [PubMed] [Google Scholar]
- 49. Liang, W. , Menke, A. L. , Driessen, A. , Koek, G. H. et al., Establishment of a general NAFLD scoring system for rodent models and comparison to human liver pathology. PLoS One 2014, 9, e115922. [DOI] [PMC free article] [PubMed] [Google Scholar]
- 50. Hillebrandt, S. , Wasmuth, H. E. , Weiskirchen, R. , Hellerbrand, C. et al., Complement factor 5 is a quantitative trait gene that modifies liver fibrogenesis in mice and humans. Nat. Genet. 2005, 37, 835–843. [DOI] [PubMed] [Google Scholar]
- 51. Wang, X. , Seed, B. , A PCR primer bank for quantitative gene expression analysis. Nucleic Acids Res. 2003, 31, e154. [DOI] [PMC free article] [PubMed] [Google Scholar]
- 52. Nguyen, T. , Nioi, P. , Pickett, C. B. , The Nrf2‐antioxidant response element signaling pathway and its activation by oxidative stress. J. Biol. Chem. 2009, 284, 13291–13295. [DOI] [PMC free article] [PubMed] [Google Scholar]
- 53. Malhi, H. , Kaufman, R. J. , Endoplasmic reticulum stress in liver disease. J. Hepatol. 2011, 54, 795–809. [DOI] [PMC free article] [PubMed] [Google Scholar]
- 54. Tsutsumi, A. , Motoshima, H. , Kondo, T. , Kawasaki, S. et al., Caloric restriction decreases ER stress in liver and adipose tissue in ob/ob mice. Biochem. Biophys. Res. Commun. 2011, 404, 339–344. [DOI] [PubMed] [Google Scholar]
- 55. Hayhurst, G. P. , Lee, Y. H. , Lambert, G. , Ward, J. M. et al., Hepatocyte nuclear factor 4alpha (nuclear receptor 2A1) is essential for maintenance of hepatic gene expression and lipid homeostasis. Mol. Cell Biol. 2001, 21, 1393–1403. [DOI] [PMC free article] [PubMed] [Google Scholar]
- 56. Schloesser, A. , Campbell, G. , Gluer, C. C. , Rimbach, G. et al., Restriction on an energy‐dense diet improves markers of metabolic health and cellular aging in mice through decreasing hepatic mTOR activity. Rejuvenation Res. 2015, 18, 30–39. [DOI] [PMC free article] [PubMed] [Google Scholar]
- 57. Longo, V. D. , Mattson, M. P. , Fasting: molecular mechanisms and clinical applications. Cell Metab. 2014, 19, 181–192. [DOI] [PMC free article] [PubMed] [Google Scholar]
- 58. Rothschild, J. , Hoddy, K. K. , Jambazian, P. , Varady, K. A. , Time‐restricted feeding and risk of metabolic disease: a review of human and animal studies. Nutr. Rev. 2014, 72, 308–318. [DOI] [PubMed] [Google Scholar]
- 59. Harvie, M. N. , Howell, T. , Could intermittent energy restriction and intermittent fasting reduce rates of cancer in obese, overweight, and normal‐weight subjects? A summary of evidence. Adv. Nutr. 2016, 7, 690–705. [DOI] [PMC free article] [PubMed] [Google Scholar]
- 60. Horne, B. D. , Muhlestein, J. B. , Anderson, J. L. , Health effects of intermittent fasting: hormesis or harm? A systematic review. Am. J. Clin. Nutr. 2015, 102, 464–470. [DOI] [PubMed] [Google Scholar]
- 61. Nair, P. M. , Khawale, P. G. , Role of therapeutic fasting in women's health: an overview. J. Midlife Health 2016, 7, 61–64. [DOI] [PMC free article] [PubMed] [Google Scholar]
- 62. Tinsley, G. M. , La Bounty, P. M. , Effects of intermittent fasting on body composition and clinical health markers in humans. Nutr. Rev. 2015, 73, 661–674. [DOI] [PubMed] [Google Scholar]
- 63. Anson, R. M. , Guo, Z. , de Cabo, R. , Iyun, T. et al., Intermittent fasting dissociates beneficial effects of dietary restriction on glucose metabolism and neuronal resistance to injury from calorie intake. Proc. Natl. Acad. Sci. USA 2003, 100, 6216–6220. [DOI] [PMC free article] [PubMed] [Google Scholar]
- 64. Varady, K. A. , Hudak, C. S. , Hellerstein, M. K. , Modified alternate‐day fasting and cardioprotection: relation to adipose tissue dynamics and dietary fat intake. Metabolism 2009, 58, 803–811. [DOI] [PubMed] [Google Scholar]
- 65. Bonorden, M. J. L. , Rogozina, O. P. , Grossmann, M. E. , Kluczny, C. M. et al., Intermittent caloric restriction delays prostate tumor detection and increases survival time in TRAMP mice. Cancer Epidemiol. Biomarkers Prev. 2006, 15, B224–B224. [DOI] [PubMed] [Google Scholar]
- 66. Rogozina, O. P. , Bonorden, M. J. L. , Grande, J. P. , Cleary, M. P. , Serum Insulin‐like growth factor‐I and mammary tumor development in ad libitum–fed, chronic calorie–restricted, and intermittent calorie–restricted MMTV‐TGF‐α Mice. Cancer Prev. Res. 2009, 2, 712–719. [DOI] [PubMed] [Google Scholar]
- 67. Rogozina, O. P. , Bonorden, M. J. L. , Seppanen, C. N. , Grande, J. P. et al., Effect of chronic and intermittent calorie restriction on serum adiponectin and leptin and mammary tumorigenesis. Cancer Prev. Res. 2011, 4, 568–581. [DOI] [PMC free article] [PubMed] [Google Scholar]
- 68. Lanza‐Jacoby, S. , Yan, G. , Radice, G. , LePhong, C. et al., Calorie restriction delays the progression of lesions to pancreatic cancer in the LSL‐KrasG12D; Pdx‐1/Cre mouse model of pancreatic cancer. Exp. Biol. Med. 2013, 238, 787–797. [DOI] [PubMed] [Google Scholar]
- 69. Varady, K. A. , Meal frequency and timing: impact on metabolic disease risk. Curr. Opin. Endocrinol. Diabetes Obes. 2016, 23, 379–383. [DOI] [PubMed] [Google Scholar]
- 70. Paschos, P. , Paletas, K. , Nonalcoholic fatty liver disease and metabolic syndrome. Hippokratia 2009, 13, 9–19. [PMC free article] [PubMed] [Google Scholar]
- 71. Duseja, A. , Chalasani, N. , Epidemiology and risk factors of nonalcoholic fatty liver disease (NAFLD). Hepatol. Int. 2013, 7(Suppl 2), 755–764. [DOI] [PubMed] [Google Scholar]
- 72. Nunes‐Souza, V. , Cesar‐Gomes, C. J. , Da Fonseca, L. J. , Guedes Gda, S. et al., Aging increases susceptibility to high fat diet‐induced metabolic syndrome in C57BL/6 mice: improvement in glycemic and lipid profile after antioxidant therapy. Oxid. Med. Cell. Longev. 2016, 2016, 1987960. [DOI] [PMC free article] [PubMed] [Google Scholar]
- 73. Dhahbi, J. M. , Kim, H.‐J. , Mote, P. L. , Beaver, R. J. et al., Temporal linkage between the phenotypic and genomic responses to caloric restriction. Proc. Nat. Acad. Sci. USA 2004, 101, 5524–5529. [DOI] [PMC free article] [PubMed] [Google Scholar]
- 74. Giller, K. , Huebbe, P. , Hennig, S. , Dose, J. et al., Beneficial effects of a 6‐month dietary restriction are time‐dependently abolished within 2 weeks or 6 months of refeeding—genome‐wide transcriptome analysis in mouse liver. Free Rad. Biol. Med. 2013, 61, 170–178. [DOI] [PubMed] [Google Scholar]
- 75. Thoma, C. , Day, C. P. , Trenell, M. I. , Lifestyle interventions for the treatment of non‐alcoholic fatty liver disease in adults: a systematic review. J. Hepatol. 2012, 56, 255–266. [DOI] [PubMed] [Google Scholar]
- 76. Ho, M. , Garnett, S. P. , Baur, L. , Burrows, T . et al., Effectiveness of lifestyle interventions in child obesity: systematic review with meta‐analysis. Pediatrics 2012, 130, 1647–1671. [DOI] [PubMed] [Google Scholar]
- 77. Franz, M. J. , Boucher, J. L. , Rutten‐Ramos, S. , VanWormer, J. J. , Lifestyle weight‐loss intervention outcomes in overweight and obese adults with type 2 diabetes: a systematic review and meta‐analysis of randomized clinical trials. J. Acad. Nutr. Dietetics 2015, 115, 1447–1463. [DOI] [PubMed] [Google Scholar]
- 78. Joslin, P. M. , Bell, R. K. , Swoap, S. J. , Obese mice on a high‐fat alternate‐day fasting regimen lose weight and improve glucose tolerance. J. Anim. Physiol. Anim. Nutr. 2016. [DOI] [PubMed] [Google Scholar]
- 79. Naik, A. , Belic, A. , Zanger, U. M. , Rozman, D. , Molecular interactions between NAFLD and xenobiotic metabolism. Front. Genet. 2013, 4, 2. [DOI] [PMC free article] [PubMed] [Google Scholar]
- 80. Cave, M. C. , Clair, H. B. , Hardesty, J. E. , Falkner, K. C. et al., Nuclear receptors and nonalcoholic fatty liver disease. Biochim. Biophys. Acta 2016. [DOI] [PMC free article] [PubMed] [Google Scholar]
- 81. Ieta, K. , Ojima, E. , Tanaka, F. , Nakamura, Y. et al., Identification of overexpressed genes in hepatocellular carcinoma, with special reference to ubiquitin‐conjugating enzyme E2C gene expression. Int. J. Cancer 2007, 121, 33–38. [DOI] [PubMed] [Google Scholar]
- 82. Xie, C. , Powell, C. , Yao, M. , Wu, J. et al., Ubiquitin‐conjugating enzyme E2C: a potential cancer biomarker. Int. J. Biochem. Cell Biol. 2014, 47, 113–117. [DOI] [PubMed] [Google Scholar]
- 83. Hao, Z. , Zhang, H. , Cowell, J. , Ubiquitin‐conjugating enzyme UBE2C: molecular biology, role in tumorigenesis, and potential as a biomarker. Tumour Biol. 2012, 33, 723–730. [DOI] [PubMed] [Google Scholar]
Associated Data
This section collects any data citations, data availability statements, or supplementary materials included in this article.
Supplementary Materials
Supporting Information Figure S1 (A) Food intake was measured during one week for ±20 mice per intervention group. For the INT and the MF/INT groups food intake during the ad libitum MF week and during 40E% CR week are presented; (B) Actogram presenting the mean daily activity of mice from the different intervention groups recorded during 3 executive days; (C) Leptin, IL6, FFA and TG levels were measured in plasma isolated from the sacrificed mice; (D) Weight of the indicated organs was measured when the mice were sacrificed.
Supporting Information Figure S2. Formalin‐fixed and paraffin‐embedded cross‐sections (5μm) of the liver lobe was stained with haematoxylin and eosin. The results of 4 representative examples of the different intervention groups show hepatic steatosis in mice of the C and MF groups and also, but to a lesser extent, in the INT‐exposed mice. No lipid accumulation was detected in the life‐long CR‐exposed animals.
Supporting Information Table S1. Composition of the different diets
Supporting Information Table S2. Pathological report of the cause of death or eutanisation of the mice in the different intervention groups.
Supporting Information Table S3. Top‐25 up‐ and down‐regulated genes in 24‐month‐old INT‐fed mice compared to CR and MF‐exposed mice of the same age respectively
Supporting Information Table S4. 148 genes displaying differential expression between MF and INT‐exposed mice revealing that do not addapt to the INT diet in the MF/INT diet switch group
Supporting Information Table S5. 1510 genes displaying differential expression between MF and INT‐exposed mice revealing adaptation to the INT diet in the MF/INT diet switch group