Abstract
Heat shock protein 70 has been recognized as a target for anticancer therapy. The overexpression of heat shock protein 70 is observed frequently in several types of tumors, including breast cancer. It is involved with increased cell proliferation, poor prognosis, and drug resistance in breast cancer. VER-155008 is an effective inhibitor of heat shock protein 70 that targets the adenosine triphosphatase–binding domain of heat shock protein 70. In this study, the effects of VER-155008, heat shock (43°C, 1 hour), and the combination treatment of VER-155008 and heat shock on the mitochondria of the MCF-7 breast cancer cells were investigated through a laser scanning microscope combined with mitochondrial membrane potential fluorescence probe. We observed broken mitochondria networks, decreased mitochondrial membrane potential, and cell size. The mitochondrial contents were reduced with the VER-155008 treatment and the combination treatment of VER-155008 and heat shock. The effects of the inhibition presented treatment time dependence. Moreover, the effect of the inhibition of the sole VER-155008 was alleviated when it was combined with heat shock although there was no obvious change with the sole heat shock treatment. The results indicated that VER-155008, the inhibitor of heat shock protein 70, induced apoptosis in MCF-7 breast cancer cells whatever it was in the sole or the combined manner, and its promoting apoptosis effect could be alleviated by heat shock. Our findings demonstrated that HSP70 can be a good target for developing breast cancer therapy.
Keywords: heat shock protein 70, VER-155008, heat shock, mitochondrial membrane potential, cell apoptosis, breast cancer cell
Introduction
Heat shock proteins (HSPs) are ubiquitous and highly conserved proteins that are principally stimulated by HS and other stresses in a wide range of species.1 The HSPs have been described as molecular chaperones that assist in protein folding, modification, and transportation.2,3 The HSP70 family is a basic member of HSPs, and it distributes mainly in the cytoplasm, the mitochondria, the endoplasmic reticulum, and the cell nucleus. The HSP70 prevents protein aggregation and refolds unfolded or denatured proteins via ATPase activity in case of stress response.4 Rapid expression of HSP70 in response to cellular stress, including HS, can occur in minutes. It plays an important role in protection against stress-induced apoptosis because of its increased expression and contribution to life-sustaining mechanisms of cells.5
Accumulating evidence has demonstrated that the overexpression of HSP70 is observed frequently in several types of tumors, including breast cancer.6-8 The overexpression of HSP70 can provide a selective survival advantage to tumor cells in part due to its ability to inhibit multiple pathways of cell death, including intrinsic and extrinsic apoptosis.9 And high HSP70 levels predicted lower response of breast cancers to radiation, hyperthermia, and antitumor drug.10,11 Moreover, the overexpression of HSP70 in breast cancer is often involved with increased cell proliferation, poor prognosis, and drug resistance.8
The HSP70 has attracted plenty of attention, and the inhibition of HSP70 is believed to be a promising path in antitumor therapy.12-14 Some compounds that specifically target HSP70 have been invented and have exhibited their antiproliferative activity against cancer but not normal cells.15-17 VER-155008 is an effective HSP70 family inhibitor that targets the ATPase binding domain of HSP70. Previous reports indicated that this ATP analog induced apoptosis in BT474 breast cancer cells and HCT116 colon carcinoma cells18 and inhibited proliferation and cell cycle progression significantly in non-small cell lung cancer cells.19
In this study, the effect of VER-155008 on the mitochondria of MCF-7 breast cancer cells was investigated by a laser scanning microscope equipped with a high numerical aperture (NA) oil objective. We pay our attention to the changes in mitochondria because the mitochondria are the critical elements in response of cellular stress and play an important role in the progression of apoptosis. In addition, the effects of the HS and the combination of VER-155008 and HS on the mitochondria of MCF-7 breast cancer cells were also investigated by membrane potential-dependent fluorescence labeling. The mitochondrial morphology was visualized, and the mitochondrial membrane potential (ΔΨm), the mitochondrial content, and the cell size were quantified through the potential sensor 5,5’,6,6’-Tetrachloro-1,1’,3,3’-tetraethylbenzimidazolylcarbocyanine iodide (JC-1).
Materials and Methods
Cell Culture
MCF-7 human breast cancer cell line was purchased from Keygen (Nanjing, China). Cells were cultured in Dulbecco’s Modified Eagle Medium (Hyclone, Iogan, Utah) supplemented with 10% (vol/vol) heat-inactivated fetal bovine serum (Hyclone), 1% antibiotic–antimycotic solution with 100 U/mL of penicillin and 100 μg/mL of streptomycin (Gibco, Grand Island, New York), and was grown in a humidified incubator (Thermo Fisher Scientific, Waltham, Mass) with 5% CO2 under 37°C. The cells were digested with 0.25% trypsin when the cell abundance was about 80% to 90%. To prepare for the laser scanning microscopy imaging, the single cell suspension was seeded into the 4-chamber glass bottom dishes (35 mm) at a density of 4000 cells/well. Then, the cells were submitted to subsequent experimental processing after keeping in the incubator for 24 hours.
HSP70 Inhibitor and Heat Shock Treatments
Heat Shock Protein 70 inhibitor VER-155008 (Selleck, Houston, Texas) was dissolved with dimethylsulfoxide and diluted in fresh supplemented culture medium at an end concentration of 20 μmol/L for experiment. Heat shock treatment was performed in an incubator (Heal Force, Shanghai, China) with 5% CO2 under 43°C for 1 hour. Then, the cells were kept in the incubator (Thermo) with 5% CO2 under 37°C for 24, 48, and 72 hours, respectively, after the beginning of inhibitor treatment and/or HS treatment. In all experiments, the MCF-7 breast cancer cells without VER-155008 and HS treatments were as control groups.
Mitochondrial Fluorescence Labeling
The mitochondrial membrane potential sensor JC-1 (Sigma, Saint Louis, Missouri) was used to label mitochondria. The JC-1 is a one-excitation and dual-emission peaks potential-sensitive probe for ΔΨm measurement. It forms green fluorescence monomers at low ΔΨm while accumulates as red fluorescence J-aggregates at high ΔΨm. MCF-7 breast cancer cells in the 4-chamber glass bottom dishes were washed with phosphate-buffered saline (PBS) twice and incubated with 5 μmol/L JC-1 solution for 30 minutes in an incubator with 5% CO2 at 37°C. Then the cells were prepared for microscopy imaging after 3 washes with PBS.
Confocal Microscopy Imaging
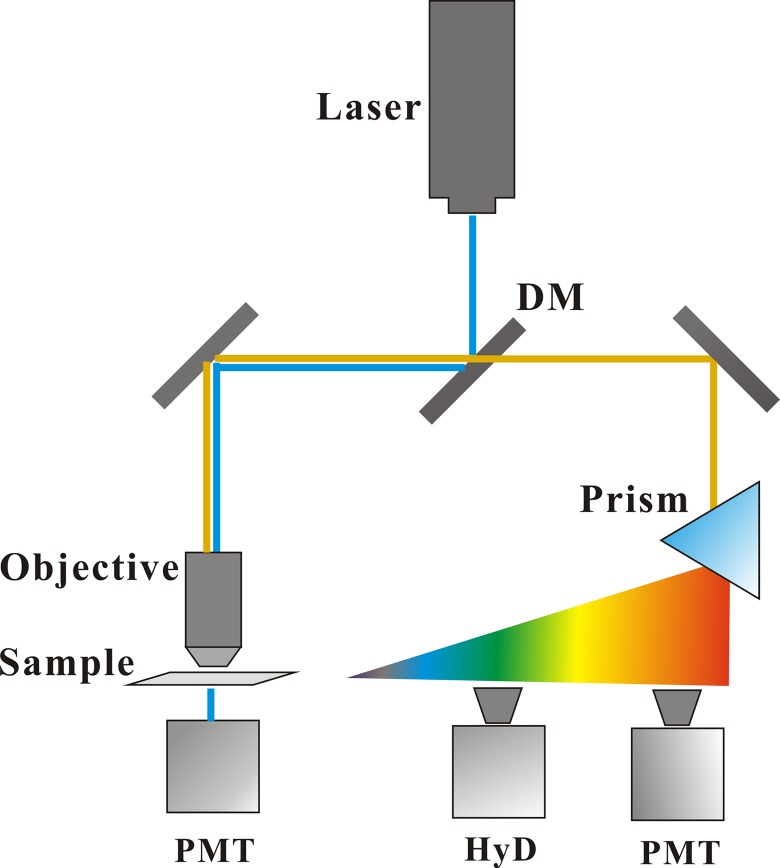
A schematic diagram for fluorescence imaging was shown in Figure 1. An inverted laser scanning microscope (TCS SP8, Leica, Germany) equipped a 100× oil objective (NA = 1.4) was employed to visualize the mitochondria of MCF-7 breast cancer cells. A 488-nm laser was used as excitation light source for mitochondrial fluorescence imaging. In the beam path, the disturbance of excitation light to the fluorescence signal was blocked by a dichroic mirror. A tunable prism-based spectral detection system for 2-channel reflectance fluorescence imaging was used to select the detection wavelength range, covering from 400 to 800 nm. The green fluorescence channel with an extremely light-sensitive HyD detector: 505 to 540 nm, and the red fluorescence channel with a photomultiplier tube (PMT) detector: 565 to 610 nm. Moreover, another PMT for transmittance bright field detection was employed to distinguish the outline of interested cells. According to the experimental content, the acquisition image for ΔΨm analysis was 512 × 512 pixels, zoom = 1, but for the mitochondrial morphology analysis was 1024 × 1024 pixels, zoom = 2.
Figure 1.
Schematic diagram for fluorescence imaging in the mitochondria of MCF-7 cells.
Data and Statistics
The ratio of fluorescence intensities measured in the red fluorescence, and the green fluorescence detection channels was employed to calculate the mitochondrial membrane potential by a custom-made LAS AF software. and indicated the mean fluorescence intensities of the same cell in the red fluorescence and the green fluorescence channels, respectively.
All experimental values were presented as means (standard deviation). Statistical comparisons were made using 1-way analysis of vriance, Students Neuman-Keuls multiple comparisons (SPSS, version16.0, http://www.spss.com). P < .05 was considered to be significant.
Results and Discussion
Fluorescence Imaging of Mitochondria
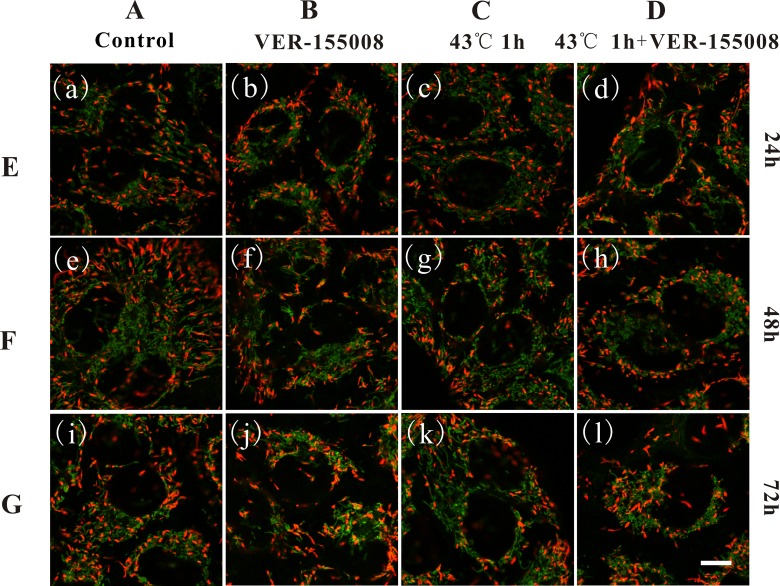
MCF-7 breast cancer cells labeled with the ΔΨm sensing probe, JC-1 to monitor the effects of VER-155008, HS, and the combination of VER-155008 and HS on ΔΨm. The fluorescence microscopy images in Figure 2 clearly depicted ΔΨm-correlated labeling of mitochondria in MCF-7 breast cancer cells. In the mitochondria, JC-1 accumulated as J-aggregates and fluoresced red in intact and highly polarized mitochondria, while they formed as monomers and fluoresced green in damaged and depolarized mitochondria. All images of the green fluorescence and the red fluorescence channels were shown in overlay manner. Column A showed the control cells without any treatments, column B showed cells with 20 μmol/L VER-155008 treatment, column C showed cells with HS treatment (43°C, 1 hour), and column D showed cells with 20 μmol/L VER-155008 and HS (43°C, 1 hour) treatments. Rows E, F, and G showed the cultivation time of cells at 24, 48, and 72 hours after the beginning of the treatments, respectively. We found that the mitochondrial networks of MCF-7 cells were intact, extended, and covering the majority of the cells in control cells and the sole HS cells, while they were both shrinkage, damaged, and fragmented dramatically from long filamentous interconnected tubules into short tubules with the VER-155008 treatment and the combination treatment. The changes in mitochondria morphologies were in accordance with the descriptions of cell apoptosis.20 Moreover, the mitochondrial contents were changed in the VER-155008 treatment and the combination treatment. Finally, the changes in the damaged mitochondrial morphologies of MCF-7 cells were more obvious with increasing treatment time.
Figure 2.
Fluorescence imaging of mitochondrial membrane potential in MCF-7 breast cancer cells based on 5,5’,6,6’-Tetrachloro-1,1’,3,3’-tetraethylbenzimidazolylcarbocyanine iodide (JC-1). Column A showed control cells without any treatment, column B showed cells with 20 μmol/L VER-155008 treatment, column C showed cells with heat shock (HS) treatment (43°C, 1 hour), column D showed cells with 20 μM VER-155008 and HS (43°C, 1 hour) treatments. Rows E, F, and G showed the measurements at 24, 48, and 72 hours after the beginning of treatments, respectively. Scale bar: 10 μm. ×100, numerical aperture (NA) indicates 1.4 oil objective, zoom 2.
Measurement of the Mitochondrial Membrane Potential
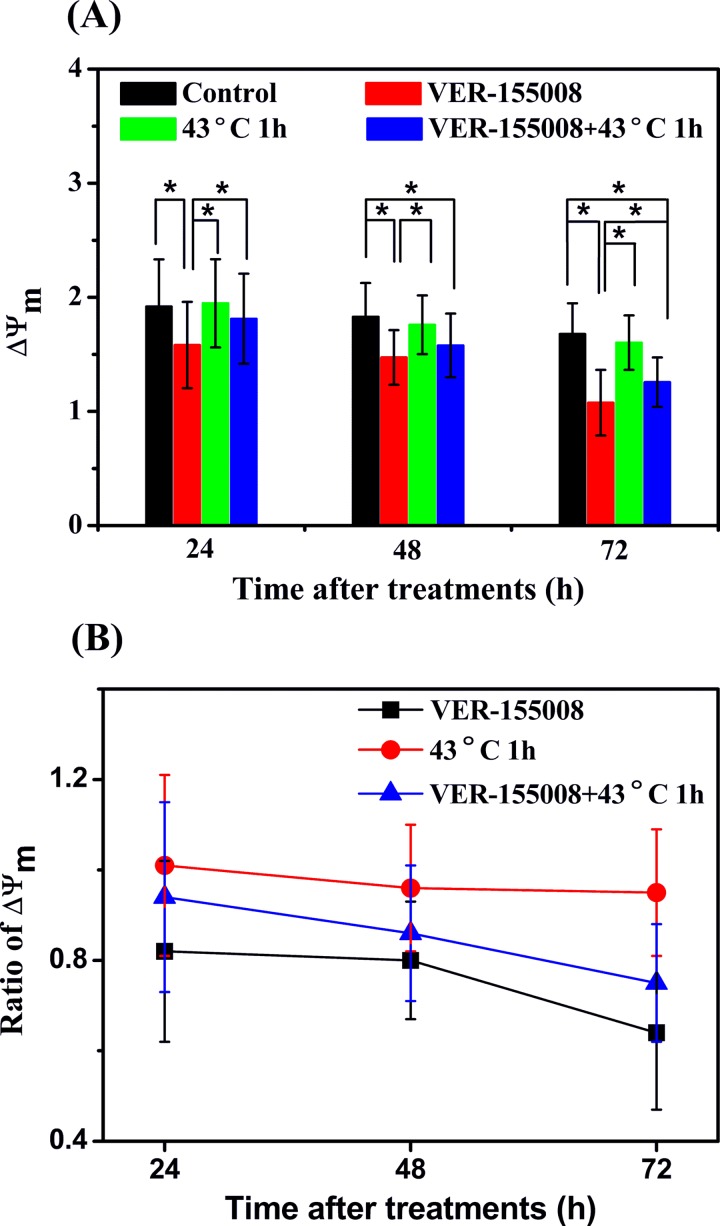
The ratio of fluorescence intensities measured in the red fluorescence and the green fluorescence detection channels described ΔΨm and can be used to character the physiological or pathological state of the cells. ΔΨm after VER-155008, HS, and the combination treatment of VER-155008 and HS were calculated as shown in Figure 3A, and the ratio of ΔΨm of treatment cells to that of control cells was showed in Figure 3B. We found that ΔΨm were decreased significantly with the VER-155008 treatment and the combination treatment. The ratios of average ΔΨm of the VER-155008 treatment cells to those of the control cells were 0.82 (0.20), 0.80 (0.13), and 0.64 (0.17), while the values of the combination treatment cells to those of the control cells were 0.94 (0.21), 0.86 (0.15), and 0.75 (0.13), respectively, at 24, 48, and 72 hours after the beginning of the treatments. The decrease degree presented treatment time dependence, and the depolarization effect of the sole VER-155008 treatment on ΔΨm was more effective than the combination treatment. Moreover, the data of ΔΨm had no statistical discrepancies between the sole HS treatment cells and the control cells at 3 different measurement times. The ratios of average ΔΨm of the HS cells to the control cells were 1.01 (0.20), 0.96 (0.14), and 0.95 (0.14), respectively.
Figure 3.
Changes in mitochondrial membrane potential ΔΨm after different treatments in MCF-7 breast cancer cells. A, ΔΨm and (B) ratios of ΔΨm of treatment cells to those of control cells with VER-155008 (20 μmol/L), heat shock (HS; 43°C, 1 hour), and the combination treatment of VER-155008 and HS at 24, 48, and 72 hours after the beginning of the treatments, respectively. Cells without any treatment as the control cells. *P < .05.
These results indicated that the inhibition of HSP70 contributed to the decrease of ΔΨm in MCF-7 breast cancer cells with the sole HSP70 inhibitor VER-155008 treatment and the combination treatment. Heat shock treatment not influenced ΔΨm obviously but alleviated the depolarization effect on ΔΨm when it was combined with VER-155008. Therefore, we concluded that the obvious decrease in ΔΨm induced by the inhibition of HSP70 may imply the cell apoptosis in MCF-7 breast cancer cells.21 The HS-induced effect alleviates the inhibition effect of VER-155008.
Measurement of the Mitochondrial Content
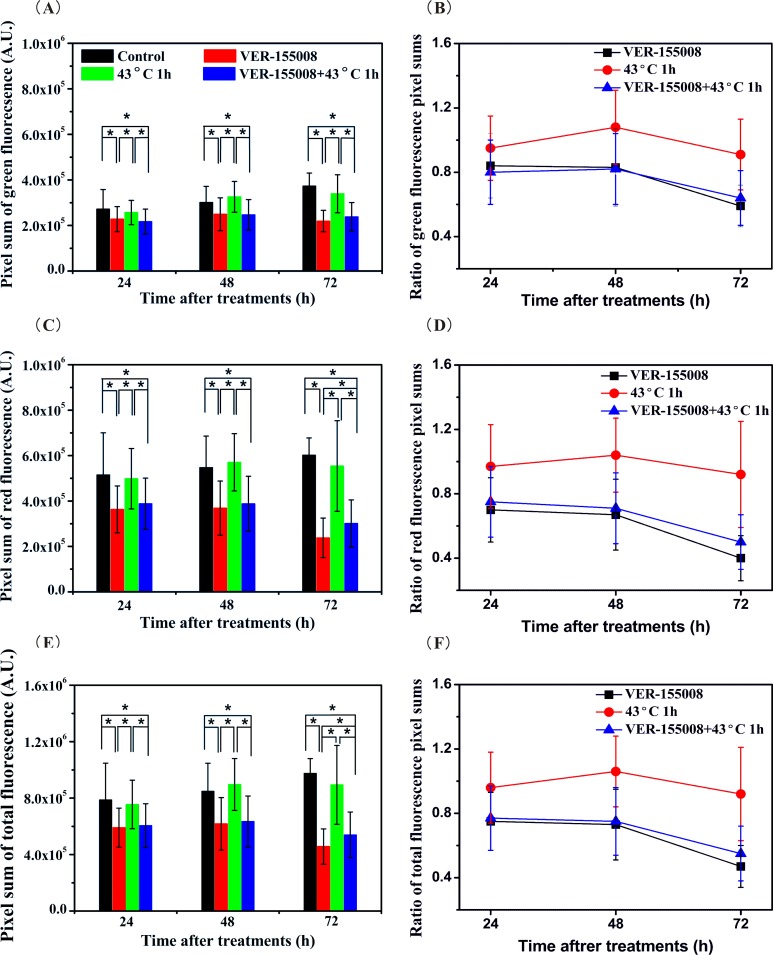
ΔΨm was relate to the fluorescence intensities in the red fluorescence and the green fluorescence channels. Many researchers usually pay more attention to the ratio of the red and the green fluorescence intensities than themselves. And the fluorescence intensity influenced by mitochondrial content and the cell size usually presented as mean value in a cell. It might not suit to describe the mitochondrial content when the cell size was changed. In our study, the pixel sum that specified the sum of the measured gray-scale values was used to assess the effects of VER-155008, HS, and the combination treatment on the mitochondrial content (Figure 4A, C, and E). It demonstrated the pixel sum in the green fluorescence, the red fluorescence, and the overlay fluorescence channels were reduced obviously with the sole VER-155008 treatment and the combination treatment. The ratios of average pixel sums of the treatment cells to those of the control cells were used to evaluate the decrease degree in mitochondrial contents (Figure 4B, D, and F). In the green fluorescence channel, the ratios were 0.84 (0.20), 0.83 (0.24), and 0.59 (0.13) between the VER-155008 treatment cells and the control cells, and they were 0.80 (0.20), 0.82 (0.22), and 0.64 (0.17) between the combination treatment cells and the control cells at 24, 48, and 72 hours after the beginning of the treatments. In the red fluorescence channel, the former was 0.70 (0.20), 0.67 (0.22), and 0.40 (0.14), and the latter were 0.75 (0.22), 0.71 (0.22), and 0.50 (0.17), respectively. The ratios of the average total mitochondrial contents of the treatment cells to those of the control cells were analyzed by overlaying the green fluorescence and the red fluorescence channels. The former was 0.75 (0.18), 0.73 (0.22), and 0.47 (0.13), and the latter was 0.77 (0.20), 0.75 (0.21), and 0.55 (0.17).
Figure 4.
Pixel sums of the mitochondrial fluorescence (A, C, E) and the ratios of fluorescence pixel sums of treatment cells to those of control cells (B, D, F) in the green fluorescence, the red fluorescence, and the overlay fluorescence channels, respectively. *P < .05.
These data depicted the changes in mitochondrial contents with the VER-155008 treatment and the combination treatment in 3 fluorescence channels. The mitochondrial contents with the combination treatment were both more than those with the sole VER-155008 treatment in the red fluorescence and the overlay fluorescence channels, while those were not like that in the green fluorescence channel. Moreover, the decrease in mitochondrial contents presented treatment time dependence in the red fluorescence and the overlay fluorescence channels, but it was not like that in the green fluorescence channel. We considered that these phenomena might ascribe to the conversion of ΔΨm from high state to low state. The decrease in the highly polarized mitochondria contents might induce the increase in the mitochondrial contents of low ΔΨm. Meanwhile, the decrease in the total mitochondrial contents might due to the dissociation of mitochondria when the VER-155008 treatment or the combination treatment was employed. In addition, the mitochondria contents had no statistical discrepancies between the HS treatment cells and the control cells in any fluorescence channels.
Measurement of the Cell Size
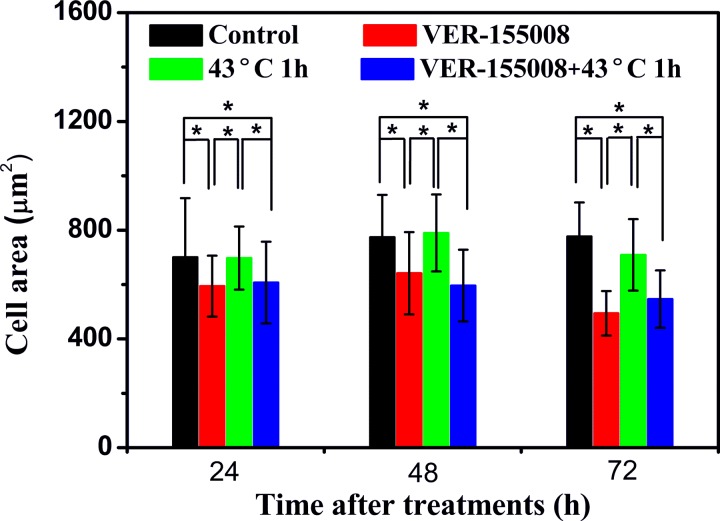
Further measurement was employed to investigate the size changes in MCF-7 breast cancer cells after VER-155008, HS, and the combination treatment. The results were shown in Figure 5. The average cell areas decreased significantly with the VER-155008 treatment and the combination treatment at 24, 48, and 72 hours after the beginning of the treatments. In addition, there were no obvious discrepancies between the HS treatment cells and the control cells at 3 different measurement times. These results might further indicate that the inhibition of HSP70 induced MCF-7 cells apoptosis because the cell shrinkage was considered as one of the events of cell apoptosis.
Figure 5.
Cell area measurements with VER-155008 (20 μmol/L), heat shock (HS; 43°C, 1 hour), and the combination treatment of VER-155008 and HS at 24, 48, and 72 hours after the beginning of the treatments, respectively. Cells without any treatment as the control cells. *P < .05.
Conclusion
The effects of the treatments of VER-155008, HS, and the combination of VER-155008 and HS on the mitochondrial morphology, ΔΨm, the mitochondrial content, and the cell size were investigated in JC-1 labeled MCF-7 breast cancer cells at 24, 48, and 72 hours after the beginning of the treatments. A laser scanning microscope equipped with a high NA oil objective was employed to visualize the changes in mitochondrial morphology and cell size. The ratio of fluorescence intensities measured in the red fluorescence and the green fluorescence detection channels was used to calculate ΔΨm. Meanwhile, the pixel sums were utilized to describe the changes in the mitochondrial contents in the red fluorescence (the mitochondrial contents of high ΔΨm), the green fluorescence (the mitochondrial contents of low ΔΨm), and the overlay fluorescence channels (the total mitochondrial contents), respectively.
The results revealed that the sole HSP70 inhibitor VER-155008 treatment and the combination treatment of VER-155008 and HS both caused some apoptosis-related phenomena in MCF-7 breast cancer cells. The intact networks of mitochondria were broken, ΔΨm and cell size were decreased, and the mitochondrial contents were reduced. These indicated that the inhibition of HSP70 by VER-155008 might effectively induce apoptosis in MCF-7 breast cancer cells, and the effect of the inhibition of HSP70 was treatment time dependence. Moreover, it was worth noting that the sole HS treatment not induced obvious change in mitochondria of MCF-7 breast cancer cells but alleviated the promoting apoptosis effect of VER-155008 at the condition of the combination treatment. We considered it might in part attribute to the protective function of HSP70 and may be other HSPs induced by HS. In conclusion, we visualize and quantify the effect of the inhibition of HSP70 on breast cancer cells based on laser scanning microscopy. Our findings demonstrated that VER-155008, the inhibitor of HSP70, induced the apoptosis of MCF-7 breast cancer cells, and its inhibition effect was alleviated by HS.
So far, most of the researches of the anticancer therapy targeted HSP70 were employed in vitro cells. The inhibition of HSP70 has shown its proapoptosis effect in many cancer cells. In vivo, VER-155008 demonstrated rapid metabolism and clearance in the HCT116 tumor-bearing mouse, along with tumor levels below the predicted pharmacologically active level.18 Therefore, VER-155008 encapsulated in the nanoparticle may result in significantly higher cellular retention than treatment with it in solution, and it would be a good solution for our next in vivo experiments.
Abbreviations
- HS
heat shock
- HSPs
heat shock proteins
- HSP70
heat shock protein 70
- JC-1
5,5’,6,6’-Tetrachloro-1,1’,3,3’-tetraethylbenzimidazolylcarbocyanine iodide
- NA
numerical aperture
- PBS
phosphate-buffered saline
- PMT
photomultiplier tube.
Footnotes
Declaration of Conflicting Interests: The author(s) declared no potential conflicts of interest with respect to the research, authorship, and/or publication of this article.
Funding: The author(s) disclosed receipt of the following financial support for the research, authorship, and/or publication of this article: This work was supported by the National Natural Science Foundation of China (Grant No. 61675043 and Grant No. 81571726), the National Key Basic Research Program of China (973 Project, Grant No. 2015CB352006), the Program for Changjiang Scholars and Innovative Research Team in University (Grant No. IRT_15R10), the Special Funds of the Central Government Guiding Local Science and Technology Development (Grant No. 2017L3009), and the Natural Science Foundation of Fujian Province (Grant No. 2018J01814).
ORCID iD: Biying Yu, PhD http://orcid.org/0000-0002-5463-1292
References
- 1. Lindquist S. The heat-shock response. Ann Rev Biochem. 1986;55(1):1151–1191. doi:10.1146/annurev.bi.55.070186.005443. [DOI] [PubMed] [Google Scholar]
- 2. Hartl FU, Bracher A, Hayer-Hartl M. Molecular chaperones in protein folding and proteostasis. Nature. 2011;475(7356):324–332. doi:10.1038/nature10317. [DOI] [PubMed] [Google Scholar]
- 3. Georgopoulos C, Welch WJ. Role of the major heat shock proteins as molecular chaperones. Annu Rev Cell Biol. 1993;9(1):601–634. doi:10.1146/annurev.cb.09.110193.003125. [DOI] [PubMed] [Google Scholar]
- 4. Mayer MP, Bukau B. Hsp70 chaperones: cellular functions and molecular mechanism. Cell Mol Life Sci. 2005;62(6):670–684. doi:10.1007/s00018-004-4464-6. [DOI] [PMC free article] [PubMed] [Google Scholar]
- 5. Mosser DD, Caron AW, Bourget L, Denis-Larose C, Massie B. Role of the human heat shock protein hsp70 in protection against stress-induced apoptosis. Mol Cell Biol. 1997;17(9):5317–5327. doi:10.1128/MCB.17.9.5317. [DOI] [PMC free article] [PubMed] [Google Scholar]
- 6. Ciocca DR, Clark GM, Tandon AK, Fuqua SA, Welch WJ, McGuire WL. Heat shock protein hsp70 in patients with axillary lymph node-negative breast cancer: prognostic implications. J Natl Cancer Inst. 1993;85(7):570–574. doi:10.1093/jnci/85.7.570. [DOI] [PubMed] [Google Scholar]
- 7. Jagadish N, Agarwal S, Gupta N, et al. Heat shock protein 70-2 (HSP70-2) overexpression in breast cancer. J Exp Clin Cancer Res. 2016;35(1):150 doi:10.1186/s13046-016-0425-9. [DOI] [PMC free article] [PubMed] [Google Scholar]
- 8. Ciocca DR, Calderwood SK. Heat shock proteins in cancer: diagnostic, prognostic, predictive, and treatment implications. Cell Stress Chaperones. 2005;10(2):86–103. doi:10.1379/CSC-99r.1. [DOI] [PMC free article] [PubMed] [Google Scholar]
- 9. Stankiewicz AR, Lachapelle G, Foo CP, Radicioni SM, Mosser DD. Hsp70 inhibits heat-induced apoptosis upstream of mitochondria by preventing Bax translocation. J Biol Chem. 2005;280(46):38729–38739. doi:10.1074/jbc.M509497200. [DOI] [PubMed] [Google Scholar]
- 10. Liu FF, Miller N, Levin W, et al. The potential role of HSP70 as an indicator of response to radiation and hyperthermia treatments for recurrent breast cancer. Int J Hyperthermia. 1996;12(2):197–208. doi:10.3109/02656739609022508. [DOI] [PubMed] [Google Scholar]
- 11. Vargas-Roig LM, Gago FE, Tello O, Aznar JC, Ciocca DR. Heat shock protein expression and drug resistance in breast cancer patients treated with induction chemotherapy. Int J Cancer. 1998;79(5):468–475. [DOI] [PubMed] [Google Scholar]
- 12. Powers MV, Jones K, Barillari C, Westwood I, van Montfort RL, Workman P. Targeting HSP70: the second potentially druggable heat shock protein and molecular chaperone?. Cell Cycle. 2010;9(8):1542–1550. doi:10.4161/cc.9.8.11204. [DOI] [PubMed] [Google Scholar]
- 13. Goloudina AR, Demidov ON, Garrido C. Inhibition of HSP70: a challenging anti-cancer strategy. Cancer Lett. 2012;325(2):117–124. doi:10.1016/j.canlet.2012.06.003. [DOI] [PubMed] [Google Scholar]
- 14. Evans CG, Chang L, Gestwicki JE. Heat shock protein 70 (hsp70) as an emerging drug target. J Med Chem. 2010;53(12):4585–4602. doi:10.1021/jm100054 f. [DOI] [PMC free article] [PubMed] [Google Scholar]
- 15. Massey AJ. ATPases as drug targets: insights from heat shock proteins 70 and 90. J Med Chem. 2010;53(20):7280–7286. doi:10.1021/jm100342z. [DOI] [PubMed] [Google Scholar]
- 16. Schlecht R, Scholz SR, Dahmen H, et al. Functional analysis of Hsp70 inhibitors. PLoS One. 2013;8(11):e78443 doi:10.1371/journal.pone.0078443. [DOI] [PMC free article] [PubMed] [Google Scholar]
- 17. Leu JI, Pimkina J, Pandey P, Murphy ME, George DL. HSP70 inhibition by the small-molecule 2-phenylethynesulfonamide impairs protein clearance pathways in tumor cells. Mol Cancer Res. 2011;9(7):936–947. doi:10.1158/1541-7786.MCR-11-0019. [DOI] [PMC free article] [PubMed] [Google Scholar]
- 18. Massey AJ, Williamson DS, Browne H, et al. A novel, small molecule inhibitor of Hsc70/Hsp70 potentiates Hsp90 inhibitor induced apoptosis in HCT116 colon carcinoma cells. Cancer Chemother Pharmacol. 2010;66(3):535–545. doi:10.1007/s00280-009-1194-3. [DOI] [PubMed] [Google Scholar]
- 19. Wen W, Liu W, Shao Y, Chen L. VER-155008, a small molecule inhibitor of HSP70 with potent anti-cancer activity on lung cancer cell lines. Exp Biol Med. 2014;239(5):638–645. doi:10.1177/1535370214527899. [DOI] [PubMed] [Google Scholar]
- 20. Sheridan C, Delivani P, Cullen SP, Martin SJ. Bax-or Bak-induced mitochondrial fission can be uncoupled from cytochrome C release. Mol Cell. 2008;31(4):570–585. doi:10.1016/j.molcel.2008.08.002. [DOI] [PubMed] [Google Scholar]
- 21. Sheridan C, Martin SJ. Mitochondrial fission/fusion dynamics and apoptosis. Mitochondrion. 2010;10(6):640–648. doi:10.1016/j.mito.2010.08.005. [DOI] [PubMed] [Google Scholar]


