

Abstract
Oncogenic RAS proteins are commonly expressed in human cancer. To be functional, RAS proteins must undergo post-translational modification and localize to the plasma membrane (PM). Therefore, compounds that prevent RAS PM targeting have potential as putative RAS inhibitors. Here we examine the mechanism of action of oxanthroquinone G01 (G01), a recently described inhibitor of KRAS PM localization. We show that G01 mislocalizes HRAS and KRAS from the PM with similar potency and disrupts the spatial organization of RAS proteins remaining on the PM. G01 also inhibited recycling of epidermal growth factor receptor and transferrin receptor, but did not impair internalization of cholera toxin, indicating suppression of recycling endosome function. In searching for the mechanism of impaired endosomal recycling we observed that G01 also enhanced cellular sphingomyelin (SM) and ceramide levels and disrupted the localization of several lipid and cholesterol reporters, suggesting that the G01 molecular target may involve SM metabolism. Indeed, G01 exhibited potent synergy with other compounds that target SM metabolism in KRAS localization assays. Furthermore, G01 significantly abrogated RAS-RAF-MAPK signaling in Madin-Darby canine kidney (MDCK) cells expressing constitutively activated, oncogenic mutant RASG12V. G01 also inhibited the proliferation of RAS-less mouse embryo fibroblasts expressing oncogenic mutant KRASG12V or KRASG12D but not RAS-less mouse embryo fibroblasts expressing oncogenic mutant BRAFV600E. Consistent with these effects, G01 selectively inhibited the proliferation of KRAS-transformed pancreatic, colon, and endometrial cancer cells. Taken together, these results suggest that G01 should undergo further evaluation as a potential anti-RAS therapeutic.
Keywords: signaling, plasma membrane, Ras protein, GTPase Kras (KRAS), sphingolipid, cancer, endosome recycling, oxanthroquinone, sphingomyelin, trafficking
Introduction
RAS is a small guanine nucleotide-binding protein that operates as a molecular switch to regulate cell growth, proliferation, and differentiation. RAS oscillates between an inactive GDP-bound state and an active GTP-bound state, regulated by guanine nucleotide exchange factors and GTPase-activating proteins. Oncogenic mutations that lock RAS in the GTP-bound state occur in ∼15% of all human cancers, leading to constitutive activation of downstream effectors (1, 2). Activated point mutations occur in all ubiquitously expressed RAS isoforms, HRAS, NRAS, and KRAS, but are most prevalent in KRAS (3, 4). To function, RAS proteins must localize to the inner leaflet of the plasma membrane (PM)2 (5). This is achieved through a set of three post-translational modifications of the C-terminal CAAX motif, common to all RAS proteins, which generate a C-terminal cysteine farnesyl carboxyl-methyl ester (6). HRAS, NRAS, and KRAS4A are additionally palmitoylated on adjacent cysteine residues to generate a complete PM anchor (6, 7). In the case of KRAS4B (referred to as KRAS hereafter), the farnesylated C-terminal cysteine operates in concert with a C-terminal polybasic domain for PM localization (8).
Maintenance of RAS proteins on the PM requires one of two distinct spatial organizing systems. HRAS and NRAS undergo depalmitoylation by a thioesterase after endocytosis, resulting in release to the cytosol. Following repalmitoylation in the Golgi, HRAS, and NRAS are trafficked back to the PM via vectorial exocytic transport (9–12), possibly via the recycling endosome (RE) (13). A recent study shows that vacuolar protein sorting-associated protein 35 (VPS35), a component of the retromer complex, facilitates NRAS recycling from endosomes to the Golgi complex (14). KRAS released to the cytosol following endocytosis is captured by the chaperone protein PDEδ, which delivers it to the RE for forward transport back to the PM. PDEδ maintains KRAS as a soluble complex in the cytosol until the complex is disassembled by Arl2 in the vicinity of the RE. KRAS rebinds to negatively charged RE vesicles for forward transport back to the PM (15). These trafficking and recycling pathways are essential to maintain the fidelity of RAS PM localization. For instance, inhibitors of the RAS thioesterase that block the removal of palmitoyl groups from HRAS and NRAS cause entropic redistribution of the proteins to all cell membranes (10). Similarly, blocking PDEδ function with chemical inhibitors results in redistribution of KRAS from the PM to endomembrane (15).
Blocking RAS PM localization abrogates RAS biological function, because effector activation occurs exclusively on the PM (5). Inhibitors of CAAX processing, including farnesylation with farnesyltransferase inhibitors, have not been successful because KRAS and NRAS can be alternately geranylgeranylated in farnesyltransferase inhibitor-treated cells and localize normally to the PM (16, 17). Inhibitors of the various components of the RAS spatial organizing systems may, however, have merit (5, 18, 19). In the case of KRAS, PM phosphatidylserine (PtdSer) content has also been shown to be critically important for KRAS localization and function because the KRAS anchor exhibits a high degree of binding specificity for PtdSer (4, 20, 21). Thus drugs that deplete the PM of PtdSer mislocalize and inhibit KRAS function; these include multiple inhibitors and regulators of sphingomyelin (SM) biosynthesis and metabolism (22–24). We also reported previously a novel class of Streptomyces polyketide, the oxanthroquinones, which mislocalize KRAS from the PM (25). In the context of the recent studies described above clarifying the molecular machineries that maintain KRAS PM binding, we explored the putative mechanism of action of a representative derivative, oxanthroquinone G01 (G01).
Results
G01 mislocalizes oncogenic KRAS, KRAS4A, and HRAS from the plasma membrane
We reported previously the synthesis of a series of oxanthroquinone derivatives based on the original microbial polyketide structures identified in a high content screen for inhibitors of KRAS PM binding (25). The most potent synthetic compound was 3-O-methyl oxanthroquinone ethyl ester, with a structure as shown in Fig. 1A (25), and hereafter referred to as G01. We selected G01 for further analysis. We first examined the RAS isoform specificity of G01. Madin-Darby canine kidney (MDCK) cells stably co-expressing mGFP-KRASG12V, mGFP-HRASG12V, or mGFP-KRAS4AG12V, and mCherry-CAAX, a general endomembrane marker, were treated with different concentrations of G01 for 48 h, and analyzed by confocal microscopy (26). The extent of RASG12V mislocalization was calculated using Manders coefficients, which quantify the fraction of mGFP-RASG12V co-localizing with mCherry-CAAX (27). The greater the value of the Manders coefficient, the more extensive is the displacement of mGFP-RASG12V from the PM. The results show that G01 mislocalizes oncogenic KRAS, HRAS, and KRAS4A from the PM with approximately equal potencies, the dose-response curves yielding IC50 values of ∼1 μm (Fig. 1, B and C).
Figure 1.

Mislocalization of KRASG12V, HRASG12V, KRAS4A G12V from the PM is induced by G01. A, structure of G01. B, MDCK cells stably coexpressing mCherry-CAAX, an endomembrane marker, and mGFP-KRASG12V, mGFP-HRASG12V, or mGFP-KRAS4A G12V were seeded on coverslips and treated with vehicle (DMSO) or G01 for 48 h. Cells were imaged in a confocal microscope. Representative images of vehicle (DMSO), 1 and 5 μm G01 treatments are shown. C, the extent of RAS mislocalization was quantified with Manders coefficients, which evaluate the extent of colocalization of mCherry-CAAX and mGFP-RASG12V. Estimated IC50 values for G01 on each cell line were obtained from the respective Manders coefficient (mean ± S.E., n = 3) dose-response plots.
G01 impairs spatial organization of RAS on the PM
In addition to PM subcellular localization, the lateral spatial organization of RAS proteins into nanoclusters on the PM is critical for RAS signal transmission (4). To quantify the effect of G01 on RASG12V nanoclustering, intact basal PM sheets from MDCK cells expressing mGFP-KRASG12V, mGFP-HRASG12V, or mGFP-KRAS4AG12V were treated with G01 for 48 h, labeled with gold-conjugated anti-GFP antibodies, and analyzed by electron microscopy (EM). Spatial mapping of each RAS protein on the PM revealed significant decreases in the peak values of the L(r)–r clustering statistic, Lmax (Fig. 2A), indicating a reduction in the amount of nanoclustered KRASG12V, HRASG12V, and KRAS4AG12V on the PM. We also observed a significant reduction in anti-GFP immunogold labeling of each RAS isoform after G01 treatment, again showing that G01 significantly depleted KRAS, HRAS, and KRAS4A from the inner leaflet of the PM (Fig. 2B), concordant with the confocal imaging results (Fig. 1, B and C).
Figure 2.
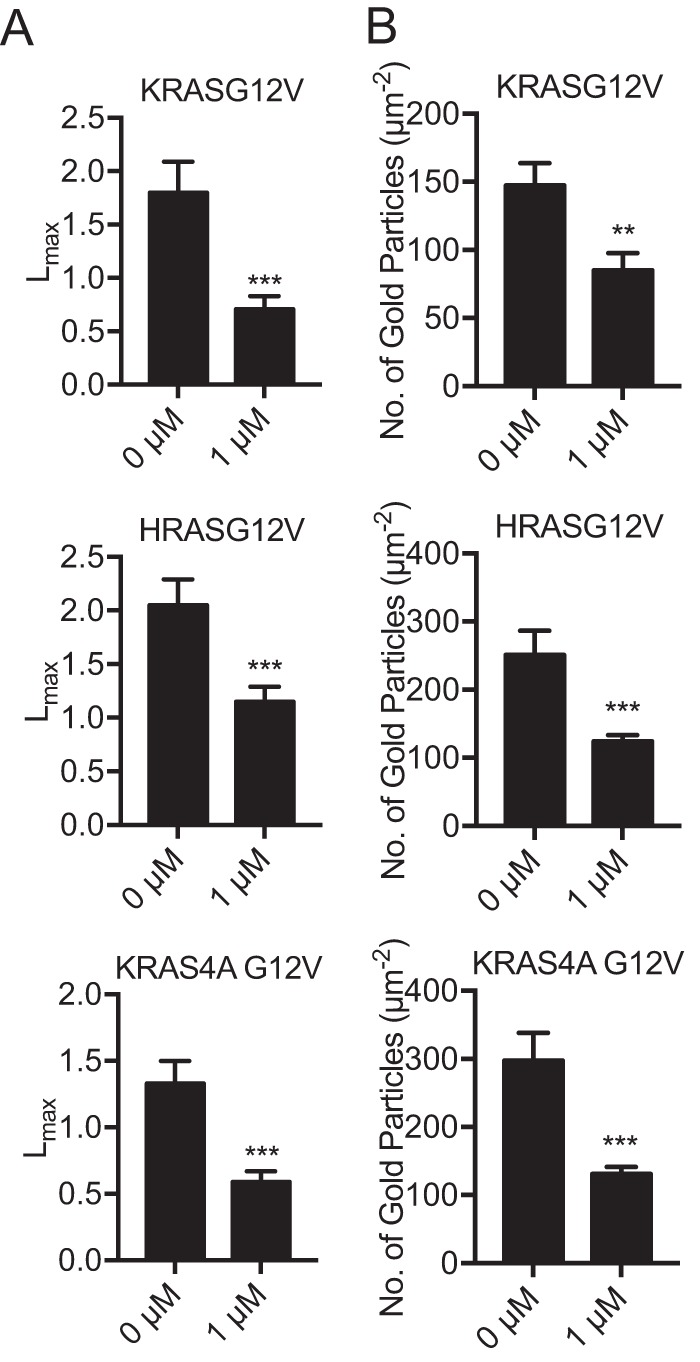
G01 disrupts the PM nanoscale organization of KRASG12V, HRASG12V, and KRAS4A G12V. A, basal PM sheets were generated from MDCK cells stably expressing mGFP-KRASG12V, mGFP-HRASG12V, or mGFP-KRAS4A G12V treated with vehicle (DMSO) or 1 μm G01 for 24 h and imaged by EM after labeling with anti-GFP antibody conjugated to 4.5-nm gold. The extent of clustering of the gold particles was analyzed using Ripley's K-function expressed as L(r) − r functions and normalized on the 99% CI. The maximum value of L(r) − r, defined as Lmax is used as a summary statistic. Values of Lmax above the CI indicates nanoclustering, with the extent of clustering being reflected by the Lmax value. At least 12 PM sheets were evaluated for each condition and RAS isoform. Significant differences from the control pattern for G01-treated cells were assessed using bootstrap tests (***, p < 0.001). B, average mean (± S.E., n ≥ 12) gold labeling density on the PM sheets was calculated and the statistical significance of differences in gold labeling density was evaluated using Student's t test (**, p < 0.01; ***, p < 0.001).
G01 enhances cellular levels of sphingomyelin and ceramide
Recent studies have implicated SM metabolism in the maintenance of normal PM lipidomic content and organization that are critical for both KRAS and HRAS membrane binding and nanoclustering (22, 23). To determine whether G01 disrupts SM metabolism, we first measured SM and ceramide (Cer) levels using whole cell lipidomics. MDCK cells treated with G01 for 48 h exhibited significantly increased SM and Cer levels (Fig. 3A). The enhancement in SM level was confirmed by staining with mGFP-lysenin that specifically binds SM. MDCK cells were treated with G01 for 48 h and incubated with mGFP-lysenin with and without membrane permeabilization. Images were obtained with a confocal microscope. Concordant with the lipidomic analysis, G01 enhanced mGFP-lysenin staining of the exofacial leaflet of the PM as well as intracellular membranes (Fig. 3, B and C). Disrupted SM metabolism may result in mislocalization of PtdSer and cholesterol from the PM (24). MDCK cells stably co-expressing mCherry-CAAX and mGFP-LactC2, a probe for PtdSer, were treated with G01 for 48 h and analyzed by quantitative confocal microscopy. The results show that G01 disrupts the PM localization of mGFP-LactC2, and by inference PtdSer, albeit with a potency much lower than that against RAS (Fig. 3D). Similarly, when MDCK cells stably co-expressing mCherry-D4H, a cholesterol probe, were treated with G01 for 48 h, the mCherry-D4H probe was mislocalized from the PM and accumulated in intracellular puncta, but again this effect was only observed with higher concentrations of G01 (Fig. 3E).
Figure 3.

SM metabolism is disrupted in G01-treated cells. A, MDCK cells stably expressing mGFP-KRASG12V, or WT MDCK cells were grown in the presence of vehicle (DMSO) or 5 nm STS or 1 μm G01 for 48 h. Whole cell lysates were prepared and total SM and Cer levels were measured. The graph shows SM and Cer levels relative to control, the significance of differences were assessed in one-way ANOVA using the actual mean lipid pmol values (mean ± S.E., n = 3) (**, p < 0.01; ***, p < 0.001). B, WT MDCK cells were treated with G01 for 48 h, stained with mGFP-lysenin, and imaged in a confocal microscope with fixed imaging parameters to assess comparative fluorescent intensities. The PM mGFP fluorescence intensity was quantified using the region of interest tool in ImageJ. The values of fluorescence intensity were normalized to the mean of those in vehicle (DMSO) treated groups (mean ± S.E., n ≥ 20). The statistical significance of differences in relative fluorescence intensity was assessed by one-way ANOVA (***, p < 0.001). C, WT MDCK cells were treated with G01 for 48 h and permeabilized, stained with GFP-lysenin and 4′,6-diamidino-2-phenylindole (DAPI). Cells were imaged in a confocal microscope with fixed imaging parameters. Representative images were shown. D, MDCK cells stably coexpressing mGFP-LactC2 and mCherry-CAAX were treated with G01 for 48 h. Cells were fixed and imaged in a confocal microscope. Colocalization between mGFP-LactC2 and mCherry-CAAX was quantified by Manders coefficients. The IC50 value was estimated from the Manders coefficient (mean ± S.E., n = 3) dose-response plot. E, MDCK cells stably coexpressing mGFP-LactC2 and the cholesterol probe, mCherry-D4H, were treated with G01 for 48 h. Cells were fixed and imaged in a confocal microscope. Representative images are shown.
G01 synergizes with other compounds that disrupt SM metabolism
To explore the potential molecular mechanism of action of G01, we tested for synergism between G01 and three other compounds that disrupt SM metabolism: fumonisin B1 (FB1), staurosporine (STS), and R-fendiline. The premise being compounds that have different molecular targets in a common metabolic pathway that is involved in maintaining KRAS PM localization may exhibit synergism for KRAS redistribution. FB1 is a Cer synthase inhibitor that decreases cellular SM and Cer levels (24). STS when used at very low concentrations, well below the IC50 for protein kinase C inhibition (22), increases the rate of SM synthesis by decreasing the level of ORMDL proteins, which negatively regulate the enzyme serine-palmitoyltransferase (24). R-fendiline is an inhibitor of acid sphingomyelinase. R-fendiline treatment therefore elevates the SM content of the endolysomal system (22, 23). We treated MDCK cells coexpressing mGFP-KRASG12V and mCherry-CAAX with various concentrations of G01, in the presence of a fixed low concentration (10 μm) of FB1 for 48 h and imaged the cells using confocal microscopy, Manders coefficients were measured and IC50 values were calculated. G01 alone mislocalizes KRASG12V with an IC50 of ∼1 μm, whereas FB1 improves the IC50 to ∼0.2 μm (Fig. 4A). To formally quantify synergism, we calculated a combination index (CI) using the Chou-Talalay method. By this method a CI of 1 indicates an additive effect, a CI < 1 indicates synergism, and a CI > 1 indicates antagonism (28). This analysis confirms that G01 synergizes with FB1 for KRAS mislocalization over most of the G01 concentration ranges tested (Table 1A). Reciprocally, a low dose of G01 shifted the dose-response curve of FB1 to the left indicating a reduced IC50 (Fig. 4A). Chou-Talalay analysis again confirmed synergism over most of the FB1 concentration range tested (Table 1A). Similar experiments with G01 and STS, G01 and R-fendiline showed strong synergism between each pair of compounds for KRAS mislocalization from the PM (Fig. 4, B and C; Table 1, B and C). These results strongly suggest that the molecular target of G01 impacts SM metabolism but is likely different from the enzymes inhibited by FB1, STS, and R-fendiline.
Figure 4.

The cocktails of G01 with other compounds are more potent for PM mislocalization of KRAS. A, MDCK cells stably coexpressing mCherry-CAAX and mGFP-KRASG12V were treated with 10 μm FB1 with variable concentrations of G01, or 0.5 μm G01 with variable concentrations of FB1. Cells were fixed and imaged in a confocal microscope. The colocalization between mGFP-LactC2 and mCherry-CAAX was quantified by Manders coefficients (mean ± S.E., n = 3). IC50 values were estimated from the Manders coefficient dose-response plots. B, MDCK cells stably coexpressing mCherry-CAAX and mGFP-KRASG12V were treated with 0.5 nm STS with variable concentrations of G01, or 0.5 μm G01 with variable concentrations of STS. Manders coefficients (mean ± S.E., n = 3) were quantified and IC50 values were estimated. C, MDCK cells stably coexpressing mCherry-CAAX and mGFP-KRASG12V were treated with 2.5 μm R-fendiline with variable concentrations of G01, or 0.5 μm G01 with variable concentrations of R-fendiline. Manders coefficients (mean ± S.E., n = 3) were quantified and IC50 values were estimated.
Table 1.
G01 synergizes with modulators of SM metabolism for KRAS mislocalization
Synergism was quantified by the Chou and Talalay method using Compusyn software (version 1.0; ComboSyn, Inc.). Combination indexes (CI) were calculated using the mean value of Manders coefficients from three independent experiments (synergism, CI < 1; additive effect, CI = 1; antagonism, CI > 1).

G01 disrupts the endocytic recycling of epidermal growth factor receptor and transferrin receptor
Normal function of the RE is required to maintain KRAS, HRAS, and NRAS on the PM (13, 15). We therefore examined whether G01 compromises the cellular distribution of other proteins that recycle through the RE. We first observed the localization and trafficking of epidermal growth factor receptor (EGFR) (29–31). Chinese hamster ovary (CHO) cells stably expressing mGFP-EGFR were treated with G01 for 48 h (or left untreated), serum starved, and incubated with EGF on ice for 15 min and then imaged by confocal microscopy at intervals following warming to 37 °C. For control cells with no G01 treatment, mGFP-EGFR was predominantly localized to the PM at 0 min and then rapidly endocytosed, such that at 15 and 30 min, the majority of mGFP-EGFR was localized to intracellular vesicles, before being substantially returned to the PM by 60 min (Fig. 5A). In G01-treated cells, a large fraction of mGFP-EGFR was already redistributed from the PM at 0 min, and at subsequent time points the remaining PM-bound mGFP-EGFR was internalized. In striking contrast to control cells at 60 min, mGFP-EGFR was concentrated in the perinuclear region (Fig. 5A). In parallel experiments, we quantified the amount of mGFP-EGFR on the PM during EGF-induced endocytosis using anti-GFP immunogold labeling and EM of PM sheets. The results are concordant with the confocal imaging and show significantly lower levels of mGFP-EGFR on the PM in G01-treated cells at 0 and 60 min (Fig. 5B). Together these data illustrate that G01 inhibits the endocytic recycling of EGFR, most probably, given the perinuclear accumulation of internalized EGFR, by inhibiting the exit of EGFR from the RE.
Figure 5.

EGFR endosomal recycling is inhibited by G01. A, CHO cells stably expressing mGFP-EGFR were treated with vehicle (DMSO) or 1 μm G01 for 48 h. Cells were serum-starved for 2 h and incubated with 50 ng/ml of EGF on ice for 20 min. Excess EGF was washed away with ice-cold PBS. Cells were then incubated with fresh warm medium with vehicle (DMSO), or 1 μm G01 at 37 °C and fixed at different time points. Cells were imaged in a confocal microscope. Representative images of vehicle (DMSO) and 1 μm G01 were shown. B, in parallel identical experiments PM sheets were generated from the CHO cells under identical conditions as in A, labeled with anti-GFP antibody conjugated to 4.5-nm gold, and imaged by EM. Mean gold density on the PM sheets was determined. The statistical significance of differences in mean (± S.E., n ≥ 12) gold labeling density at each time point was evaluated using Student's t test (**, p < 0.01; ***, p < 0.001).
We next examined endocytic recycling of the transferrin receptor (TfR). Alexa Fluor 555-conjugated transferrin (Tf-555) was bound to the surface of MDCK cells that had been treated for 48 h with G01 or left untreated. Excess Tf-555 was removed by washing and the cells immediately imaged. The surface fluorescence intensity was much lower in the G01-treated cells, indicating less bound Tf-555 and thus a lower density of TfR on the PM (Fig. 6A). MDCK cells stably expressing mGFP-LactC2 were treated with G01 for 48 h, incubated with Tf-555 on ice, then imaged by confocal microscopy at intervals following warming to 37 °C. PtdSer is not mislocalized by 1 μm G01 therefore GFP-LactC2 can be used as a PM marker for quantification. In control cells Tf-555 was rapidly internalized and substantially returned to the PM by 60 min; as shown in the images in Fig. 6B that were quantified using Manders coefficients to evaluate the extent of co-localization between mGFP-LactC2 and Tf-555. Whereas in G01-treated cells Tf-555 was rapidly internalized but not returned to the PM (Fig. 6, B and C). These results together suggest that the endocytic recycling of TfR is inhibited by G01. We next conducted similar experiments with Alexa Fluor 647-conjugated cholera toxin b subunit (CTB-647), using A431 cells that express the ganglioside GM1, which is the surface receptor for cholera toxin (32). After initial incubation with CTB-647 we observed no difference in PM fluorescence intensity between G01-treated and untreated cells, suggesting that the level of GM1 expressed on the surface of A431 cells was unchanged by G01 treatment (Fig. 6A). To quantify the internalization of CTB-647 we stained fixed cells with the impermeable PM marker Alexa Fluor 488 conjugated to wheat germ agglutinin (WGA-488) that binds GlcNAc and N-acetylneuraminic acid. Manders coefficients were then used to measure the rate of loss of CTB-647 from the PM. This analysis revealed no difference in the kinetics of CTB-647 internalization in A431 cells after G01 treatment (Fig. 7, A and B). We therefore conclude that the internalization of GM1, which is not dependent on RE function, was unaffected by G01 treatment.
Figure 6.

Transferrin receptor endocytic recycling is disrupted by G01. A, WT MDCK or A431 cells were treated with vehicle (DMSO) or 1 μm G01 for 48 h. MDCK and A431 cells were incubated with Tf-555 or CTB-647 on ice, respectively, for 20 min. Excess Tf-555 or CTB-647 was washed away with ice-cold PBS. Cells were fixed and observed under a confocal microscope with fixed imaging parameters to assess comparative fluorescent intensities. Representative images were shown. B, MDCK cells stably expressing mGFP-LactC2 were treated with vehicle (DMSO) or 1 μm G01 for 48 h. Cells were incubated with Tf-555 on ice for 20 min. Excess Tf-555 was washed away with ice-cold PBS. Cells were then incubated with fresh warm medium with vehicle (DMSO) or 1 μm G01 at 37 °C and fixed at different time points. Cells were imaged in a confocal microscope and representative images of vehicle (DMSO), 1 μm G01 are shown. C, images were analyzed using Manders coefficients to quantify the extent of colocalization of mGFP-LactC2 and Tf-555. The statistical significance of differences between mean Manders coefficients (mean ± S.E., n = 3) at each time point was evaluated using Student's t tests (**, p < 0.01).
Figure 7.

Endocytosis of cholera toxin is unaffected by G01. A, A431 cells were treated with vehicle (DMSO) or 1 μm G01 for 48 h. Cells were incubated with CTB-647 on ice for 20 min. Excess CTB-647 was washed away by ice-cold PBS. Cells were then incubated with fresh warm medium with vehicle (DMSO) or 1 μm G01 at 37 °C and fixed at different time points. Cells were incubated with WGA-488 for 10 min and fixed. Cells were imaged in a confocal microscope and representative images of vehicle (DMSO), 1 μm G01 are shown. B, images were analyzed using Manders coefficients to quantify colocalization of the PM markers, WGA-488 and CTB-647. The statistical significance of differences between mean Manders coefficients (mean ± S.E., n = 3) at each time point was evaluated using Student's t tests.
ERK signaling downstream of oncogenic RAS is abrogated by G01
RAS PM localization and nanocluster formation is critical for signal transmission (5). Thus G01 concentrations that significantly mislocalized KRASG12V or HRASG12V or KRAS4A G12V also suppressed ppERK levels in MDCK cells stably expressing each oncogenic RAS isoform (Fig. 8, A–C). Thus oncogenic RAS-MAPK signaling is abrogated by G01. Given that G01 synergizes with compounds that perturb SM metabolism for KRASG12V mislocalization, we also tested RAS-RAF-MAPK signaling in MDCK cells expressing KRASG12V treated with synergistic drug combinations. Concordant with the mislocalization data shown in Fig. 4, treatment with 10 μm FB1 or 0.5 μm G01 alone had no effect on pp-ERK levels, whereas the drug combination significantly inhibited RAS-RAF-MAPK signaling (Fig. 8D). Similar results were obtained with low doses of G01 combined with low doses of STS, or R-fendiline, which singly had no effect on RAS-RAF-MAPK signaling, but which in combination synergized to reduce ppERK levels (Fig. 8, E and F).
Figure 8.

G01 inhibits oncogenic RAS signaling. MDCK cells stably expressing mGFP-KRASG12V (A), mGFP-HRASG12V (B), or mGFP-KRAS4A G12V (C) were treated with vehicle (DMSO) or G01 for 48 h. Levels of ppERK were measured by quantitative immunoblotting and normalized to the total level of ERK. Representative Western blots are shown. The significance of differences between mean (± S.E., n = 3) drug-treated and control ppERK levels were assessed using one-way ANOVA (*, p < 0.05; **, p < 0.01; ***, p < 0.001). MDCK cells stably expressing mGFP-KRASG12V were treated for 48 h with vehicle (DMSO), low dose G01 alone, low dose FB1 alone, or a combination of low dose FB1 with G01 (D), STS alone, or a combination of STS with G01 (E), or low dose R-fendiline alone or a combination of low dose R-fendiline with G01 (F). Levels of ppERK were measured by quantitative immunoblotting and normalized to the total level of ERK. Representative Western blots are shown. The significance of differences between mean (± S.E., n = 3) drug-treated and control ppERK levels were assessed using one-way ANOVA (*, p < 0.05; **, p < 0.01).
G01 inhibits the proliferation of RAS-less mouse embryonic fibroblasts and KRAS transformed tumor cell lines
We first tested the effect of G01 on the proliferation of RAS-less mouse embryonic fibroblast cells (MEF) expressing KRASG12V, KRASG12D, or BRAFV600E. These are cell lines generated from KRAS-floxed, NRAS-null, and HRAS-null mice and express a single transgene that activates the mitogen-activated protein kinase (MAPK) pathway (33). Interestingly, 5 μm G01 treatment for 72 h significantly inhibited proliferation of KRASG12V and KRASG12D RAS-less MEFs, but not BRAFV600E RAS-less MEFs (Fig. 9A). This result suggests that G01 inhibits cell growth at the level of KRAS but not RAF, consistent with an effect on KRAS PM binding. Finally, we tested the efficacy of G01 on a selection on a panel of 14 pancreatic, lung, endometrial, and colon tumor cell lines, which express WT or oncogenic mutant KRAS. G01 more potently inhibited the proliferation of pancreatic, endometrial, and colon tumor cells that expressed oncogenic KRAS (Fig. 9B). G01 also inhibited the proliferation lung tumor cell lines, but without evidence of increased potency in lines expressing oncogenic mutant KRAS rather than WT KRAS (Fig. 9B).
Figure 9.

G01 inhibits the proliferation of oncogenic KRAS-dependent cell lines. A, RAS-less MEF cells rescued by expressing KRASG12V, KRASG12D, or BRAFV600E were seeded in 24-well plates and treated with vehicle (DMSO) or 5 μm G01 for 48 h. The cells were detached and counted. For graphing cell numbers were normalized to the respective mean of number of vehicle (DMSO)-treated cells. The statistical significance of differences in actual cell numbers between control and treated cells (mean ± S.E., n = 3) were evaluated by Student's t (**, p < 0.01; ***, p < 0.001). B, a panel of WT or oncogenic mutant (Mut) KRAS-expressing tumor cells and treated for 72 h with vehicle (DMSO) or 5 μm G01. The cells were detached and counted. For graphing cell numbers were normalized to the respective mean of number of vehicle (DMSO)-treated cells. The statistical significance of differences in actual cell numbers between control and treated cells (mean ± S.E., n = 3) were evaluated by Student's t test (**, p < 0.01; ***, p < 0.001). Results with pancreatic, endometrial, lung, and colon tumor cells are shown, respectively.
Discussion
We show here, using fluorescence and EM that G01 potently mislocalizes oncogenic KRAS, HRAS, and KRAS4A from the PM to endomembranes. G01 also disrupts KRAS, HRAS, and KRAS4A nanocluster formation. Concordant with previous work showing that RAS PM localization and nanocluster formation is crucial for biological function, G01-induced changes to RAS cellular localization and PM spatial organization significantly abrogated RAF-MAPK signaling downstream of oncogenic KRAS, HRAS, and KRAS4A. G01 also inhibited the proliferation of RAS-less MEF cells expressing oncogenic KRAS but not that of RAS-less MEFs expressing oncogenic BRAF, confirming that inhibition was effected at the level of RAS. In cancer cell proliferation assays, G01 more potently inhibited the proliferation of pancreatic, colon, and endometrial tumor cell lines that are oncogenic KRAS dependent, but had less activity against the tumor cell lines that expressed WT KRAS or were KRAS independent. This selectivity for KRAS function was not observed in the small set of lung cancer cell lines we examined, perhaps indicating that WT RAS signaling, which would also be suppressed by G01, is required to support the transformed phenotype in these lung cancer cell lines. Taken together, we conclude that G01 is a novel inhibitor of RAS PM localization and function.
Several lines of evidence suggest that the mechanism of action of G01 involves disruption of RE function. First, we observed mislocalization of palmitoylated HRAS and KRAS4A, as well as nonpalmitoylated KRAS4B with approximately equal potency. This result implicates a common component of their respective spatial organizing systems that maintains PM localization after posttranslational processing, namely the RE (15). Second, the EGFR and TfR were aberrantly distributed in G01-treated cells concordant with abnormal endocytic recycling (13, 15, 29–31), this was most evident with the EGFR, which accumulated in the RE after G01 treatment in EGF-stimulated CHO cells. It is probable that the effect of G01 on the RE function is a consequence of elevated cellular SM levels. Similar effects have been observed with other compounds. For example, blocking ORMDL3 function with STS enhances de novo SM synthesis (24, 27), and inhibiting acid sphingomyelinase with fendiline increases SM and depletes ceramide levels (22, 23, 34). Perturbation of SM levels by these two compounds results in lipid loading of the endolysosomal compartment with SM and cholesterol that impairs lipid recycling necessary to maintain the PM lipidome. In consequence, PM PtdSer and cholesterol levels are reduced (23). G01 also perturbs the PtdSer and cholesterol content of the PM but at higher concentrations than that at which changes to RAS localization are observed; thus the induced changes to RE function by low dose G01 must affect protein recycling more than lipid recycling at low doses, as evident with the EGFR. Whereas the increase in SM levels observed in G01-treated cells may be causative for abnormal RE function, we cannot exclude the possibility that disrupted RE, or endolysomal function by some other mechanism, could be the primary target of G01 and that this in turn leads to secondary changes in SM levels.
We recently identified multiple enzymes in the SM metabolic pathway whose pharmacological inhibition, or in some cases pharmacological activation, mislocalize KRAS and PtdSer from the PM (23). In this context we now show in KRAS mislocalization assays that G01 synergizes with three inhibitors of different SM metabolic enzymes. We propose therefore that G01 modulates SM metabolism, but through a molecular target different from those of FB1, R-fendiline, and STS. Interestingly this synergy was observed with inhibitors that both up-regulate and down-regulate SM levels, indicating the critical importance of PM SM lipid homeostasis in maintaining KRAS function. Most interestingly, the synergistic effects on KRAS mislocalization also extended to synergistic inhibition of oncogenic KRAS-driven MAPK activation. Together these results strongly suggest that G01 may have utility in drug cocktails for future anti-RAS therapies.
Experimental procedures
Materials
Oxanthroquinone G01 was synthesized as described previously (25) and dissolved in dimethyl sulfoxide (DMSO). Cell culture media and fetal bovine serum (FBS) were purchased from HyClone, unless described otherwise. Rabbit anti-phospho-p44/42 MAPK (ppERK1/2) (Thr-202/Tyr-204) (9101) and rabbit anti-ERK (4695) antibodies were purchased from Cell Signaling Technology (Beverly, MA). Mouse anti-β-actin (A1978) antibody was purchased from Sigma. Rabbit anti-mGFP antibody for immunogold labeling was generated in house. Transferrin from human serum, Alexa FluorTM 555 conjugate (T35352), cholera toxin subunit B (recombinant), Alexa FluorTM 647 conjugate (C34778), and wheat germ agglutinin, Alexa FluorTM 488 conjugate (W11261) were purchased from Thermo Fisher Scientific.
Cell lines
BxPC3, MiaPaCa-2, and MOH were provided by Craig Logsdon, KLE and Hec-1a cells by Karen Lu, Hec-1b cells by Bryan Hennessey, and Hec-50 cells by Russell Broaddus, all at MD Anderson Cancer Center, Houston, TX. Other cell lines were purchased from the American Type Culture Collection (ATCC) or provided by the NCI Ras Initiative. The MDCK, A431 cell line, and RAS-less MEF were maintained in Dulbecco's modified Eagle's medium (GIBCO) supplemented with 2 mm l-glutamine and 10% FBS. CHO cells were maintained in Ham's F-12K medium (ATCC) supplemented with 10% FBS 2 mm l-glutamine. BxPC3, MOH, NCI-1975, NCI-23, NCI-2122, NCI-441, and NCI-H508 cells were grown in RPMI 1640 supplemented with 10% FBS. MiaPaCa-2 cells were grown in Dulbecco's modified Eagle's medium supplemented with 10% FBS and 2.5% horse serum. KLE and Hec-50 cells were maintained in Dulbecco's modified Eagle's medium/F-12 medium supplemented with 10% FBS. Hec-1a and Hec-1b cells were grown in McCoy's 5a medium supplemented with 10% FBS. SK-CO-1 cells were maintained in Eagle's minimal essential medium supplemented with 10% FBS. SW948 cells were grown in Leibovitz's L15 medium with 10% FBS.
Fluorescence microscopy
Cells were grown on coverslips and fixed with 4% paraformaldehyde (PFA). The coverslips were mounted in Mowiol and imaged in a confocal microscope (Nikon A1R) using a ×60 or ×100 objective. The Manders coefficient plugin from ImageJ was used for quantification.
EM and spatial analysis
MDCK cells expressing mGFP-tagged protein were seeded on fibronectin-coated gold EM grids (IGG200, Ted Pella Inc.). Cells were grown on the grids for 48 h. Apical PM was removed by placing a Whatman filter paper soaked in PBS onto the cells for 5 min, applying brief pressure, and then removing the PBS-soaked filter paper. The cytosolic surface of the adherent basal PM was exposed because the apical PM was removed. The cytosolic leaflet of the basal PM was washed, fixed with PFA and glutaraldehyde, and labeled with anti-GFP antibody conjugated to 4.5-nm gold particles. Digital images of intact immunogold-labeled PM sheets were obtained via a JEOL 1400 transmission electron microscope at ×100,000 magnification. Intact 1-μm2 areas of the PM sheet were identified and the (x,y) coordinates of the gold particles were determined using ImageJ. Univariate K-functions (35) were calculated as described previously and standardized on the 99% confidence interval (CI) (36–38). Bootstrap tests to examine differences between replicated point patterns were constructed as described previously, and statistical significance was evaluated against 1000 bootstrap samples (38, 39).
Western blotting
Cells were washed in ice-cold phosphate-buffered saline (PBS) and lysed for 10 min on ice in buffer containing 50 mm Tris-Cl (pH 7.5), 75 mm NaCl, 25 mm NaF, 5 mm MgCl2, 5 mm EGTA, 1 mm DTT, 100 μm Na3VO4, 1% Nonidet P-40, and protease inhibitors. The resulting whole cell lysate was centrifuged at 14,000 rpm for 20 min to remove cell debris and 20 μg of the supernatant was analyzed by SDS-PAGE. After SDS-PAGE, proteins were transferred to PVDF membranes using semidry Western transfer. After incubation with primary and secondary antibodies the protein of interest was visualized using enhanced chemiluminescence (SuperSignal; Pierce) with ChemiDoc MP System (Bio-Rad) and quantified with ImageJ.
Lipidomic analysis
WT MDCK cells or MDCK cells stably expressing mGFP-KRASG12V were treated with 1 μm G01 or 5 nm STS for 48 h. Cells were scraped in Dulbecco's PBS (DPBS) and 1.5 × 10⁶ cells/ml in 300 μl was analyzed. Lipid extraction and analysis using electron spray ionization and MS/MS were performed at Lipotype, GmbH (Dresden, Germany), as described previously (40, 41). Automated processing of acquired mass spectra, identification, and quantification of detected lipid species were done by LipidXplorer software. Only lipid identifications with a signal-to-noise ratio >5, an absolute abundance of at least 1 pmol, and a signal intensity 5-fold higher than in corresponding blank samples were considered for further data analysis. The abundance of lipids is presented as pmol of lipids/cell, relative to WT cells.
Lysenin staining
Maltose-binding protein-GFP-lysenin fragment (amino acid residues 161 to 297) was purified as described previously (22, 23). For lysenin staining, MDCK cells were fixed with 4% PFA, permeabilized or not permeabilized with 0.05% saponin, and then incubated with 60 μg/ml of maltose-binding protein-GFP-lysenin for 15 min.
Cell proliferation experiments
Tumor cells or RAS-less MEF cells were seeded in 24-well plates. After 24 h, cells were treated with vehicle (DMSO) or 5 μm G01 for 72 h. The cells were trypsinized and counted. The cell number of G01-treated cells was normalized to that of the DMSO-treated cells.
Statistical analysis
Prism (version 5.0c, GraphPad Software) was used for one-way ANOVA and two-tailed Student's t tests.
Author contributions
L. T., K.-J. C., R. J. C., and J. F. H. conceptualization; L. T., K.-J. C., P. N., R. J. C., and J. F. H. resources; L. T., K.-J. C., and J. F. H. data curation; L. T., K.-J. C., and J. F. H. software; L. T., K.-J. C., and J. F. H. formal analysis; L. T., K.-J. C., and J. F. H. validation; L. T., K.-J. C., P. N., and J. F. H. investigation; L. T. and J. F. H. visualization; L. T., K.-J. C., and J. F. H. methodology; L. T. and J. F. H. writing-original draft; L. T. and J. F. H. project administration; L. T., K.-J. C., P. N., R. J. C., and J. F. H. writing-review and editing; K.-J. C. and J. F. H. supervision; J. F. H. funding acquisition.
This work was supported by Cancer Research and Prevention Institute of Texas (CPRIT) Grant DP150065 (to J. F. H.) and National Institutes of Health NCI Grant R00CA188593 (to K. J. C.). The authors declare that they have no conflicts of interest with the contents of this article. The content is solely the responsibility of the authors and does not necessarily represent the official views of the National Institutes of Health.
- PM
- plasma membrane
- RE
- recycling endosome
- PtdSer
- phosphatidylserine
- SM
- sphingomyelin
- FB1
- fumonisin B1
- STS
- staurosporine
- MDCK
- Madin-Darby canine kidney
- Cer
- ceramide
- GFP
- green fluorescent protein
- CI
- combination index
- EGFR
- epidermal growth factor receptor
- CHO
- Chinese hamster ovary
- TfR
- transferrin receptor
- WGA
- wheat germ agglutinin
- MAPK
- mitogen-activated protein kinase
- FBS
- fetal bovine serum
- PFA
- paraformaldehyde
- ANOVA
- analysis of variance
- ERK
- extracellular signal-regulated kinase.
References
- 1. Prior I. A., Lewis P. D., and Mattos C. (2012) A comprehensive survey of Ras mutations in cancer. Cancer Res. 72, 2457–2467 10.1158/0008-5472.CAN-11-2612 [DOI] [PMC free article] [PubMed] [Google Scholar]
- 2. Cox A. D., Fesik S. W., Kimmelman A. C., Luo J., and Der C. J. (2014) Drugging the undruggable RAS: mission possible? Nat. Rev. Drug Discov. 13, 828–851 10.1038/nrd4389 [DOI] [PMC free article] [PubMed] [Google Scholar]
- 3. Prior I. A., and Hancock J. F. (2012) Ras trafficking, localization and compartmentalized signalling. Semin. Cell Dev. Biol. 23, 145–153 10.1016/j.semcdb.2011.09.002 [DOI] [PMC free article] [PubMed] [Google Scholar]
- 4. Zhou Y., and Hancock J. F. (2015) Ras nanoclusters: Versatile lipid-based signaling platforms. Biochim. Biophys. Acta 1853, 841–849 10.1016/j.bbamcr.2014.09.008 [DOI] [PubMed] [Google Scholar]
- 5. Hancock J. F. (2003) Ras proteins: different signals from different locations. Nat. Rev. Mol. Cell Biol. 4, 373–384 10.1038/nrm1105 [DOI] [PubMed] [Google Scholar]
- 6. Hancock J. F., Magee A. I., Childs J. E., and Marshall C. J. (1989) All ras proteins are polyisoprenylated but only some are palmitoylated. Cell 57, 1167–1177 10.1016/0092-8674(89)90054-8 [DOI] [PubMed] [Google Scholar]
- 7. Laude A. J., and Prior I. A. (2008) Palmitoylation and localisation of RAS isoforms are modulated by the hypervariable linker domain. J. Cell Sci. 121, 421–427 10.1242/jcs.020107 [DOI] [PubMed] [Google Scholar]
- 8. Hancock J. F., Paterson H., and Marshall C. J. (1990) A polybasic domain or palmitoylation is required in addition to the CAAX motif to localize p21ras to the plasma membrane. Cell 63, 133–139 10.1016/0092-8674(90)90294-O [DOI] [PubMed] [Google Scholar]
- 9. Rocks O., Peyker A., Kahms M., Verveer P. J., Koerner C., Lumbierres M., Kuhlmann J., Waldmann H., Wittinghofer A., and Bastiaens P. I. (2005) An acylation cycle regulates localization and activity of palmitoylated Ras isoforms. Science 307, 1746–1752 10.1126/science.1105654 [DOI] [PubMed] [Google Scholar]
- 10. Dekker F. J., Rocks O., Vartak N., Menninger S., Hedberg C., Balamurugan R., Wetzel S., Renner S., Gerauer M., Schölermann B., Rusch M., Kramer J. W., Rauh D., Coates G. W., Brunsveld L., Bastiaens P. I., and Waldmann H. (2010) Small-molecule inhibition of APT1 affects Ras localization and signaling. Nat. Chem. Biol. 6, 449 10.1038/nchembio.362 [DOI] [PubMed] [Google Scholar]
- 11. Rocks O., Gerauer M., Vartak N., Koch S., Huang Z.-P., Pechlivanis M., Kuhlmann J., Brunsveld L., Chandra A., Ellinger B., Waldmann H., and Bastiaens P. I. (2010) The palmitoylation machinery is a spatially organizing system for peripheral membrane proteins. Cell 141, 458–471 10.1016/j.cell.2010.04.007 [DOI] [PubMed] [Google Scholar]
- 12. Goodwin J. S., Drake K. R., Rogers C., Wright L., Lippincott-Schwartz J., Philips M. R., and Kenworthy A. K. (2005) Depalmitoylated Ras traffics to and from the Golgi complex via a nonvesicular pathway. J. Cell Biol. 170, 261–272 10.1083/jcb.200502063 [DOI] [PMC free article] [PubMed] [Google Scholar]
- 13. Misaki R., Morimatsu M., Uemura T., Waguri S., Miyoshi E., Taniguchi N., Matsuda M., and Taguchi T. (2010) Palmitoylated Ras proteins traffic through recycling endosomes to the plasma membrane during exocytosis. J. Cell Biol. 191, 23–29 10.1083/jcb.200911143 [DOI] [PMC free article] [PubMed] [Google Scholar]
- 14. Zhou M., Wiener H., Su W., Zhou Y., Liot C., Ahearn I., Hancock J. F., and Philips M. R. (2016) VPS35 binds farnesylated N-Ras in the cytosol to regulate N-Ras trafficking. J. Cell Biol. 214, 445–458 10.1083/jcb.201604061 [DOI] [PMC free article] [PubMed] [Google Scholar]
- 15. Schmick M., Vartak N., Papke B., Kovacevic M., Truxius D. C., Rossmannek L., and Bastiaens P. I. H. (2014) KRas localizes to the plasma membrane by spatial cycles of solubilization, trapping and vesicular transport. Cell 157, 459–471 10.1016/j.cell.2014.02.051 [DOI] [PubMed] [Google Scholar]
- 16. Rowinsky E. K. (2006) Lately, it occurs to me what a long, strange trip it's been for the farnesyltransferase inhibitors. J. Clin. Oncol. 24, 2981–2984 10.1200/JCO.2006.05.9808 [DOI] [PubMed] [Google Scholar]
- 17. Sebti S. M., and Der C. J. (2003) Searching for the elusive targets of farnesyltransferase inhibitors. Nat. Rev. Cancer 3, 945–951 10.1038/nrc1234 [DOI] [PubMed] [Google Scholar]
- 18. Papke B., and Der C. J. (2017) Drugging RAS: know the enemy. Science 355, 1158–1163 10.1126/science.aam7622 [DOI] [PubMed] [Google Scholar]
- 19. Zimmermann G., Papke B., Ismail S., Vartak N., Chandra A., Hoffmann M., Hahn S. A., Triola G., Wittinghofer A., Bastiaens P. I. H., and Waldmann H. (2013) Small molecule inhibition of the KRAS–PDEδ interaction impairs oncogenic KRAS signalling. Nature 497, 638–642 10.1038/nature12205 [DOI] [PubMed] [Google Scholar]
- 20. Zhou Y., Prakash P., Liang H., Cho K-j., Gorfe A. A., and Hancock J. F. (2017) Lipid-Sorting specificity encoded in K-Ras membrane anchor regulates signal output. Cell 168, 239–251 10.1016/j.cell.2016.11.059 [DOI] [PMC free article] [PubMed] [Google Scholar]
- 21. Ariotti N., Fernández-Rojo M. A., Zhou Y., Hill M. M., Rodkey T. L., Inder K. L., Tanner L. B., Wenk M. R., Hancock J. F., and Parton R. G. (2014) Caveolae regulate the nanoscale organization of the plasma membrane to remotely control Ras signaling. J. Cell Biol. 204, 777–792 10.1083/jcb.201307055 [DOI] [PMC free article] [PubMed] [Google Scholar]
- 22. Cho K-j., van der Hoeven D., Zhou Y., Maekawa M., Ma X., Chen W., Fairn G. D., and Hancock J. F. (2016) Inhibition of acid sphingomyelinase depletes cellular phosphatidylserine and mislocalizes K-Ras from the plasma membrane. Mol. Cell Biol. 36, 363–374 [DOI] [PMC free article] [PubMed] [Google Scholar]
- 23. van der Hoeven D., Cho K-j., Zhou Y., Ma X., Chen W., Naji A., Montufar-Solis D., Zuo Y., Kovar S. E., and Levental K. R. (2017) Sphingomyelin metabolism is a regulator of K-Ras function. Mol. Cell Biol. 38, e00373–e00317 10.1128/MCB.00373-17 [DOI] [PMC free article] [PubMed] [Google Scholar]
- 24. Maekawa M., Lee M., Wei K., Ridgway N. D., and Fairn G. D. (2016) Staurosporines decrease ORMDL proteins and enhance sphingomyelin synthesis resulting in depletion of plasmalemmal phosphatidylserine. Sci. Rep. 6, 35762 10.1038/srep35762 [DOI] [PMC free article] [PubMed] [Google Scholar]
- 25. Salim A. A., Xiao X., Cho K.-J., Piggott A. M., Lacey E., Hancock J. F., and Capon R. J. (2014) Rare Streptomyces sp. polyketides as modulators of K-Ras localisation. Org. Biomol. Chem. 12, 4872–4878 10.1039/C4OB00745J [DOI] [PMC free article] [PubMed] [Google Scholar]
- 26. Choy E., Chiu V. K., Silletti J., Feoktistov M., Morimoto T., Michaelson D., Ivanov I. E., and Philips M. R. (1999) Endomembrane trafficking of ras: the CAAX motif targets proteins to the ER and Golgi. Cell 98, 69–80 10.1016/S0092-8674(00)80607-8 [DOI] [PubMed] [Google Scholar]
- 27. Cho K-j., Park J.-H., Piggott A. M., Salim A. A., Gorfe A. A., Parton R. G., Capon R. J., Lacey E., and Hancock J. F. (2012) Staurosporines disrupt phosphatidylserine trafficking and mislocalize Ras proteins. J. Biol. Chem. 287, 43573–43584 10.1074/jbc.M112.424457 [DOI] [PMC free article] [PubMed] [Google Scholar]
- 28. Chou T.-C. (2010) Drug combination studies and their synergy quantification using the Chou-Talalay method. Cancer Res. 70, 440–446 10.1158/1538-7445.AM10-440,10.1158/0008-5472.CAN-09-1947 [DOI] [PubMed] [Google Scholar]
- 29. Ghosh R. N., and Maxfield F. R. (1995) Evidence for nonvectorial, retrograde transferrin trafficking in the early endosomes of HEp2 cells. J. Cell Biol. 128, 549–561 10.1083/jcb.128.4.549 [DOI] [PMC free article] [PubMed] [Google Scholar]
- 30. Somsel Rodman J., and Wandinger-Ness A. (2000) Rab GTPases coordinate endocytosis. J. Cell Sci. 113, 183–192 [DOI] [PubMed] [Google Scholar]
- 31. Roepstorff K., Grandal M. V., Henriksen L., Knudsen S. L. J., Lerdrup M., Grøvdal L., Willumsen B. M., and Van Deurs B. (2009) Differential effects of EGFR ligands on endocytic sorting of the receptor. Traffic 10, 1115–1127 10.1111/j.1600-0854.2009.00943.x [DOI] [PMC free article] [PubMed] [Google Scholar]
- 32. Parton R. G. (1994) Ultrastructural localization of gangliosides; GM1 is concentrated in caveolae. J. Histochem. Cytochem. 42, 155–166 [DOI] [PubMed] [Google Scholar]
- 33. Drosten M., Dhawahir A., Sum E. Y. M., Urosevic J., Lechuga C. G., Esteban L. M., Castellano E., Guerra C., Santos E., and Barbacid M. (2010) Genetic analysis of Ras signalling pathways in cell proliferation, migration and survival. EMBO J. 29, 1091–1104 10.1038/emboj.2010.7 [DOI] [PMC free article] [PubMed] [Google Scholar]
- 34. van der Hoeven D., Cho K-j., Ma X., Chigurupati S., Parton R. G., and Hancock J. F. (2013) Fendiline inhibits K-Ras plasma membrane localization and blocks K-Ras signal transmission. Mol. Cell Biol. 33, 237–251 10.1128/MCB.00884-12 [DOI] [PMC free article] [PubMed] [Google Scholar]
- 35. Ripley B. (1977) Modelling spatial patterns (with discussion). J. R. Stat. Soc. Ser. B 39, 172–212 2984796 [Google Scholar]
- 36. Hancock J. F., and Prior I. A. (2005) Electron microscopic imaging of Ras signaling domains. Methods 37, 165–172 10.1016/j.ymeth.2005.05.018 [DOI] [PMC free article] [PubMed] [Google Scholar]
- 37. Prior I. A., Muncke C., Parton R. G., and Hancock J. F. (2003) Direct visualization of Ras proteins in spatially distinct cell surface microdomains. J. Cell Biol. 160, 165–170 10.1083/jcb.200209091 [DOI] [PMC free article] [PubMed] [Google Scholar]
- 38. Diggle P. J., Mateu J., and Clough H. E. (2000) A comparison between parametric and non-parametric approaches to the analysis of replicated spatial point patterns. Adv. Appl. Probab. 32, 331–343 10.1239/aap/1013540166 [DOI] [Google Scholar]
- 39. Plowman S. J., Muncke C., Parton R. G., and Hancock J. F. (2005) H-ras, K-ras, and inner plasma membrane raft proteins operate in nanoclusters with differential dependence on the actin cytoskeleton. Proc. Natl. Acad. Sci. U.S.A. 102, 15500–15505 10.1073/pnas.0504114102 [DOI] [PMC free article] [PubMed] [Google Scholar]
- 40. Gerl M. J., Sampaio J. L., Urban S., Kalvodova L., Verbavatz J.-M., Binnington B., Lindemann D., Lingwood C. A., Shevchenko A., Schroeder C., and Simons K. (2012) Quantitative analysis of the lipidomes of the influenza virus envelope and MDCK cell apical membrane. J. Cell Biol. 196, 213–221 10.1083/jcb.201108175 [DOI] [PMC free article] [PubMed] [Google Scholar]
- 41. Sampaio J. L., Gerl M. J., Klose C., Ejsing C. S., Beug H., Simons K., and Shevchenko A. (2011) Membrane lipidome of an epithelial cell line. Proc. Natl. Acad. Sci. U.S.A. 108, 1903–1907 10.1073/pnas.1019267108 [DOI] [PMC free article] [PubMed] [Google Scholar]